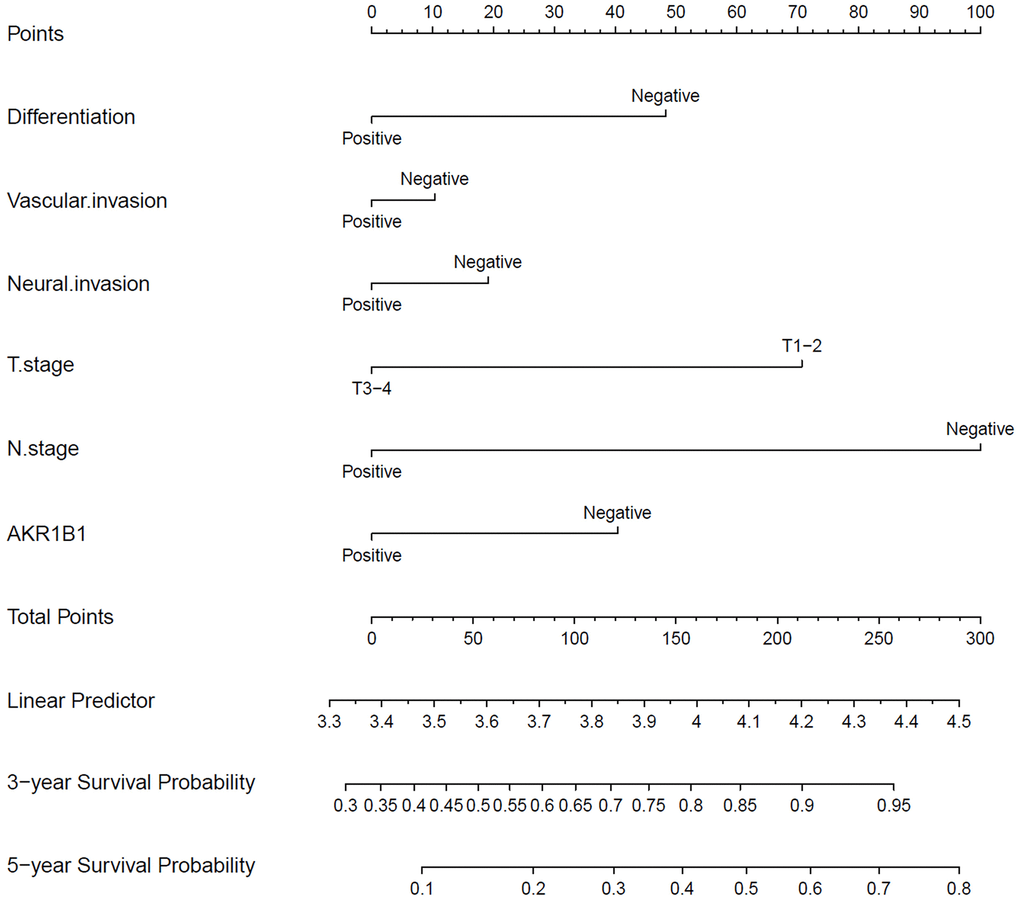
Figure 3.The nomograms for predicting 3- and 5-year overall survival of GC patients. The points of each variable were obtained using a vertical line between each variable and the point scale. The predicted survival rate was connected with the total points through a vertical line drawn from the total points scale to the overall survival.