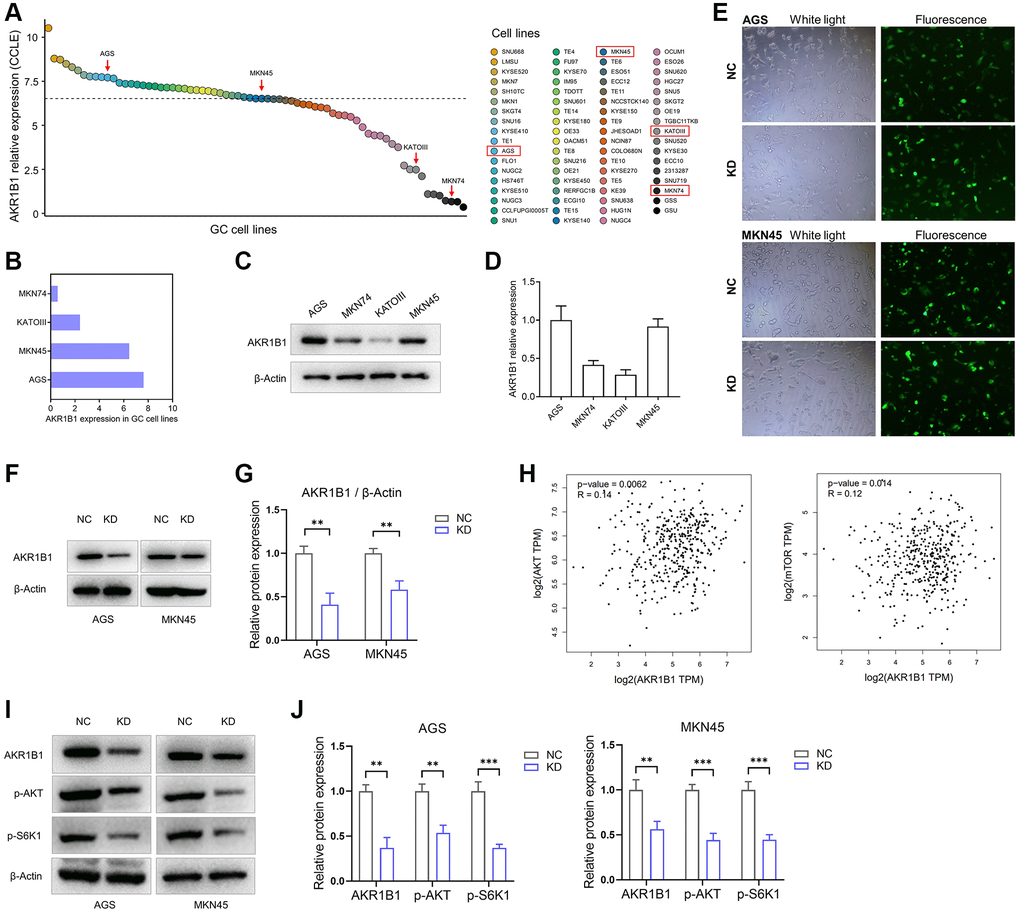
Figure 4.AKR1B1-KD cells were constructed, and the regulatory relationship between AKR1B1 and AKT-mTOR pathway was evaluated. (A) The AKR1B1 expression in GC cell lines was searched from the CCLE platform. (B) The CCLE platform helped select AKR1B1 expression in four GC cell lines. (C) AKR1B1 expression in four GC cell lines was detected using western blotting. (D) The immunoblot result of AKR1B1 expression was semi-quantified in four GC cell lines with ImageJ. (E) The white and fluorescence microscope images of AGS and MKN45 cells were transfected with control-shRNA (NC) and AKR1B1-shRNA (KD). (F) Western blot indicates the AKR1B1 protein levels in NC and AKR1B1-KD AGS and MKN45. (G) The immunoblot results were semi-quantified using ImageJ. (H) The GEPIA platform was used to determine the correlation analysis of AKR1B1 and AKT or mTOR gene expression levels in GC patients from TCGA datasets. (I) Western blot reveals the AKR1B1, p-AKT, p-S6K1, and β-actin protein levels in AKR1B1-KD GC cells. (J) The immunoblot results of AGS were semi-quantified using ImageJ. Abbreviations: CCLE: Cancer Cell Line Encyclopedia; NC: negative control; KD: AKR1B1-shRNA. **P < 0.01, ***P < 0.001.