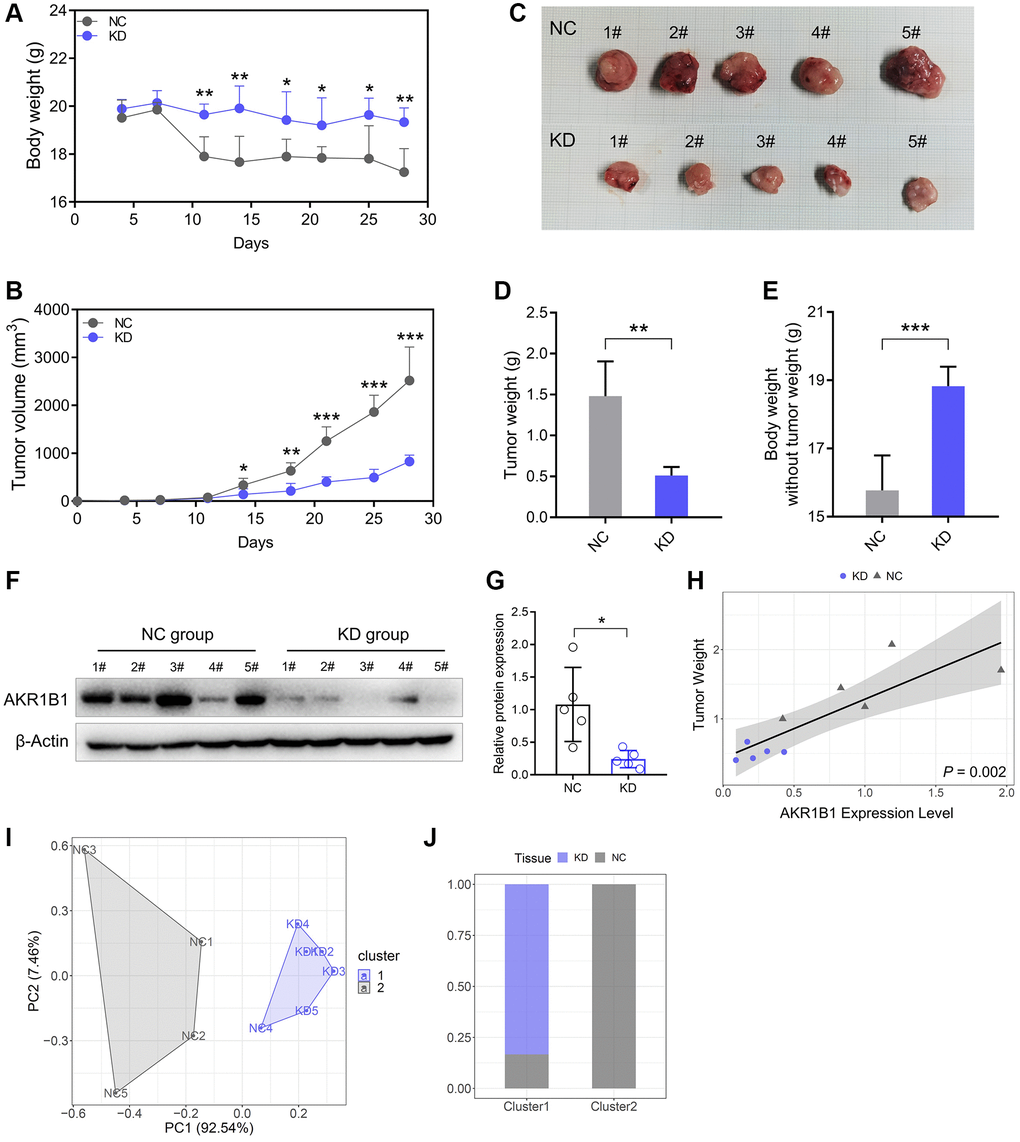
Figure 6.Reduced AKR1B1 inhibits GC tumor growth in vivo. (A) During the experiment, the body weight of mice was recorded twice a week. (B) The tumor volume of mice was recorded twice a week during the experiment. (C) The representative images of subcutaneous tumors harvested from NC and AKR1B1-KD groups. (D) The weights of tumor masses. (E) Net body weight after subtracting the respective tumor weights. (F) AKR1B1 expression was detected in subcutaneous tumors using western blotting. (G) The immunoblot result of AKR1B1 expression in subcutaneous tumors was semi-quantified using ImageJ. (H) The association analysis between the AKR1B1 expression levels in tumor tissues and weight. (I) The stratification of mice in Cluster 1 and Cluster 2 depends on the tumor weight and AKR1B1 expression levels. (J) The percentage of NC and AKR1B1-KD mice in each cluster. n = 5 for each group. Abbreviations: NC: negative control; KD: AKR1B1-shRNA. *P < 0.05, **P < 0.01, ***P < 0.001.