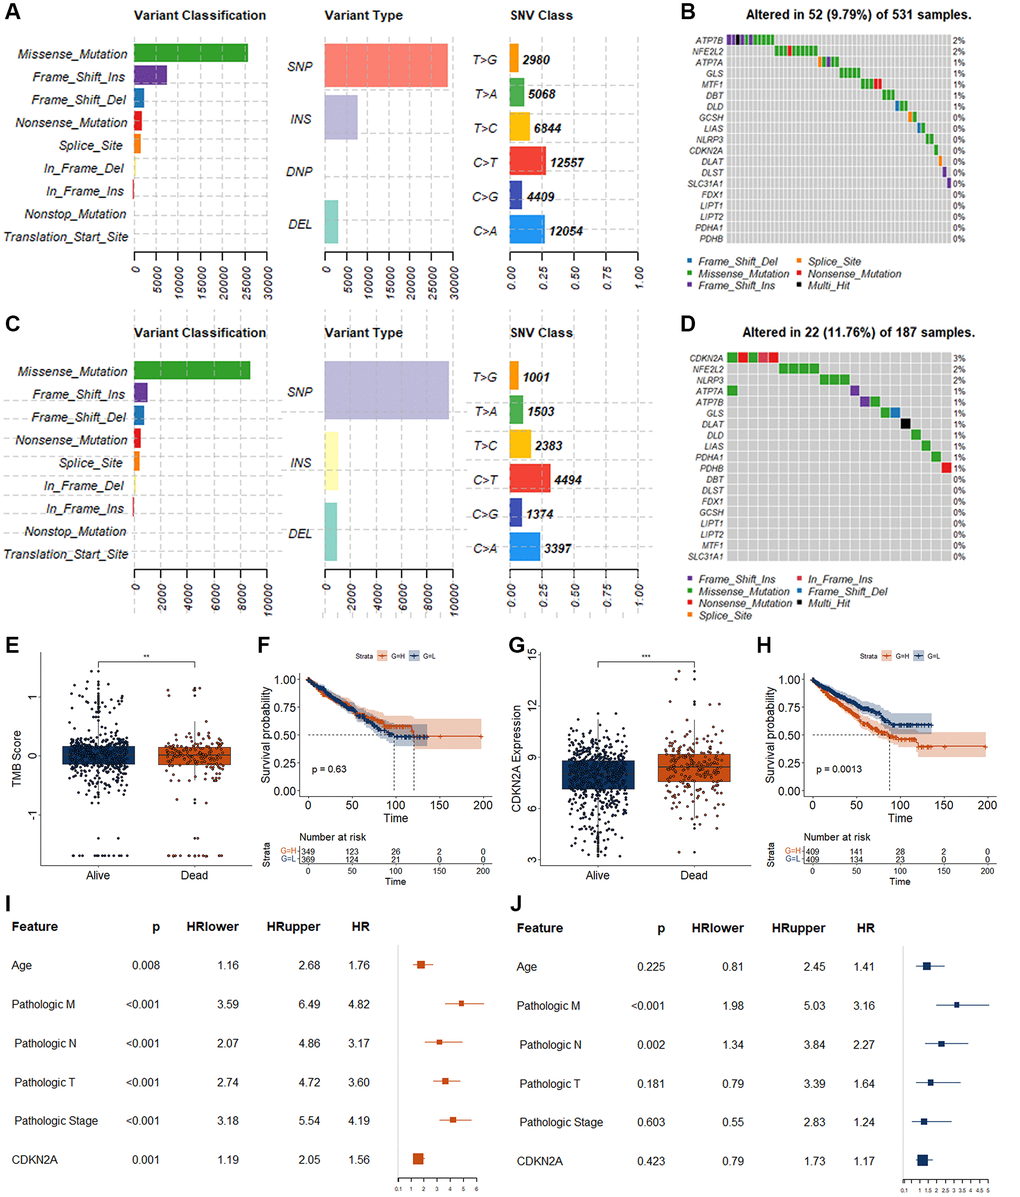
Figure 1.Genetic variations and biomarker screening of CRGs in RCC. (A) Summary of variation in alive RCC patients. The x axis represents the number of mutations, and the y axis represents the category of mutation. (B) Genetic mutations landscape of 19 CRGs in alive RCC patients. (C) Summary of variation in dead RCC patients. The x axis represents the number of mutations, and the y axis represents the category of mutation. (D) Genetic mutations landscape of 19 CRGs in dead RCC patients. (E) Analysis of TMB difference in patients with different survival status of RCC. (F) K-M curve for RCC patients with different TMB score. H, represents high TMB group as measured by the median value. L, represents low TMB group as measured by the median value. (G) Expression level of CDKN2A in patients with different survival status of RCC. (F) K-M curve for RCC patients with different CDKN2A expression level. (H) represents high expression group as measured by the median value. L, represents low expression group as measured by the median value. (I, J) Results of univariate (I) and multivariate (J) Cox regression for CDKN2A and different clinical features. *p < 0.05. **p < 0.01.