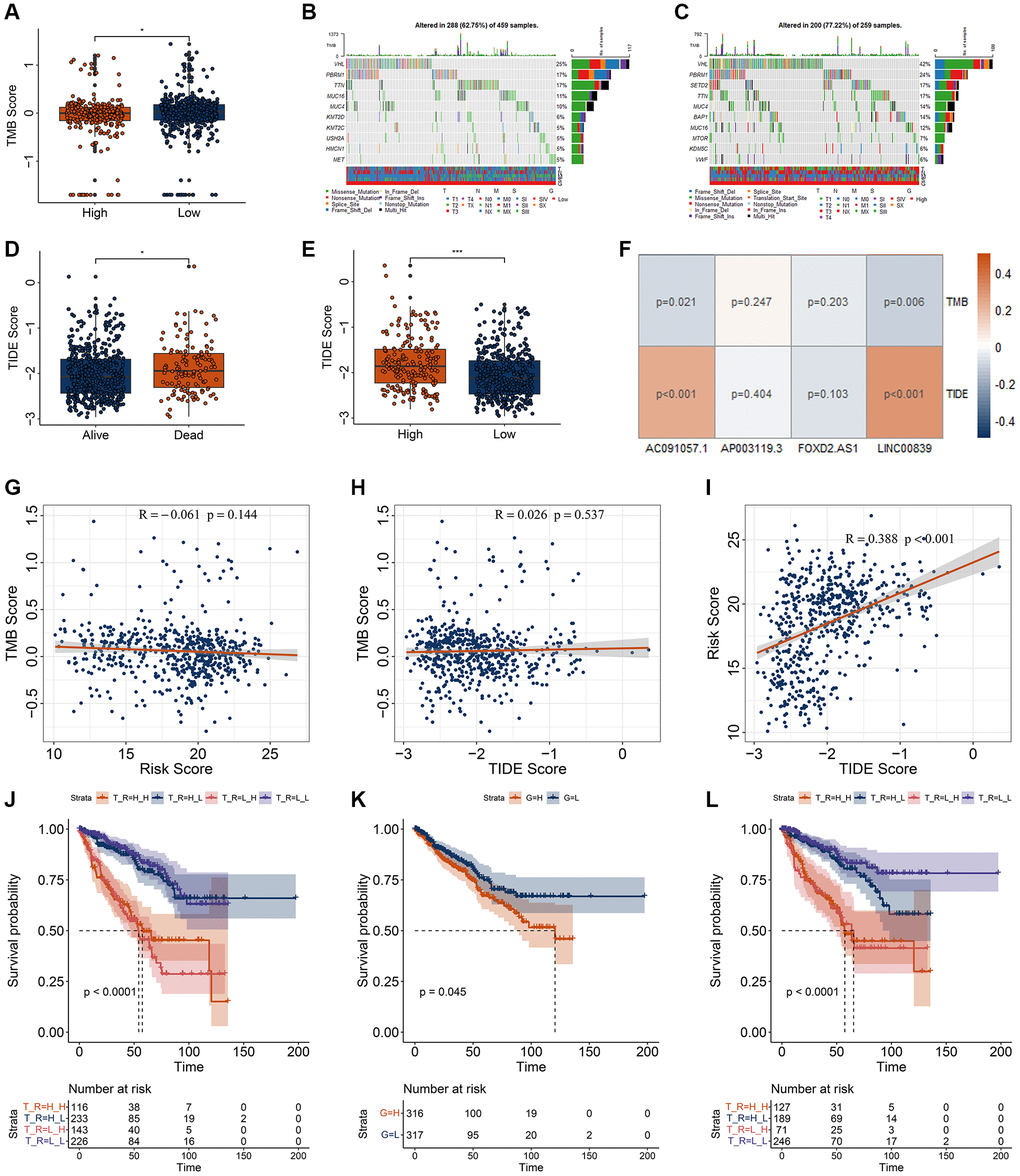
Figure 6.Correlation analysis for the TMB and TIDE with risk model. (A) Differential analysis of TMB for RCC patients with different risk score. (B, C) genetic mutation of RCC patients with low- (B) and high-risk (C) score. (D, E) Differential analysis of TIDE for RCC patients with different vital status (D) and risk score (E). (F) Correlation of four DECRLs with the TMB and TIDE score. (G–I) Correlation analysis of TMB, TIDE, and risk score. (G) Correlation of risk score with TMB score. (H) Correlation of TIDE score with TMB score. (I) Correlation of risk score with TIDE score. (J) K-M curve for RCC patients with different TMB and risk score. H_H, represents high TMB + high risk. H_L, represents high TMB + low risk. L_H, represents low TMB + high risk. L_L, represents low TMB + low risk. (K) K-M curve for RCC patients with different TIDE. H, represents high TIDE. L, represents low TIDE. (L) K-M curve for RCC patients with different TIDE and risk score. H_H, represents high TIDE + high risk. H_L, represents high TIDE + low risk. L_H, represents low TIDE + high risk. L_L, represents low TIDE + low risk. *p < 0.05. **p < 0.01. ***p < 0.001.