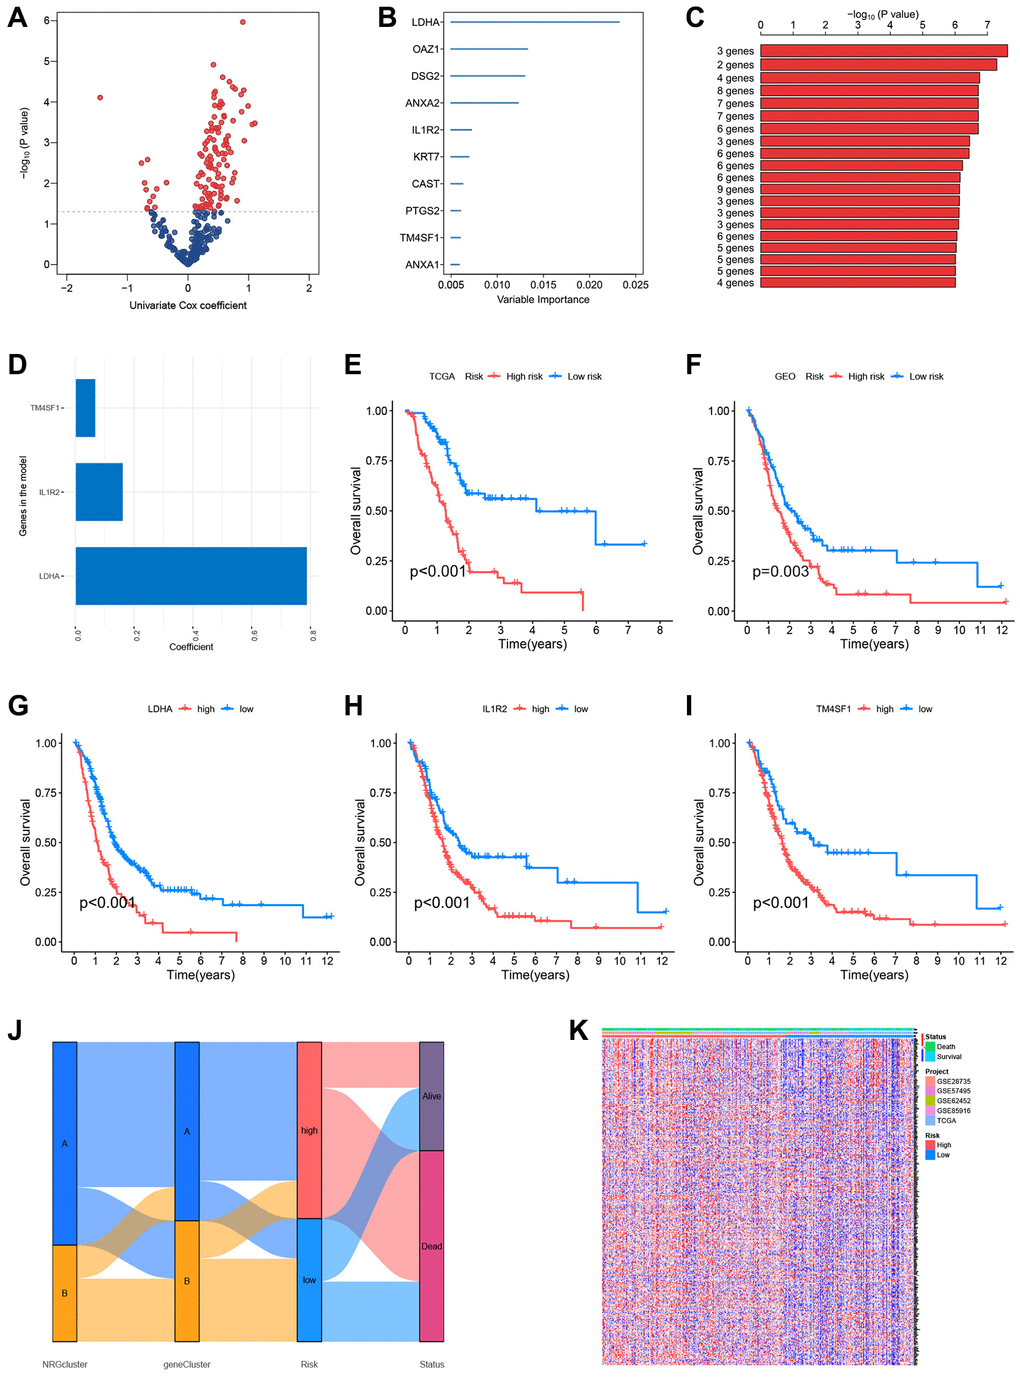
Figure 7.Construction of the prognostic risk score model. (A) Volcano plot of univariate Cox regression analysis results. Red dots represent neutrophil-related genes associated with pancreatic cancer prognosis. (B) Random survival forest analysis identified the top 10 important genes. (C) After survival analysis of 210−1 = 1023 combinations, the top 20 models were sorted according to P-values. The best model comprised three genes. (D) Coefficients of genes in the model. (E) The Cancer Genome Atlas (TCGA) dataset (Kaplan-Meir curve of the training set). (F) GSE28735, GSE62452, GSE57495, and GSE85916 datasets from the Gene Expression Omnibus (GEO) platform (Kaplan-Meir curves of the validation set). Survival curves of patients according to the expression of LDHA (G), IL1R2 (H), and TM4SF1 (I). (J) Sankey plots of different subtypes, risk groups, and survival states. (K) The expression of neutrophil-associated genes in high-risk and low-risk groups, most neutrophil-associated genes are upregulated in the high-risk groups.