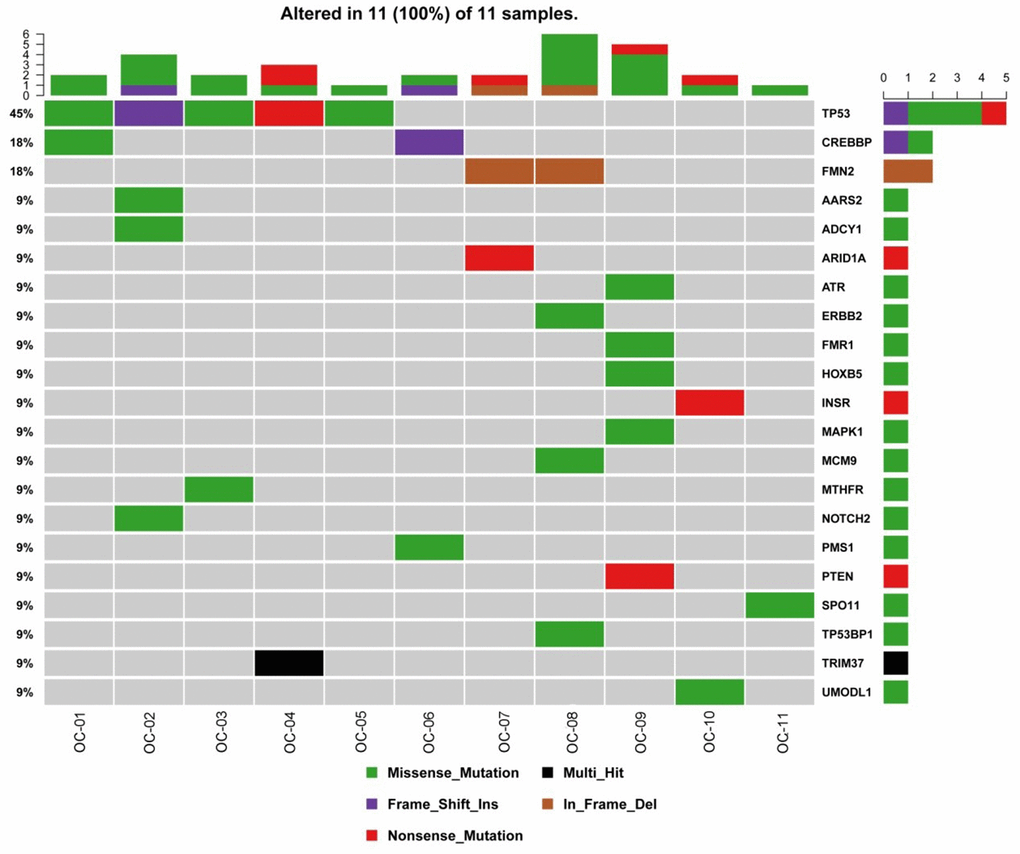
Figure 2.Gene mutations in OC. The top bar plot and the bottom left plot represent average somatic mutations and somatic mutation frequency, respectively. In the bottom middle plot, rows and columns denote individual genes and tumors, respectively. In the bottom right plot, mutations are colored by mutation type. OC, ovarian cancer.