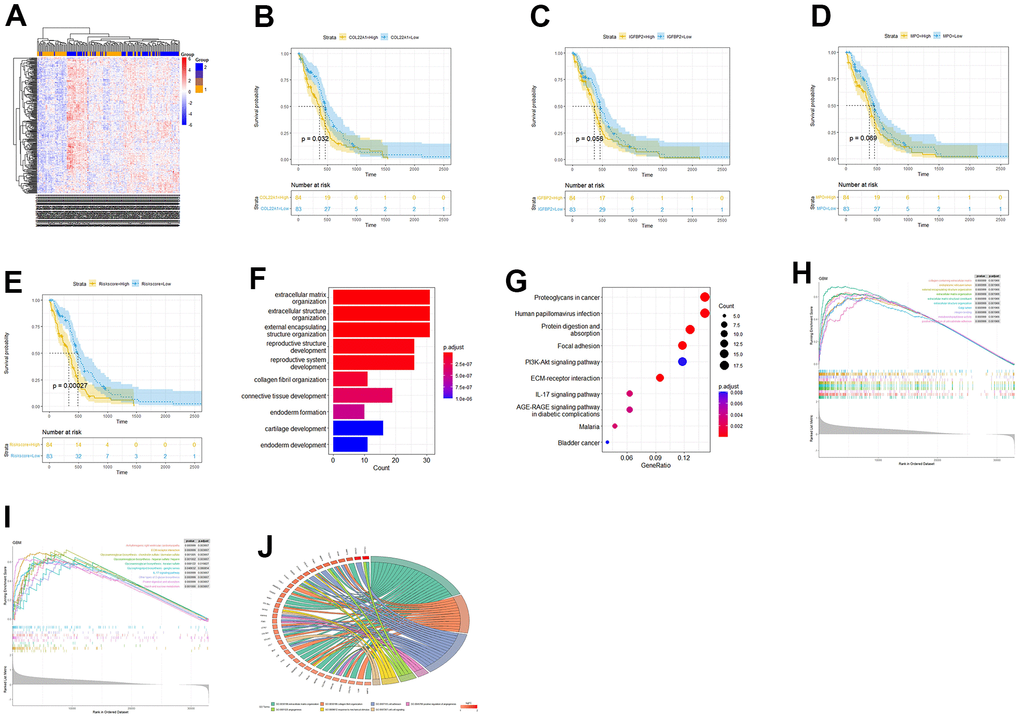
Figure 3.Risk score-based OS and functional enrichment analyses. (A) Heatmap of DEGs based on risk score stratification. (B–E) Kaplan-Meier curves based on COL22A1, IGFBP2, MPO, and risk scores. (F) Barplot of GO-BP terms enriched with DEGs between high- and low-risk groups. (G) Dot-plot of DEGs-enriched KEGG pathways. (H) GSEA based on GO. (I) GSEA based on KEGG. (J) Circos plot based on enriched GO terms.