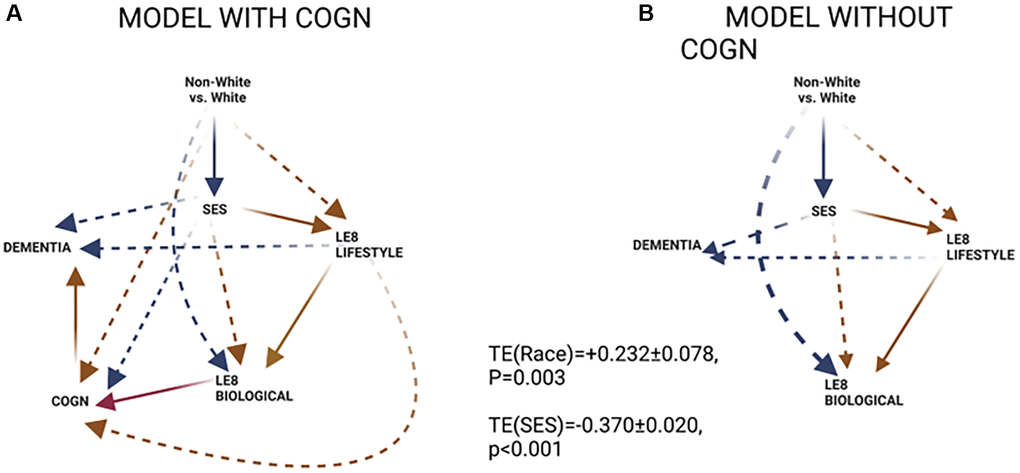
Figure 2.GSEM findings. (A) Model with COGN as a proximal mediator; (B) Model without COGN as a proximal mediator. Abbreviations: COGN: Poor cognitive performance, z-score; LE8BIOLOGICAL: Biological sub-scale of Life’s Essential 8; LE8LIFESTYLE: Lifestyle sub-scale of Life’s Essential 8; SES: Socio-economic status; Red lines: positive associations; Blue lines: inverse associations; Solid line: within hypothesized pathway; Dashed line: outside hypothesized pathway.