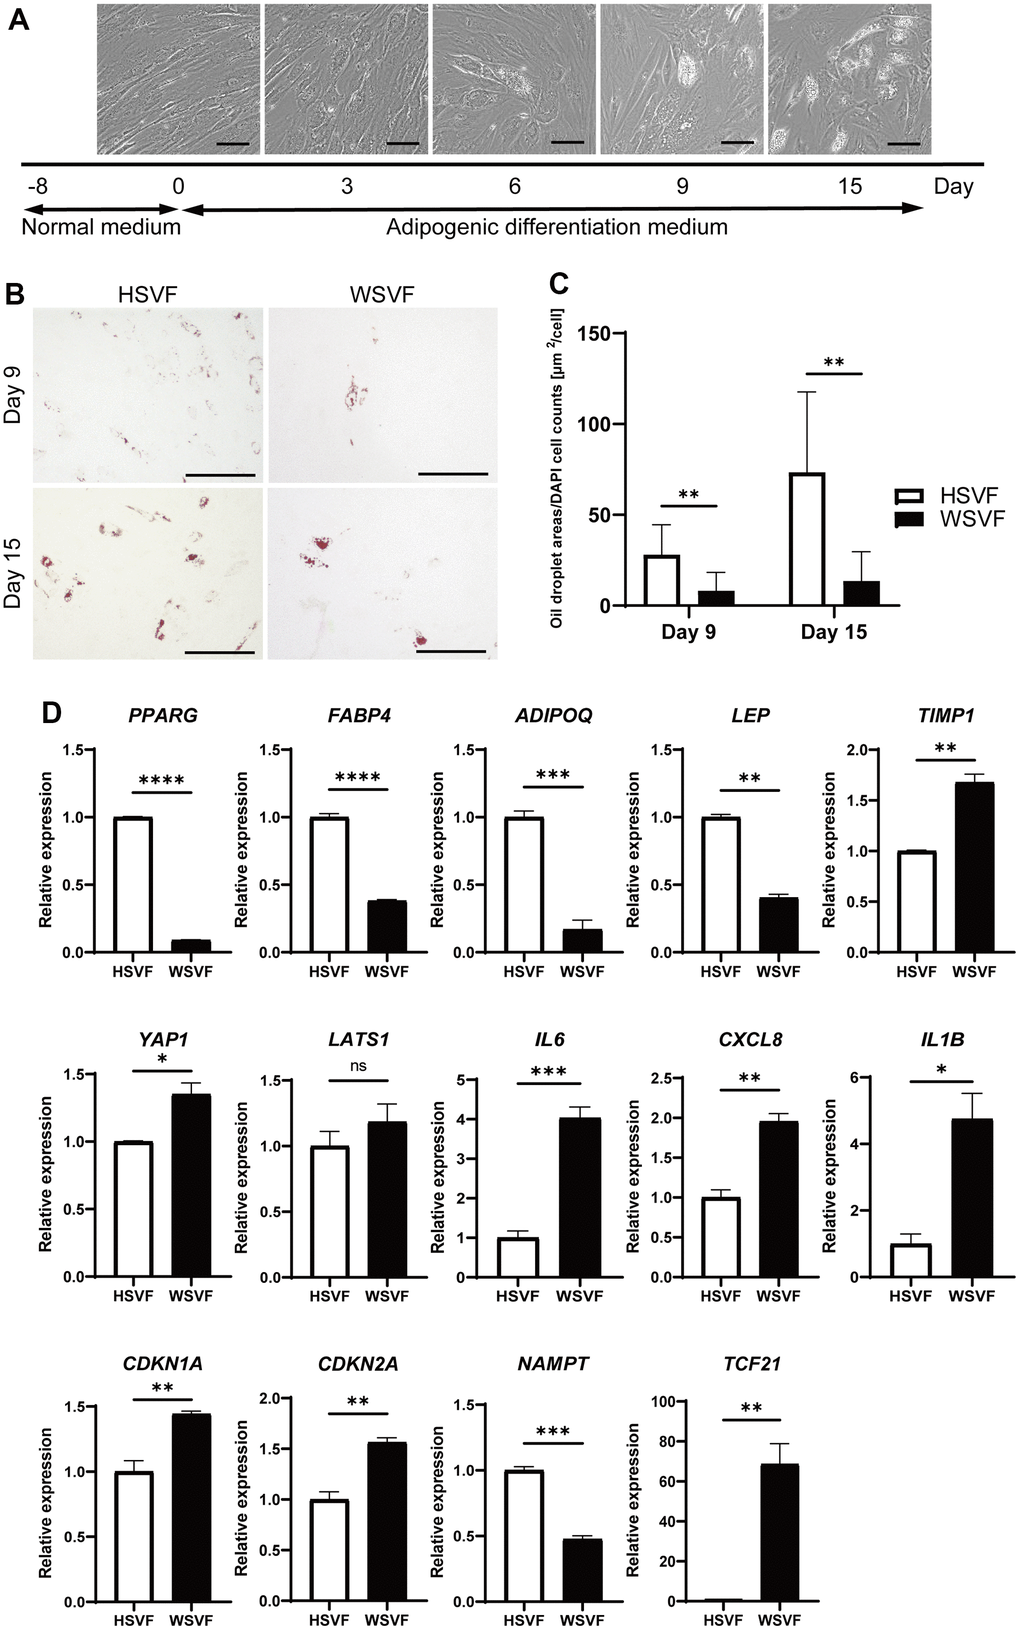
Figure 4.Adipogenesis is suppressed in WS. (A) Schematic illustration of the adipogenesis experiment. Representative images on days 0, 3, 6, 9, and 15. Scale bar, 100 μm. (B) Representative images of Oil Red O staining on days 9 and 15 after adipogenesis in HSVF and WSVF. Scale bar, 300 μm. (C) Quantification of the oil droplet area based on DAPI cell counts. Data are presented as means ± S.E.M. from nine different microscopic views. For statistical analysis, student t-test was performed (**p < 0.01). (D) Quantitative real-time polymerase chain reaction of the relative gene expression during adipogenesis of three technical replicates. For statistical analysis, student t-test was performed (ns, not significant; *p < 0.05; **p < 0.01; ***p < 0.001). WS: Werner syndrome; SVF: stromal vascular fraction; HSVF: SVF derived from a healthy patient; WSVF: SVF derived from a patient with WS.