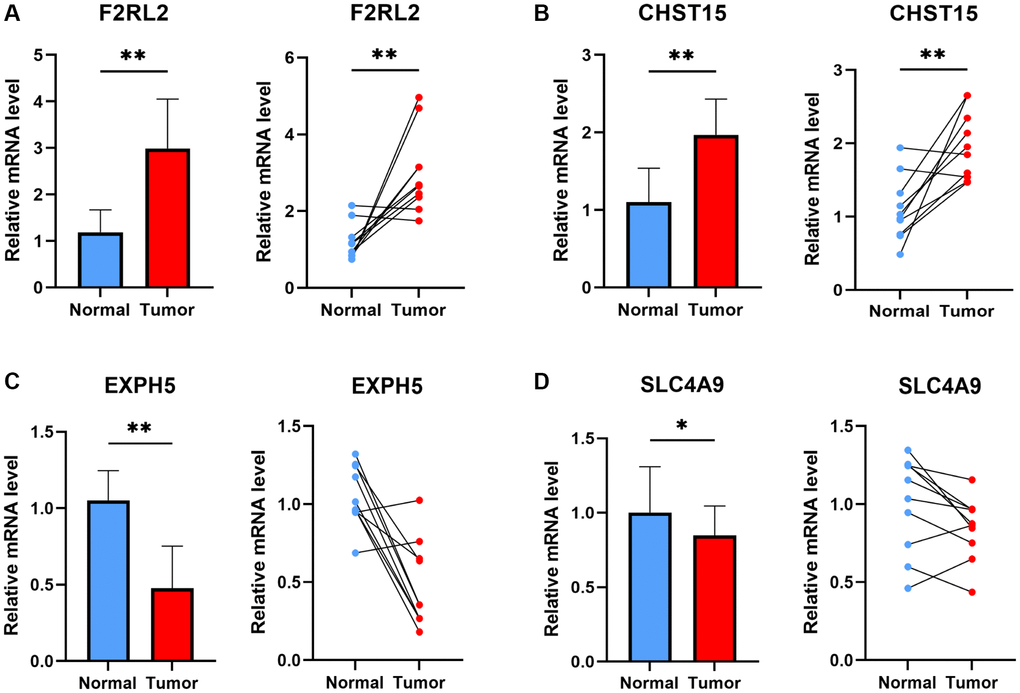
Figure 11.The experiment of ESCC risk-related genes. The expression of F2RL2 (A), CHST15 (B), EXPH5 (C), and SLC4A9 (D) in normal esophageal tissue and ESCC tissue of patients. t-test was used to compare the expression of genes between normal and tumor. (*p < 0.05, **p < 0.01).