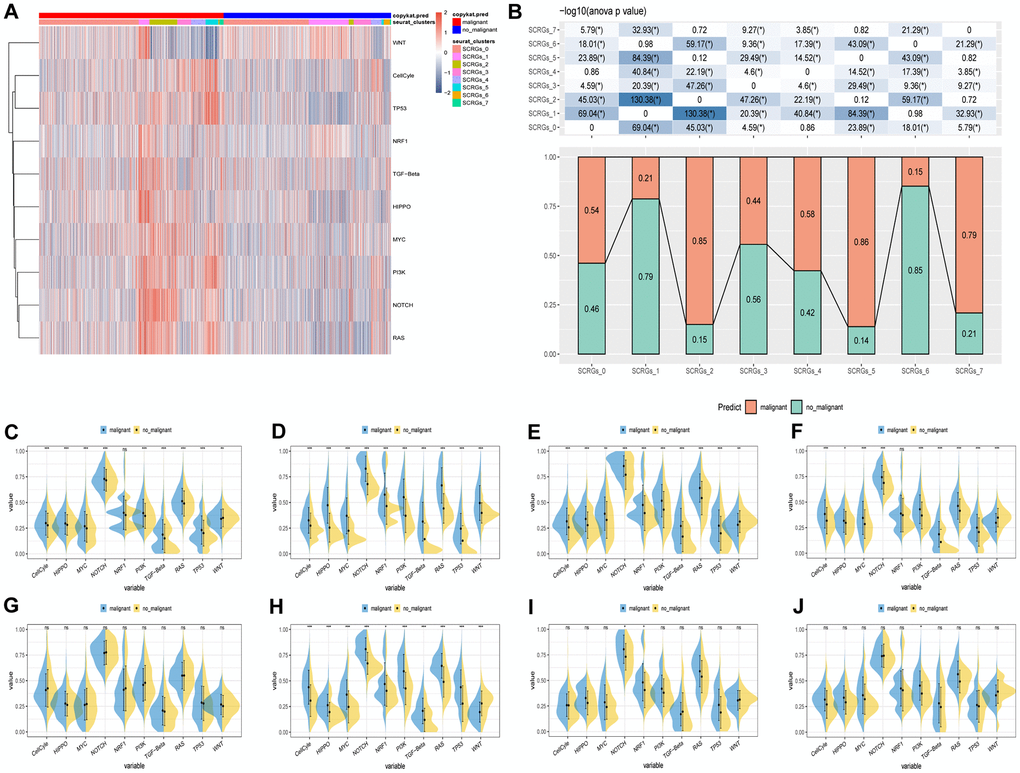
Figure 3.The characteristics of tumor-associated pathways in SCRGs clusters. (A) Heatmap of 10 tumor-associated pathways enriched in SCRGs cells. (B) Comparison between each cluster based on proportions of malignant and non-malignant cells. (C–J) Comparison of each pathway between malignant and non-malignant cells based on GSVA score in SCRGs clusters. (Wilcox. Test, *P < 0.05; **P < 0.01; ***P < 0.001; Abbreviation: ns: not significant).