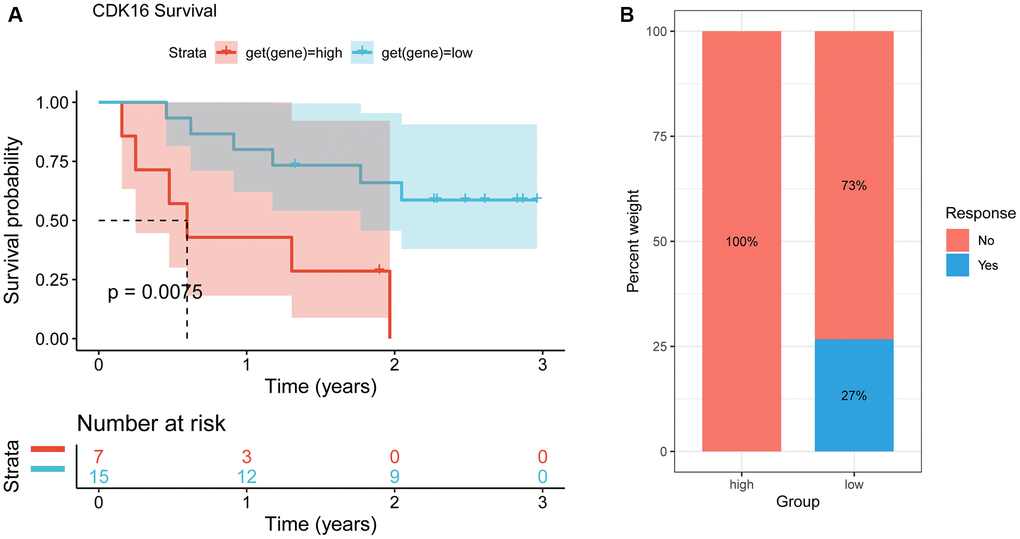
Figure 11.Correlation between CDK16 and immunotherapy. (A) The Kaplan-Meier overall survival analysis of responsive patients in high- and low- CDK16 expression groups (GSE91061). (B) The Kaplan-Meier OS analysis and percentage of responsive patients in high- and low-CDK16 expression groups of GSE91061 cohort.