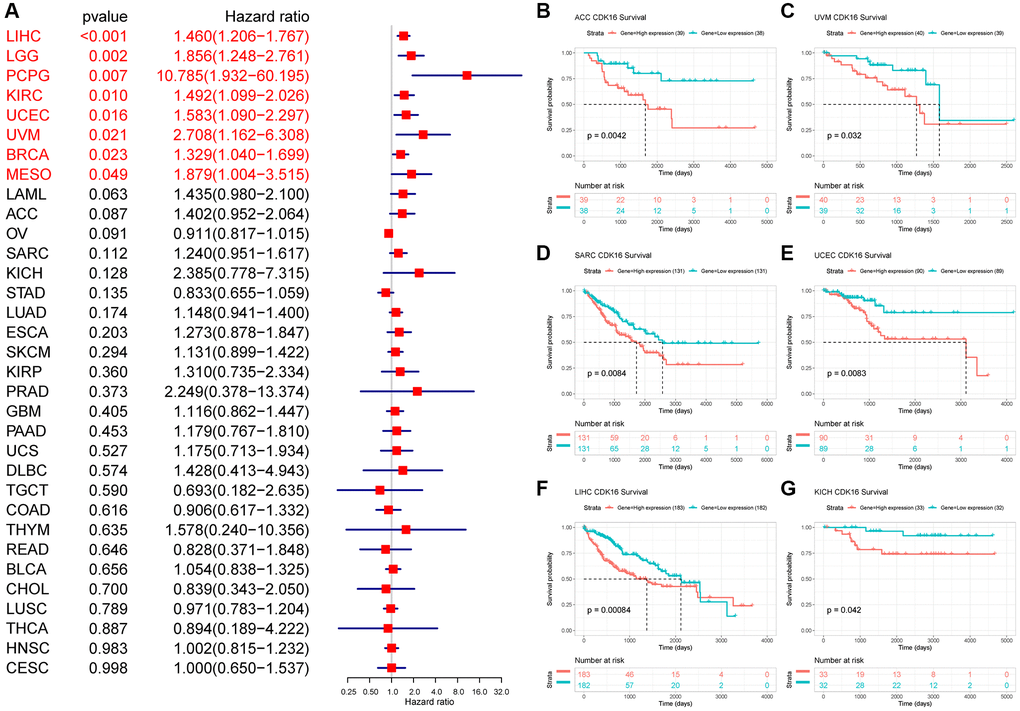
Figure 3.Relationship between CDK16 level and OS. (A) The univariate Cox regression OS analysis of CDK16 in TCGA pan-cancer. Red color represents significant results (p < 0.05). (B–G) Kaplan-Meier curves showing OS in pan-cancer.
Figure 3 — CDK16 as a potential prognostic biomarker correlated with an immunosuppressive tumor microenvironment and benefits in enhancing the effectiveness of immunotherapy in human cancers | Aging