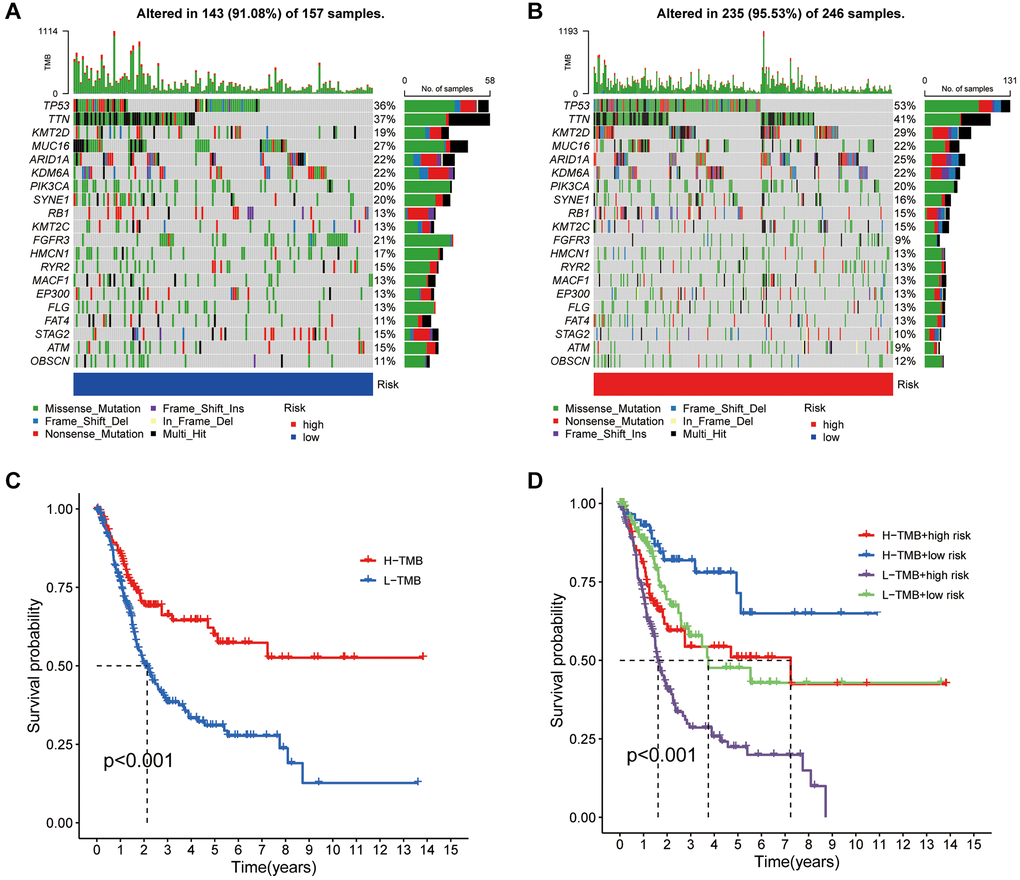
Figure 6.Mutation analysis based on the risk score model. (A, B) Waterfall plots summarizing the mutation status of high and low-risk patients. (C) Kaplan-Meier curves of high and low TMB groups. (D) Kaplan-Meier curves of four groups classified by risk score and TMB.