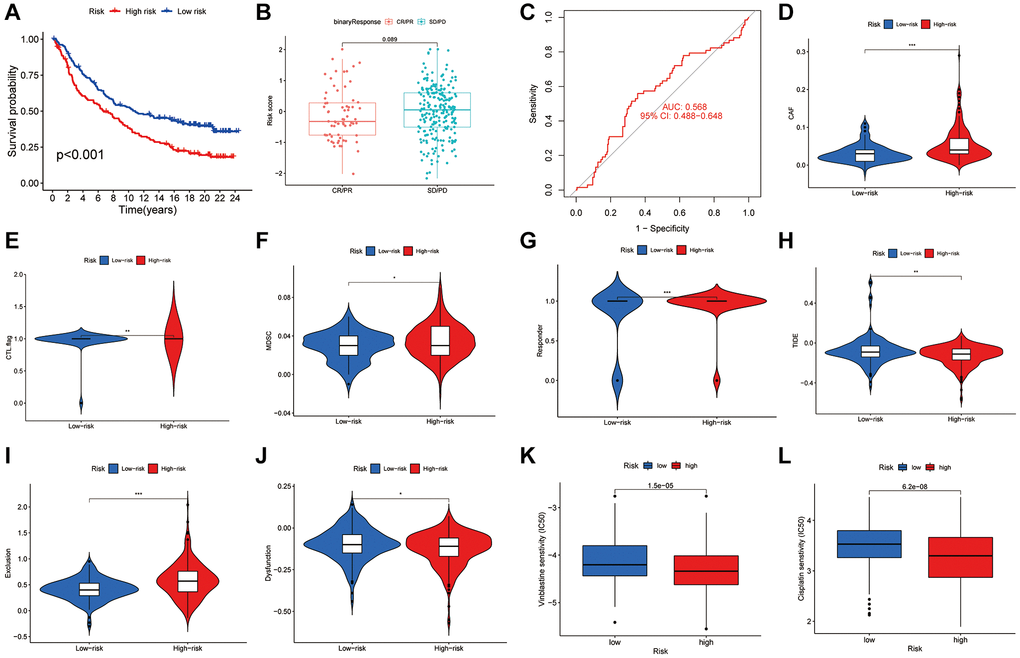
Figure 8.The role of disulfidptosis patterns in immunotherapy and chemotherapy. (A) Kaplan-Meier curves of high and low-risk groups in IMvigor210. (B) The difference of disulfidptosis score between treatment outcome groups. (C) ROC curves of the nomogram score system for BLCA patients in IMvigor210. (D–J) Correlation between risk score and Tide score. (K–L) Correlation between risk score and Vinblastine and cisplatin sensitivity.