Submit an Article
Navigate
Home
Editorial Board
Editorial Policies
Current Volume
Archive
Scientific Integrity
Publication Ethics Statements
Interviews with Outstanding Authors
Newsroom
Sponsored Conferences
Podcast
Contact
Special Collections
Submit an Article
Online ISSN: 1945-4589
Research Paper
|
Volume 16
CCNA2 and KIF23 are molecular targets for the prognosis of adenoid cystic carcinoma
Back to article
Figure 7
(7 of 13)
−
100%
+
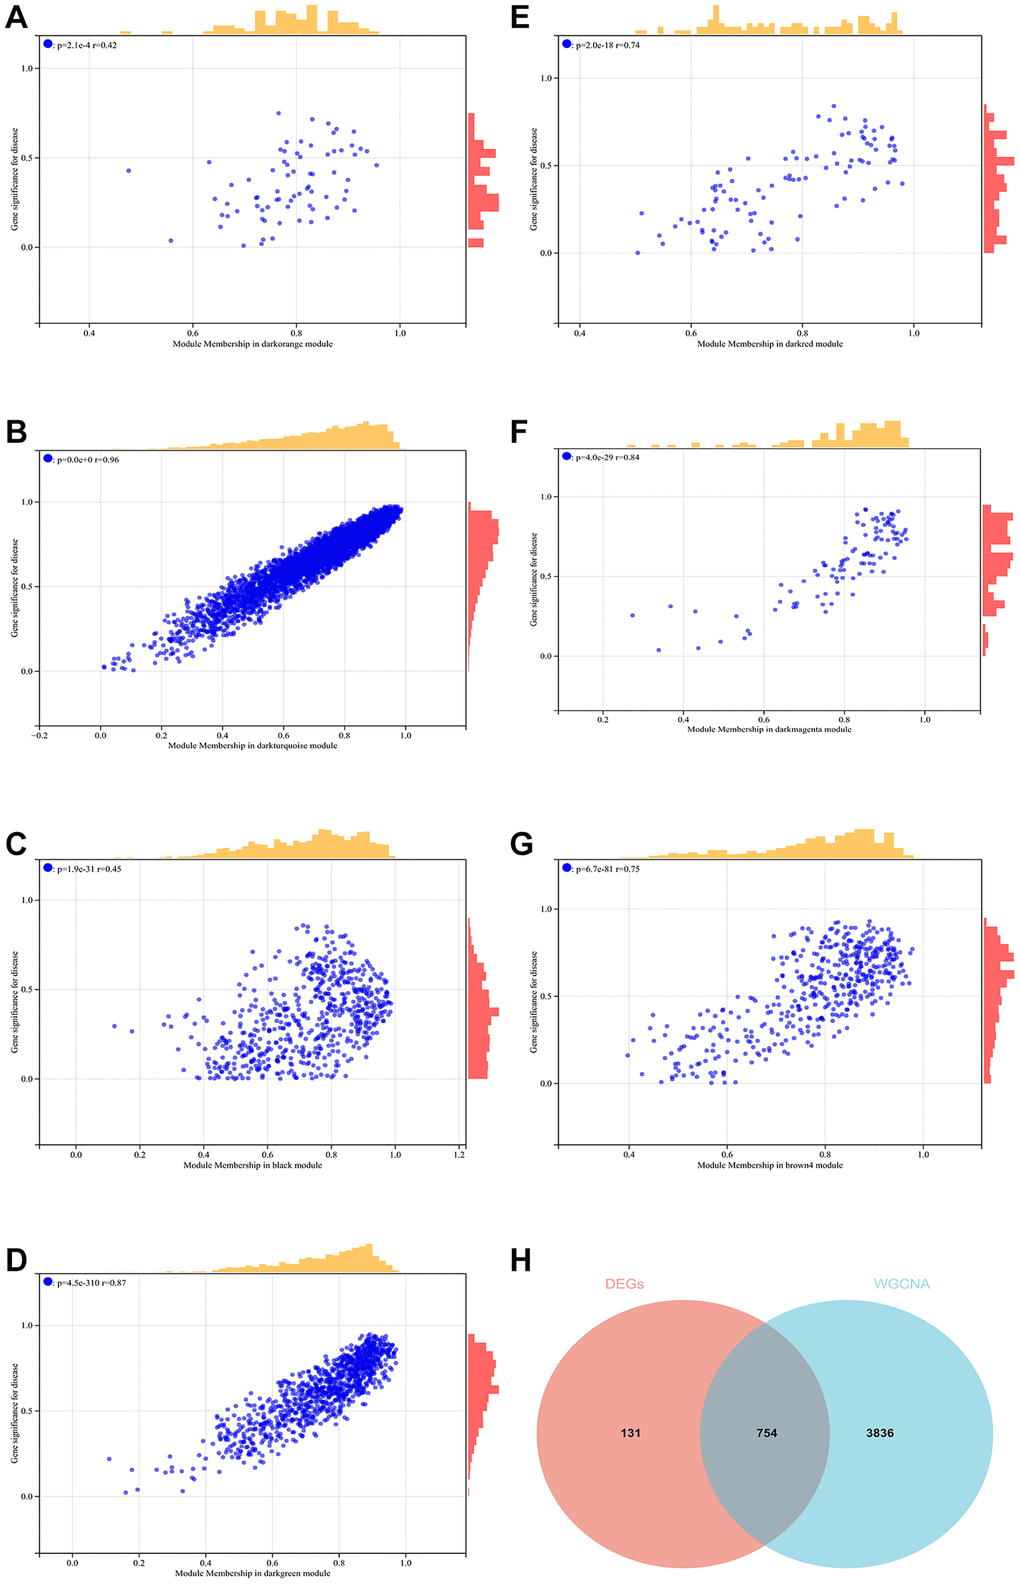
Figure 7.
WGCNA.
(
A
–
G
) GS-MM correlation scatter map of related hub genes. (
H
) The Venn diagram of the differential genes screened by WGCNA and DEGs and take the intersection to create and analyze the protein-protein interaction network.