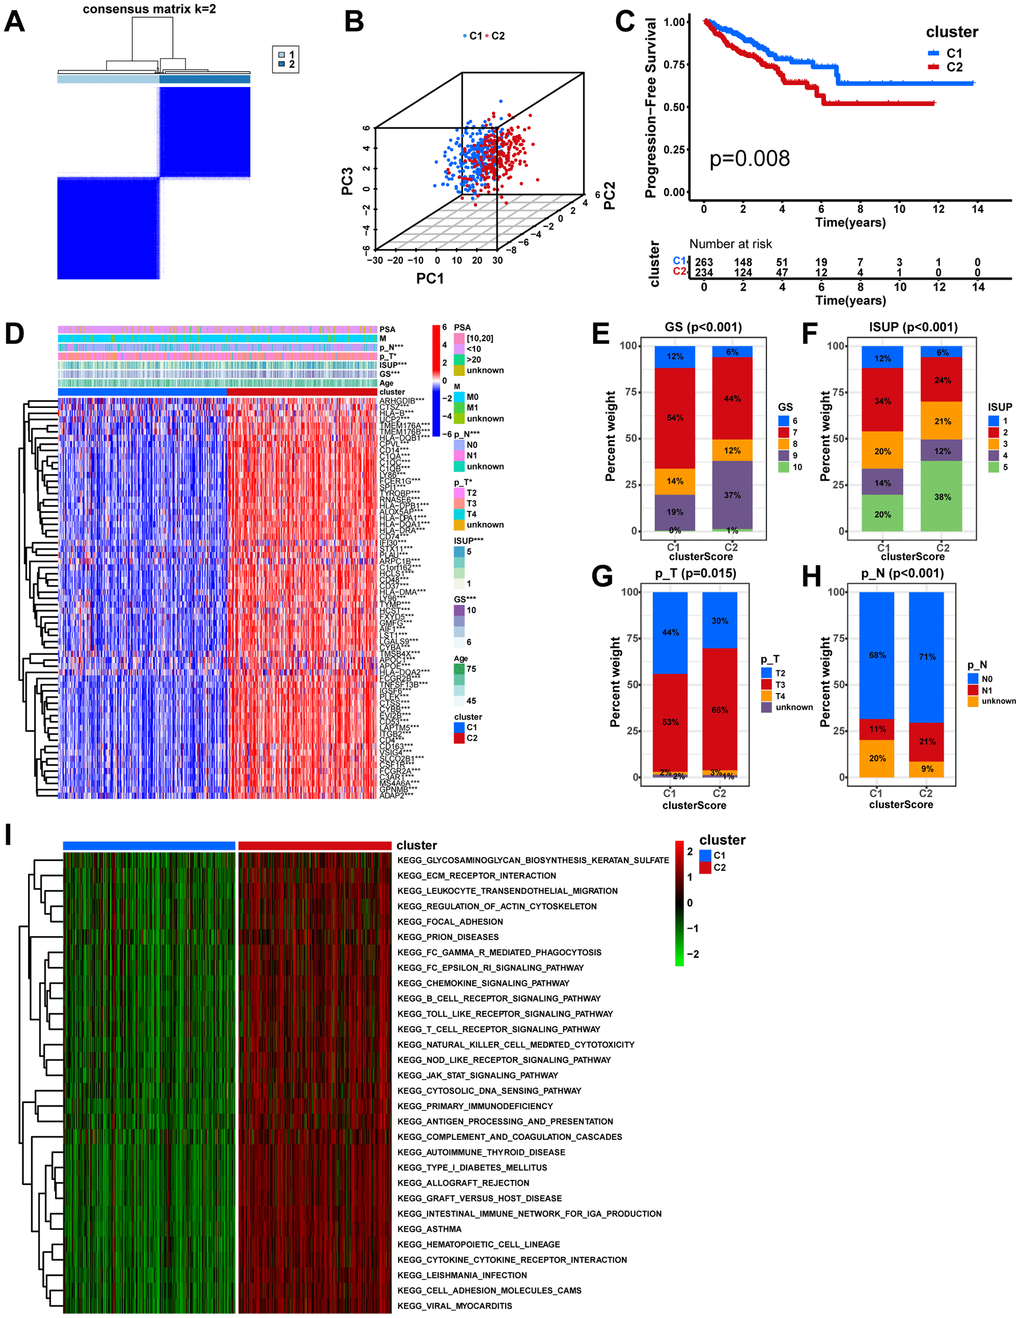
Figure 4.Unsupervised consensus analysis in the TCGA cohort. (A) Based on the expression of the 65 macrophage-related intersection genes, PCa patients in the TCGA cohort were separated into two distinct clusters when k = 2. (B) According to the 3D PCA plots, the cluster well-differentiated PCa patients from one another. (C) The KM analysis between different clusters. (D) Heatmap showing the expression levels of the 65 macrophage-related intersection genes and the distribution of clinicopathological features between clusters. The fractions of GS (E) ISUP (F), pathologic T stage (G), and pathologic N stage (H) between cluster groups. (I) The heatmap displays the GSVA result between distinct macrophage-related clusters. ns, not significant; **P < 0.01; ***P < 0.001.