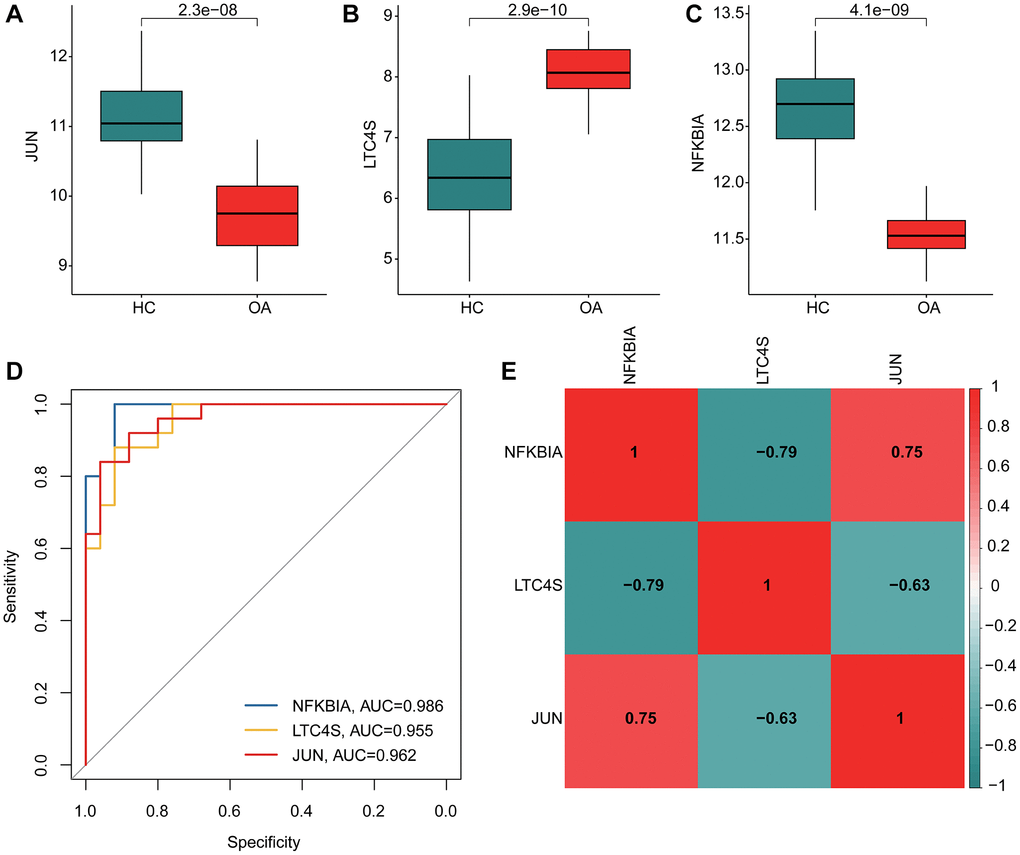
Figure 5.Immune cell infiltration analysis of HC and OA based on CIBERSORT algorithm. (A–C) The expression of JUN, NFKB1A and LTC4S in OA and HC groups. (D) Nomogram construction and ROC curve of three gene signatures. (E) Correlation heatmap of BCKDHB, LETMD1, and NDUFB3. Green color represents negative correlation, red color represents positive correlation.