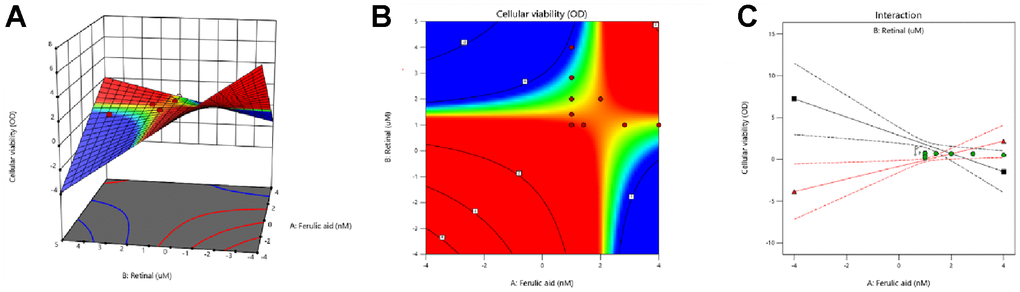
Figure 5.Response surface analysis was used to verify the optimal ratio of FA to VA. (A) 3D response surface model diagram of administrated groups; (B, C) Response surface plane projection of VA and FA.
Figure 5 — Ferulic acid in synergy with retinol alleviates oxidative injury of HaCaT cells during UVB-induced photoaging | Aging