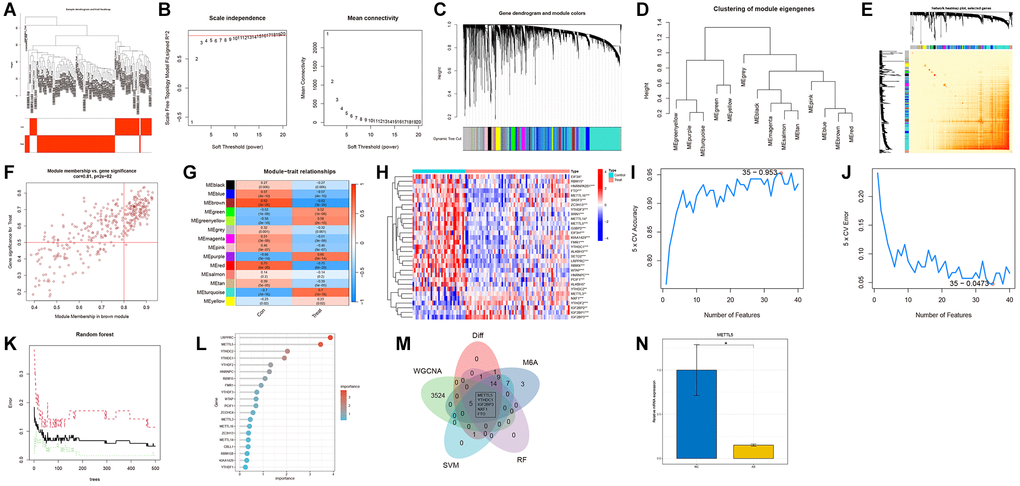
Figure 1.Construction of the co-expression network using weighted gene co-expression network analysis (WGCNA). (A) Sample clustering dendrogram with tree leaves corresponding to individual samples. (B) Soft threshold β = 10 and scale-free topological fit index (R2). (C) The original and combined modules of the clustering tree. (D) Representative clustering of module eigengenes. (E) Representative heatmap of the correlation between 14 modules. (F) Scatter plot between module membership in brown module and the gene significance for AS. (G) Correlation analysis between module eigengenes and clinical status. Each row represents a module, while each column represents a clinical status. (H) The expression patterns of 31 N6-methyladenosine (m6A)-related genes (M6ARGs) were presented in the heatmap. (I, J) Biomarker signature gene expression validation using the support vector machine recursive feature elimination (SVM-RFE) algorithm. (K) Random Forest error rate versus the number of classification trees. (L) The top 20 relatively important genes. (M) Venn diagram for screening genes. (N) Relative mRNA level of METTL5 in atherosclerosis (AS) (yellow bars) and healthy tissues (blue bars). *p < 0.05, **p < 0.01 and ***p < 0.001.