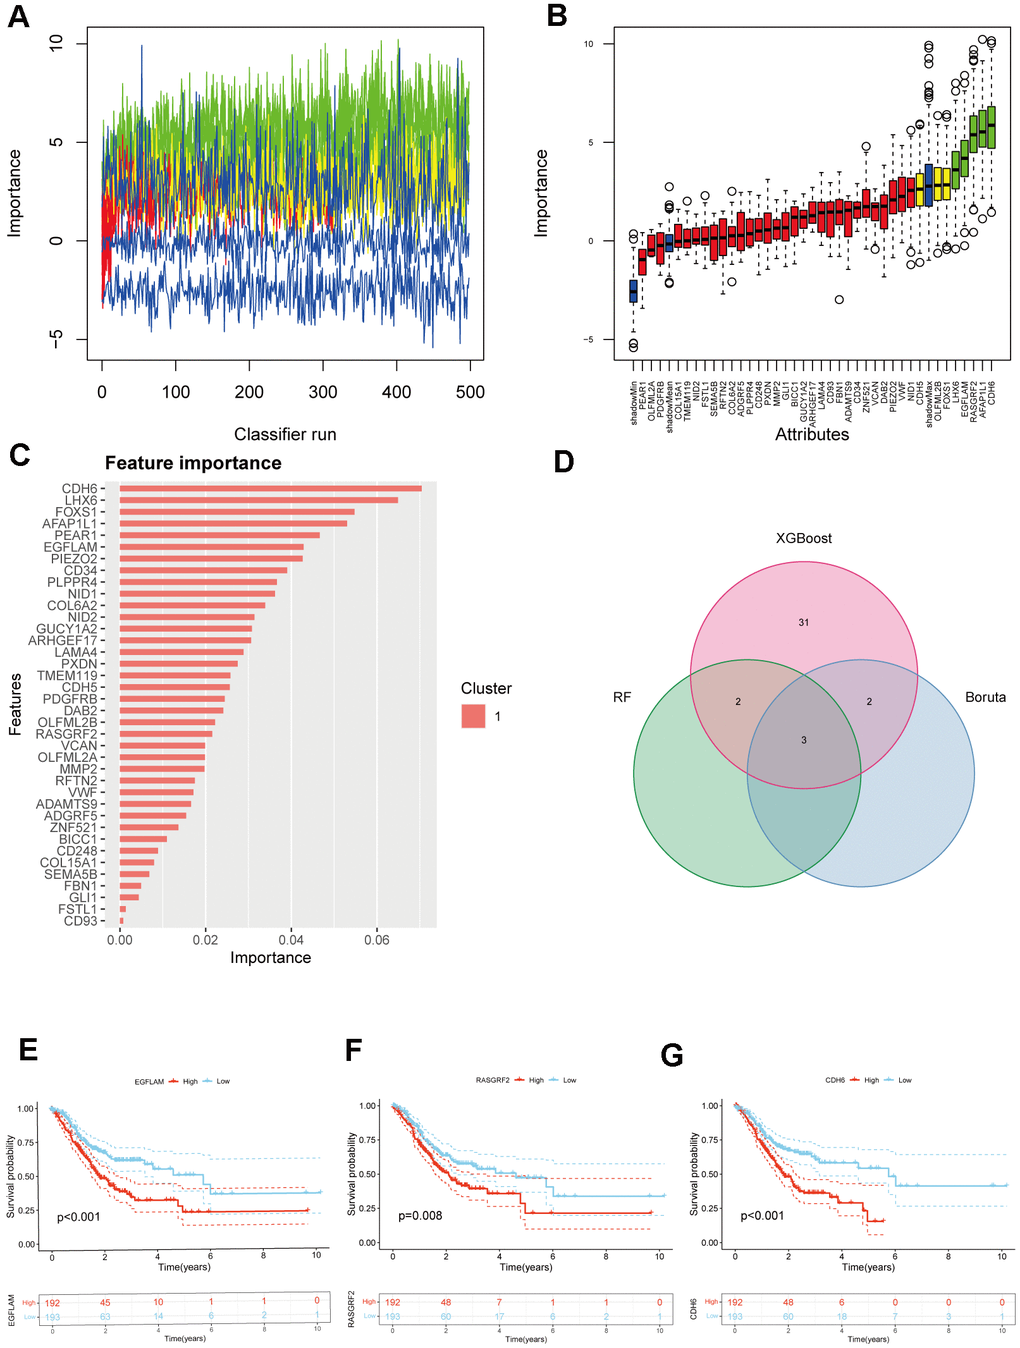
Figure 2.Selection of hub genes from prognostic genes. (A) Shadow feature plot for Boruta algorithm. (B) Confirmed plot for Boruta algorithm. (C) XGBoost analysis. (D) Venn diagram of hub genes identification using different methods. (E–G) Kaplan-Meier survival analysis of EGFLAM, RASGRF2, and CDH6 (p<0.001, p=0.008, and p<0.001, respectively).