Submit an Article
Navigate
Home
Editorial Board
Editorial Policies
Current Volume
Archive
Scientific Integrity
Publication Ethics Statements
Interviews with Outstanding Authors
Newsroom
Sponsored Conferences
Podcast
Contact
Special Collections
Submit an Article
Online ISSN: 1945-4589
Research Paper
|
Volume 16, Issue 8
|
pp. 6694–6716
The association between neighborhood deprivation and DNA methylation in an autopsy cohort
Back to article
Figure 1
(1 of 2)
−
100%
+
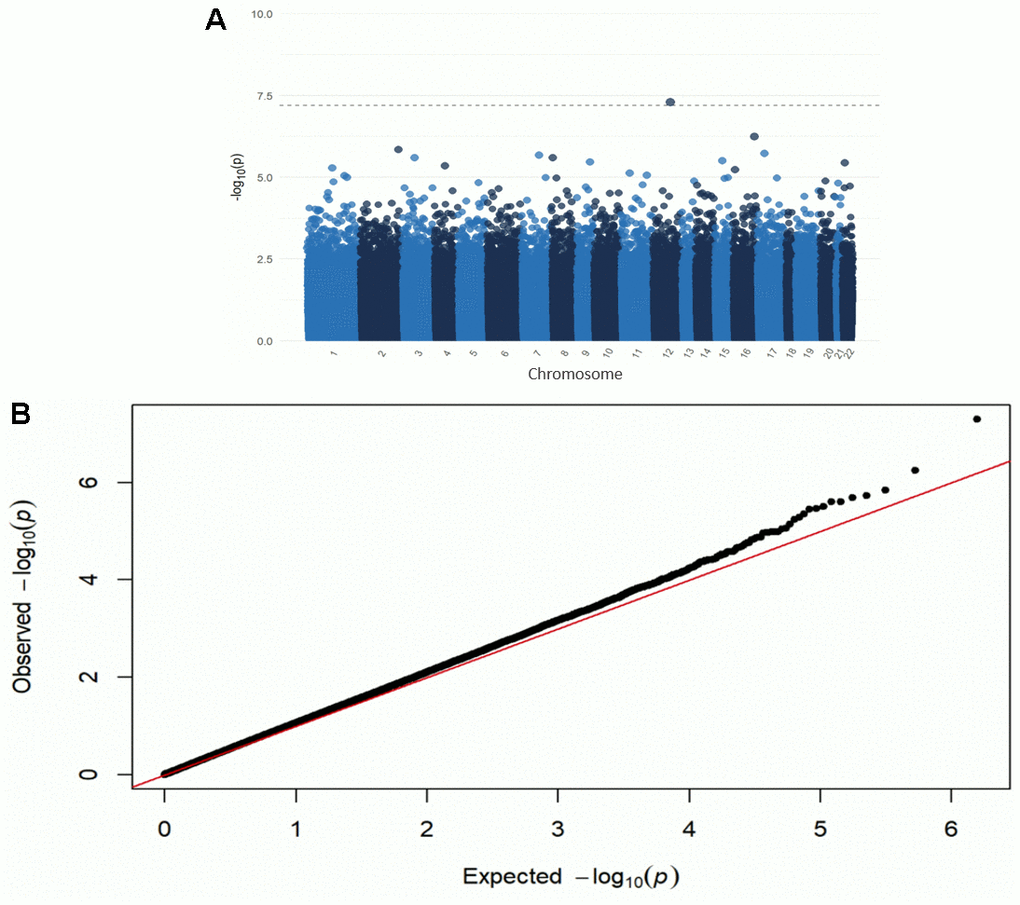
Figure 1.
Manhattan (
A
) and QQ plot (
B
) from the EWAS of DNAm with the ADI. Adjusted for race, sex, educational attainment, age at death, APOE genotype, cell type, and post-mortem interval. Bonferroni-threshold: 0.05/789889 = 6.33e
-8
(λ=0.94).