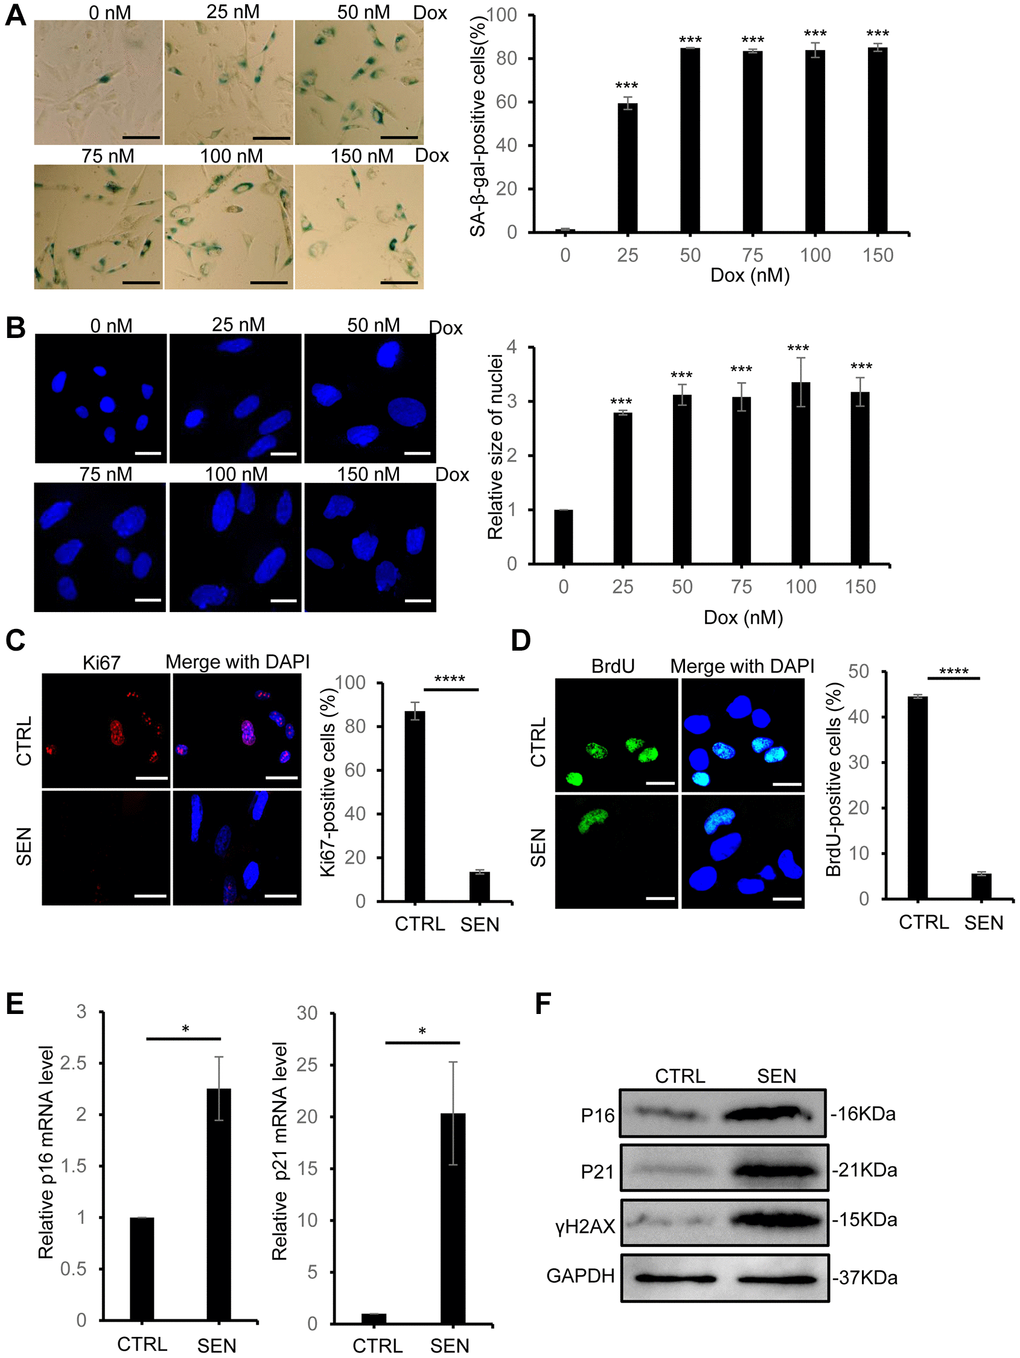
Figure 1.Doxorubicin treatment induces cellular senescence in HSkM cells. (A) The SA-β-gal activity of HSkM cells were measured with a series of concentrations of doxorubicin treatment. Scale bars: 80 μm. P-values were calculated by one-way ANOVA analysis with post hoc Tukey, ***P < 0.001. Data represented as mean ± SD. (B) Quantification of the nucleus size of HSkM with the indicated concentrations of doxorubicin treatment. Scale bars: 40 μm. P-values were calculated by one-way ANOVA analysis with post hoc Tukey, ***P < 0.001. Data represented as mean ± SD. (C) Immunofluorescence analysis of Ki67 expression in proliferating and Dox-induced senescent HSkM cells. Scale bars, 80 μm. P-values were calculated by two-tailed unpaired student’s t-test, ****P < 0.0001. Data represented as mean ± SD. (D) BrdU incorporation analysis in proliferating and senescent HSkM cells. Scale bars, 20 μm. P-values were calculated by two-tailed unpaired student’s t-test, ****P < 0.0001. Data represented as mean ± SD. (E) qPCR analysis of the transcription of p16 and p21 in proliferating and senescent HSkM cells. P-values were calculated by two-tailed unpaired student’s t-test, *P < 0.05. Data represented as mean ± SD. (F) Western blot analysis of the expression of P16, P21 and γH2AX in proliferating and senescent HSkM cells. All the experiments have been performed for at least 3 independent biological repeats.