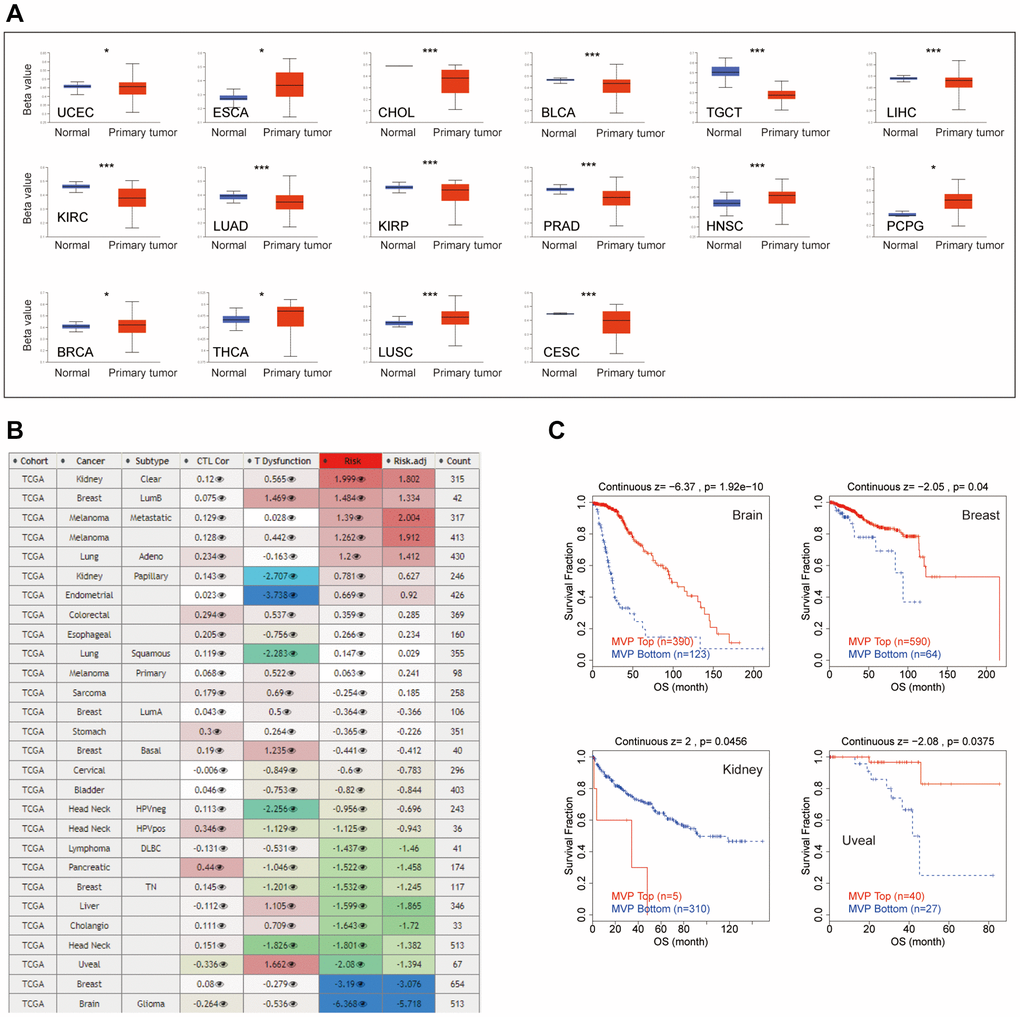
Figure 3.Epigenetic methylation analysis. (A) Boxplots illustrating differential MVP methylation levels between tumors and adjacent normal tissues in the TCGA database. (B) Heatmap demonstrating the impact of MVP methylation on cytotoxic T cell levels (CTL), dysfunctional T cell phenotype, and risk factors in the TCGA cancer cohort. (C) Kaplan-Meier curve displaying the disparity in OS between the TCGA cancer cohort with high methylation levels and the TCGA cancer cohort with low methylation levels of MVP. Only TCGA cancers with statistically significant differences between the cohorts are included.