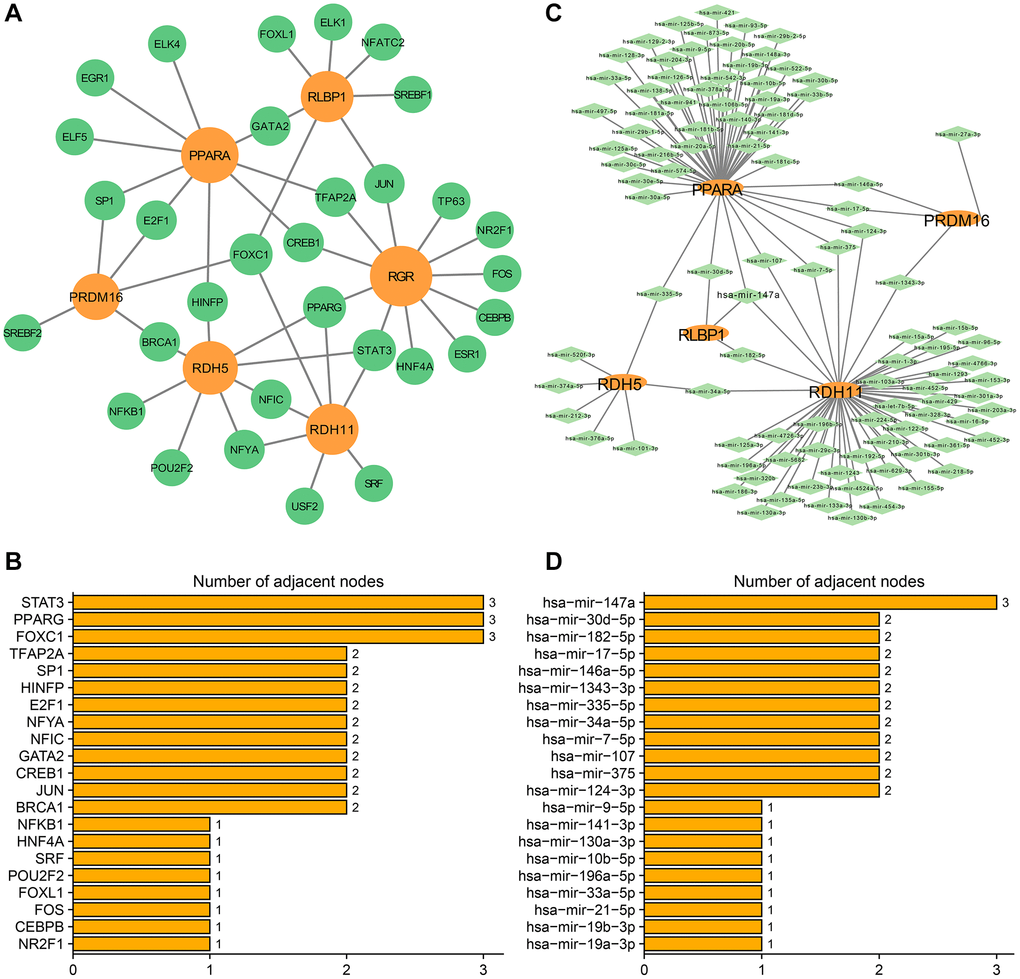
Figure 12.Transcription factors-hub genes and miRNA-hub genes regulatory networks in subtype A. (A) TF-hub genes network. The orange circles indicate hub genes and the green circles indicate TFs. (B) Ranking TFs based on degree centrality. (C) miRNA-mRNA regulatory network. The orange ellipses indicate hub genes and the green rhombuses indicate miRNAs. (D) Ranking miRNAs based on degree centrality. The number of adjacent nodes.