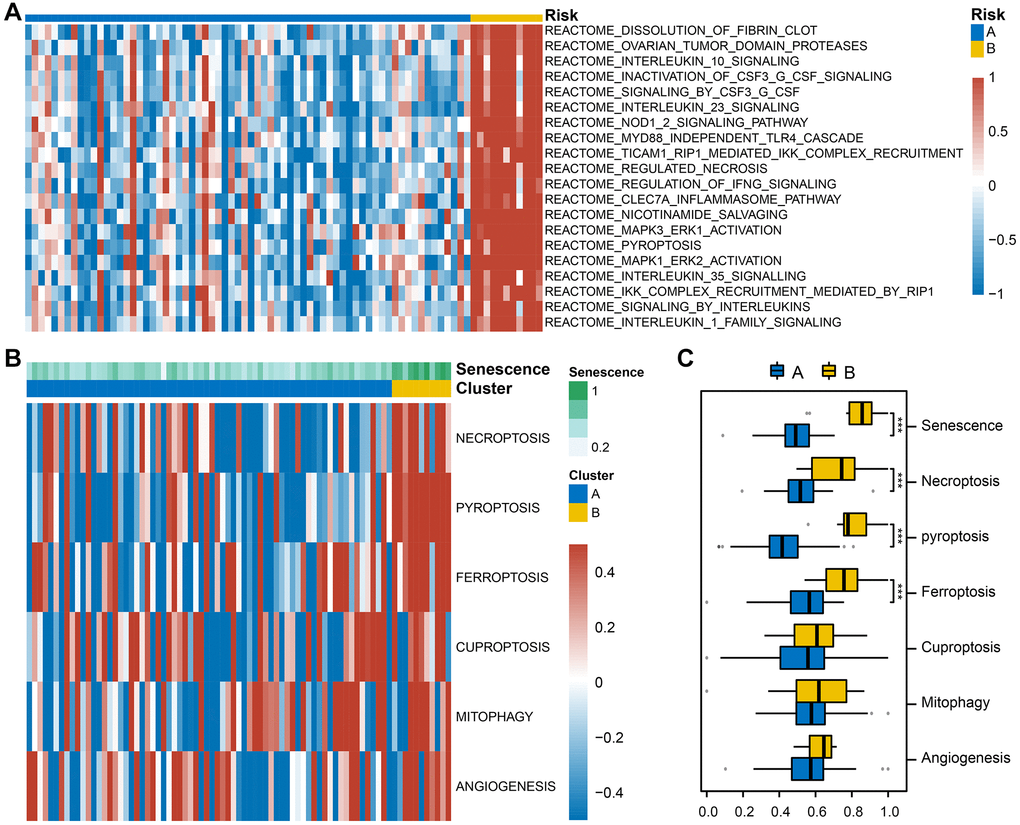
Figure 6.Gene set variation analysis (GSVA) between the two subtypes. (A) The heatmap illustrates the enrichment patterns of two subtypes. (B) Based on GSVA scores, group comparisons of senescence, PCD, and angiogenesis in the two subtypes. (C) Box plot with Wilcoxon rank sum test was performed to assess significant statistical differences between subtypes (Abbreviation: ns: not significant; *P < 0.05; **P < 0.01; ***P < 0.001). Blue indicates subtype A, and yellow indicates subtype B.