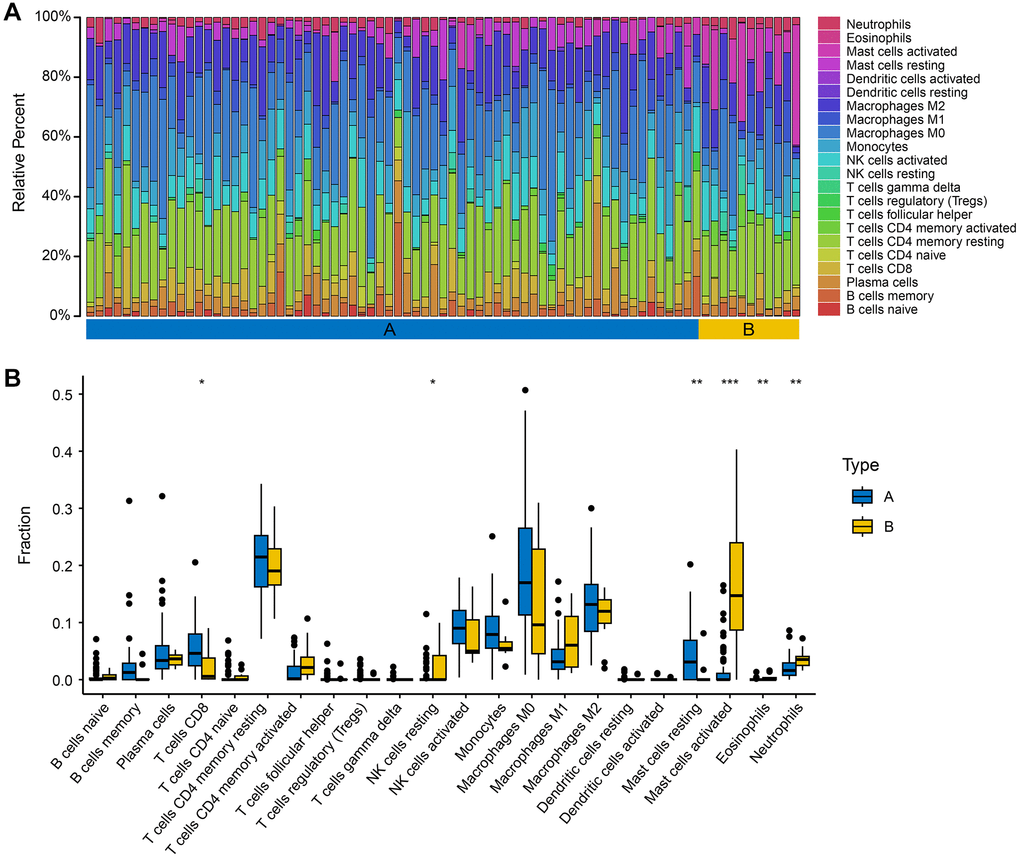
Figure 7.Immune infiltration characteristics of the two subtypes. (A) The relative percent of 22 immune cells of the two subgroups. (B) The different fractions of immune cells in two AMD subgroups. The scattered dots represent the immune cell fraction. The thick lines represent the median value. The bottom and top of the boxes are the 25 and 75 percentiles, respectively. “*” is used to represent significant statistical differences between the two subgroups (*P < 0.05; **P < 0.01; ***P < 0.001).