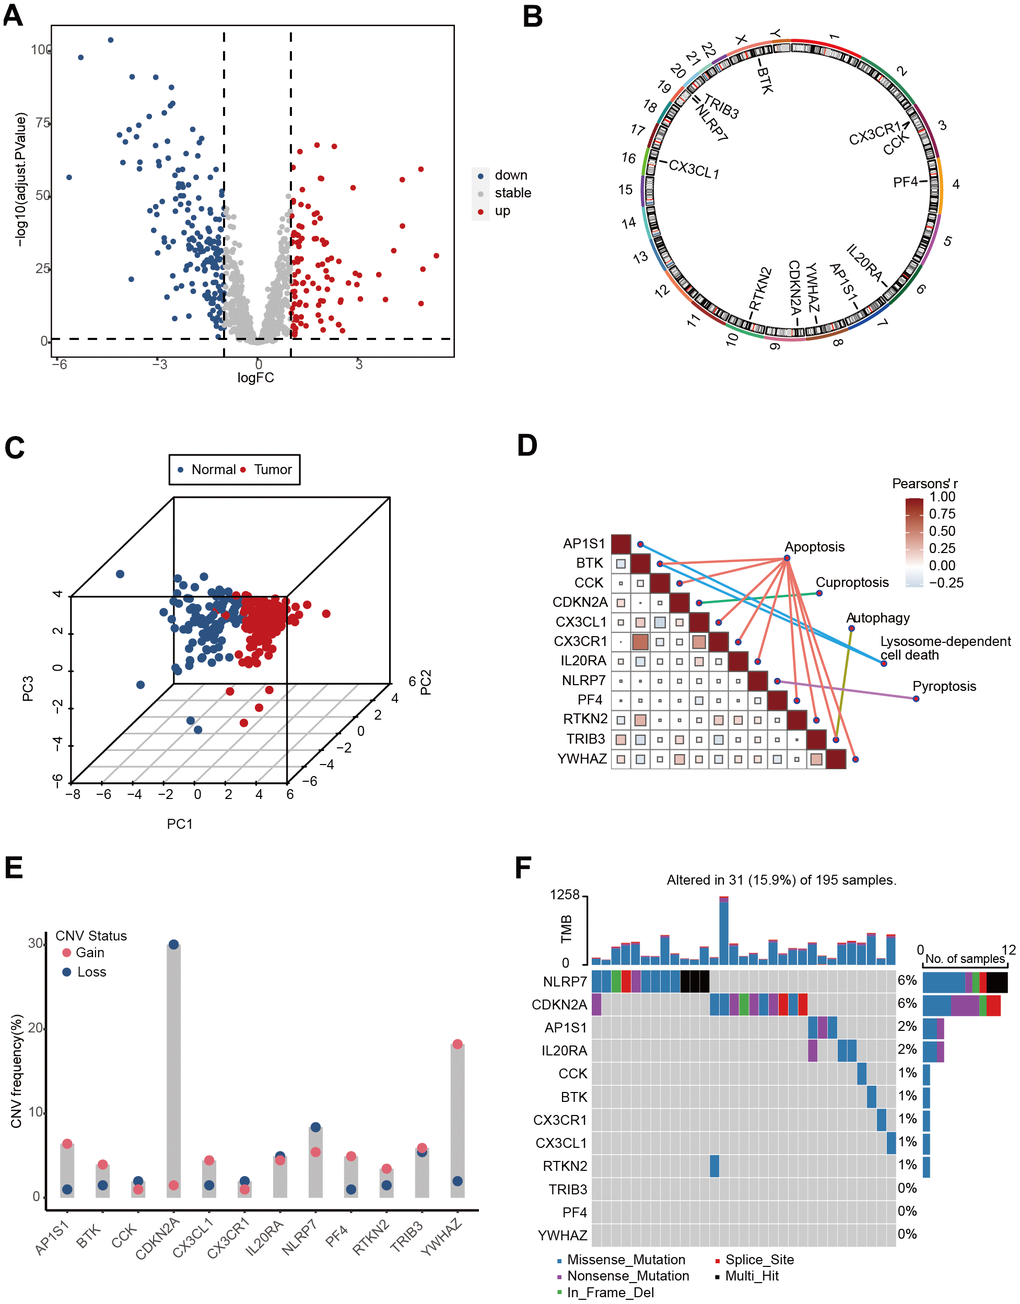
Figure 2.The landscape of genetic and transcriptional alterations of PCD genes in TCGA-Advanced NSCLC. (A) Volcano plot depicting the differential expression of PCD genes between tumor and normal samples. (B) Circos plot illustrating the chromosomal distribution of 12 prognosis related differential PCD genes. Each outer circle represents a chromosome, and the connecting lines display the genomic location of the PCD genes. (C) Principal Component Analysis (PCA) plot of 12 PCD-related genes. (D) Correlation analysis heatmap of 12 PCD-related genes in the TCGA-Advanced NSCLC dataset. The color scale represents the correlation coefficients, with red indicating positive correlation and blue indicating negative correlation. (E) Copy Number Variation (CNV) frequencies of 12 PCD-related genes. (F) Mutation frequencies of 12 PCD-associated differential genes in the TCGA-Advanced NSCLC cohort. The column height represents the frequency of mutations, and different types of mutations are distinguished by color.