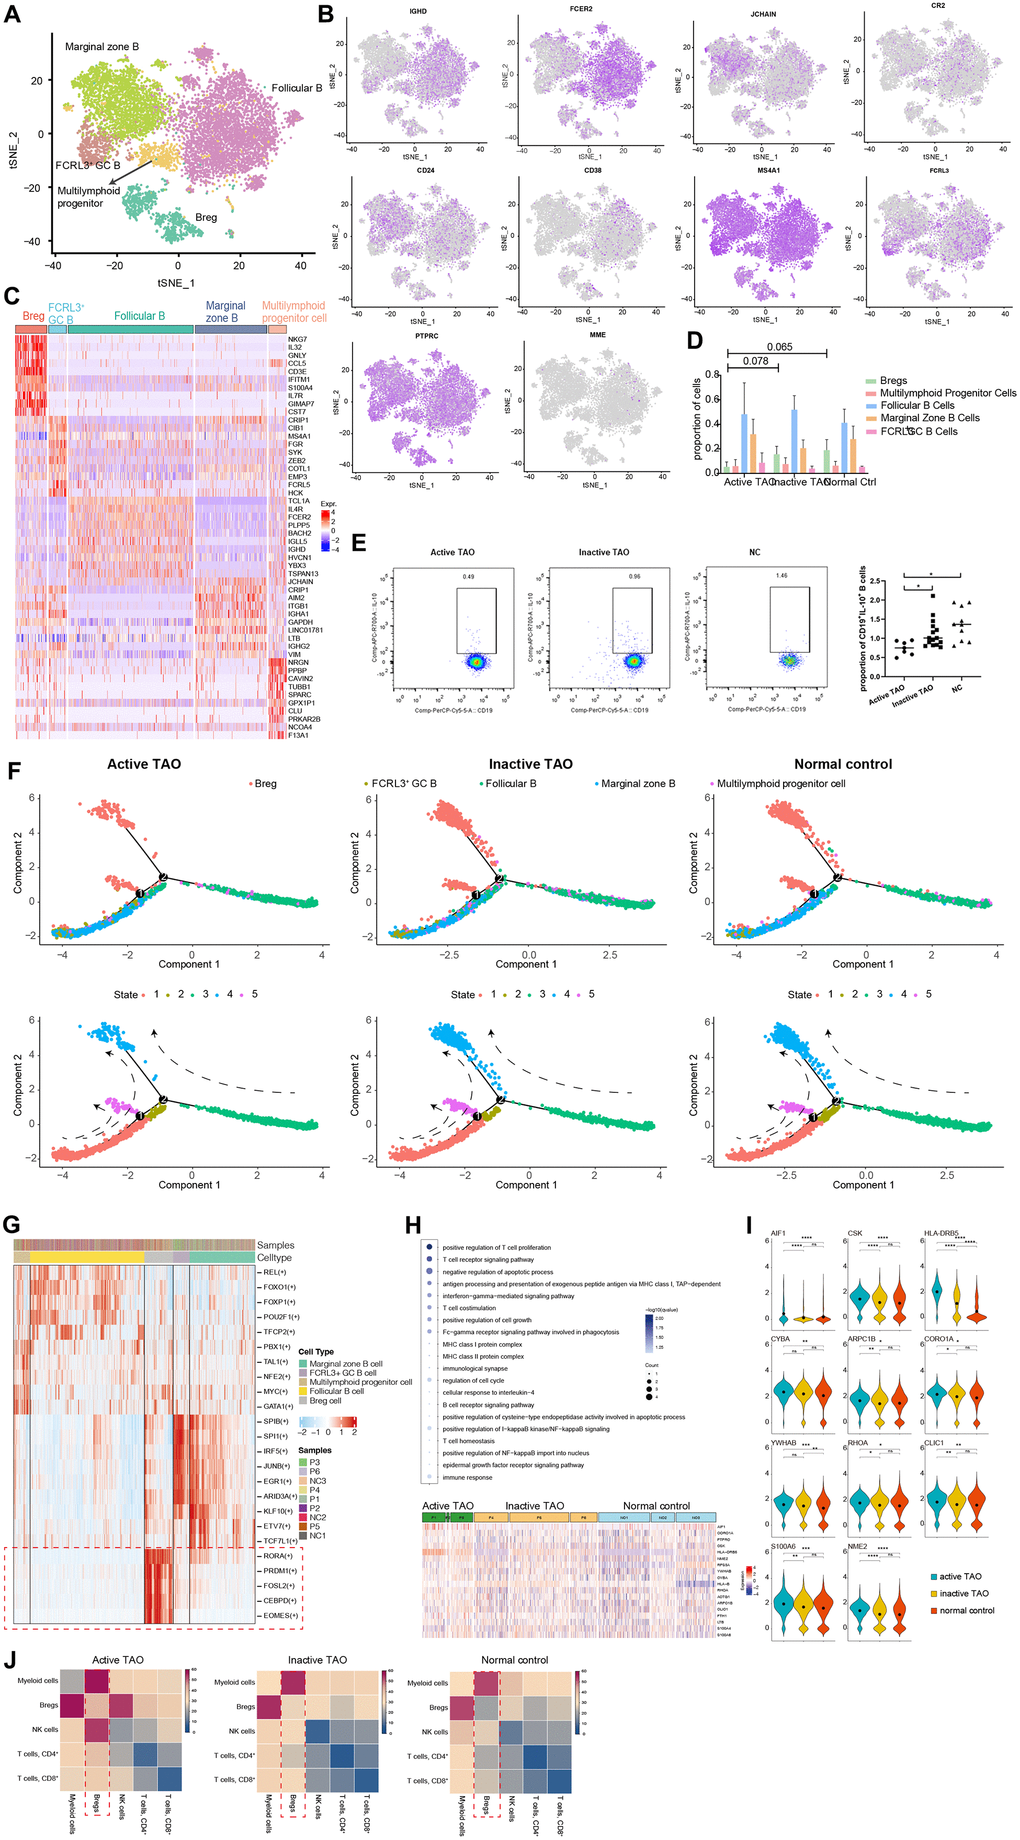
Figure 2.scRNA-seq revealed Bregs with immunoregulatory properties in TAO. (A) t-SNE plot showing the annotated B cells captured from Figure 1B. Each dot denotes an individual B cell, color denotes cluster origin. (B) The t-SNE feature plots showed expression of marker genes within individually identified B cell populations. (C) Heatmap of DEGs of each B cell subpopulation provides phenotypic information for individual B cell populations. Expression values are scaled between minimum and maximum expression for each gene across all clusters. (D) Prevalence of each B cell subpopulation within all samples from TAO patients with different activity and normal controls. (E) Representative FACS dot plots showed the proportion of Bregs from a patient with active TAO, a patient with inactive TAO, and a normal control (left). Scatter plot showing the frequency of Bregs in active TAO, inactive TAO, and NC group (right). (F) Trajectory analysis of B cell subsets in NCs and patients with TAO. Upper: distribution of the B cell subpopulations on each of the branches. Lower: the relative proportion of B cell subpopulations in each state. (G) Significantly activated motifs in the differentiation process colored by cell clusters. (H) Heatmap showing upregulated DEGs in active TAO patients’ Bregs. The upregulated GO terms enriched in the DEGs are listed with p-value and gene numbers. (I) Violin plots showing upregulated DEGs of Bregs. The diamond inside the violin plot represents the mean. (J) Heatmap showing the distribution of interaction pairs across the cell types.