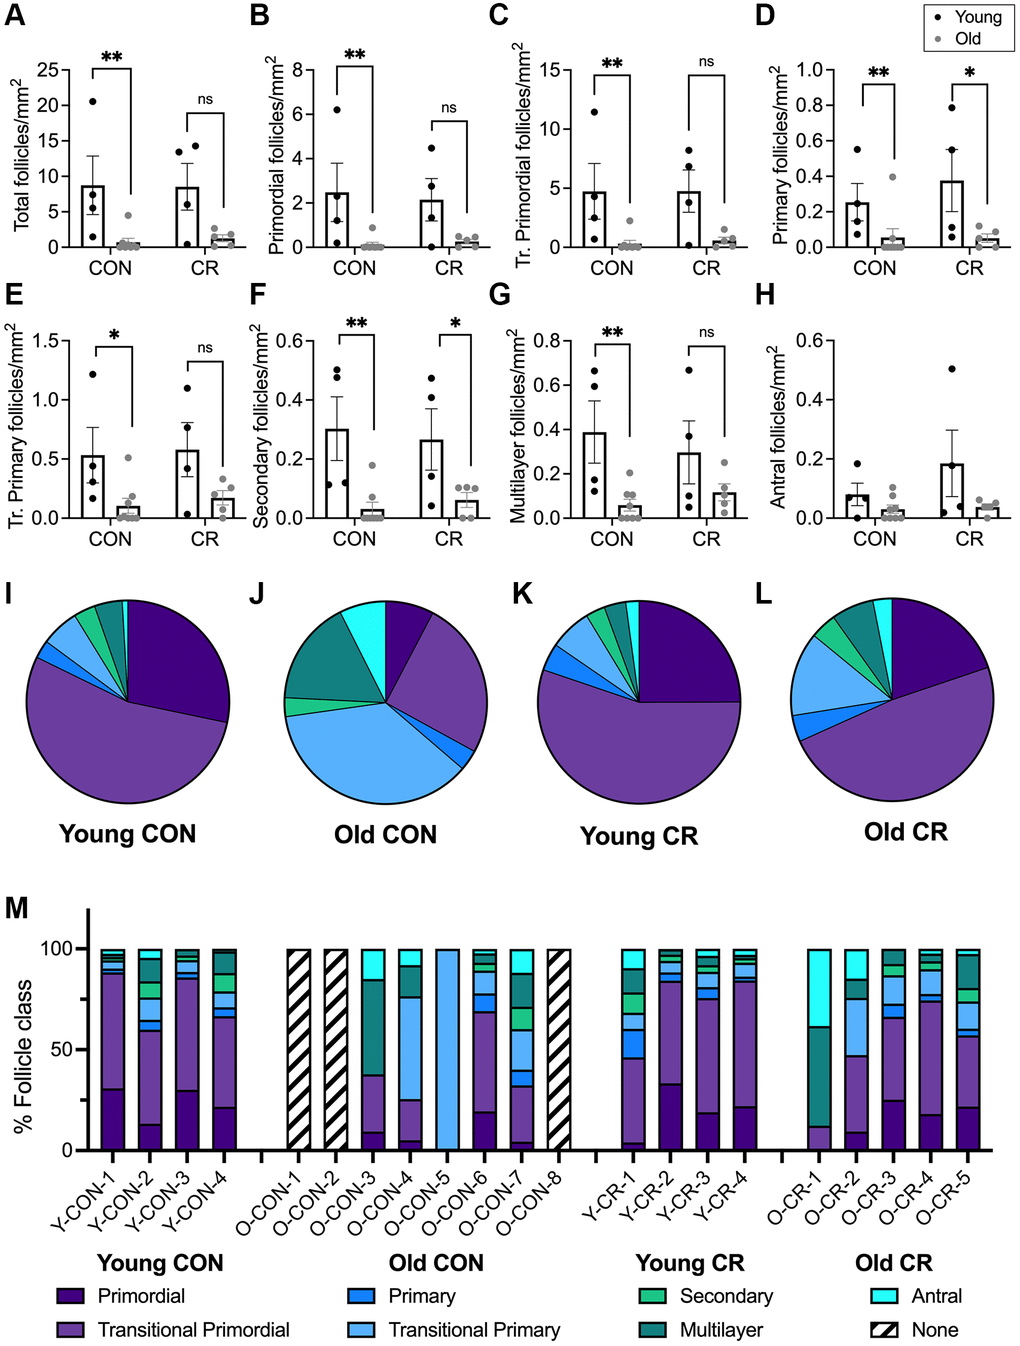
Figure 4.Follicle number per area differ between young and old animals and follicle class distribution and is affected by age and diet. Bar graphs of follicle number per ovarian section area for each normal follicle morphology class are shown for: (A) total number of follicles, (B) primordial, (C) transitional primordial, (D) primary, (E) transitional primary, (F) secondary, (G) multilayer, and (H) antral follicles. Pie charts show follicle class distribution for (I) young control, (J) old control, (K) young calorie-restricted, and (L) old calorie-restricted animals. Pie charts were generated by summing raw follicle number from each follicle class for all animals in an experimental group ((I) N = 4 animals, n = 3315 follicles, (J) N = 5 animals, n = 467 follicles, (K) N = 4 animals, n = 3448 follicles, and (L) N = 5 animals, n = 336 follicles) and plotted as pie charts to show follicle distribution across developmental classes. Data are shown as follicle number from each class summed for all animals in the given group (young control, young calorie-restricted, old control, old calorie-restricted). (M) follicle class distribution (shown as a percent) for individual animals. Animal identification codes are listed below the X-axis in panel M and can be cross-referenced to additional animal characteristics in Supplementary Table 2. Follicle number per area is plotted as untransformed data. Data are presented as mean ± SEM. Black circles indicate young animals, grey circles indicate old animals. Statistics were calculated on log-transformed data with a two-way ANOVA. Tukey’s post hoc test was applied when one or both of the main effects were statistically significant. *p ≤ 0.05, **p ≤ 0.01. P-values for sources of variation of two-way ANOVA can be found in Supplementary Table 1.
Figure 4 — Short-term moderate caloric restriction in the rhesus macaque attenuates markers of ovarian aging in select populations | Aging