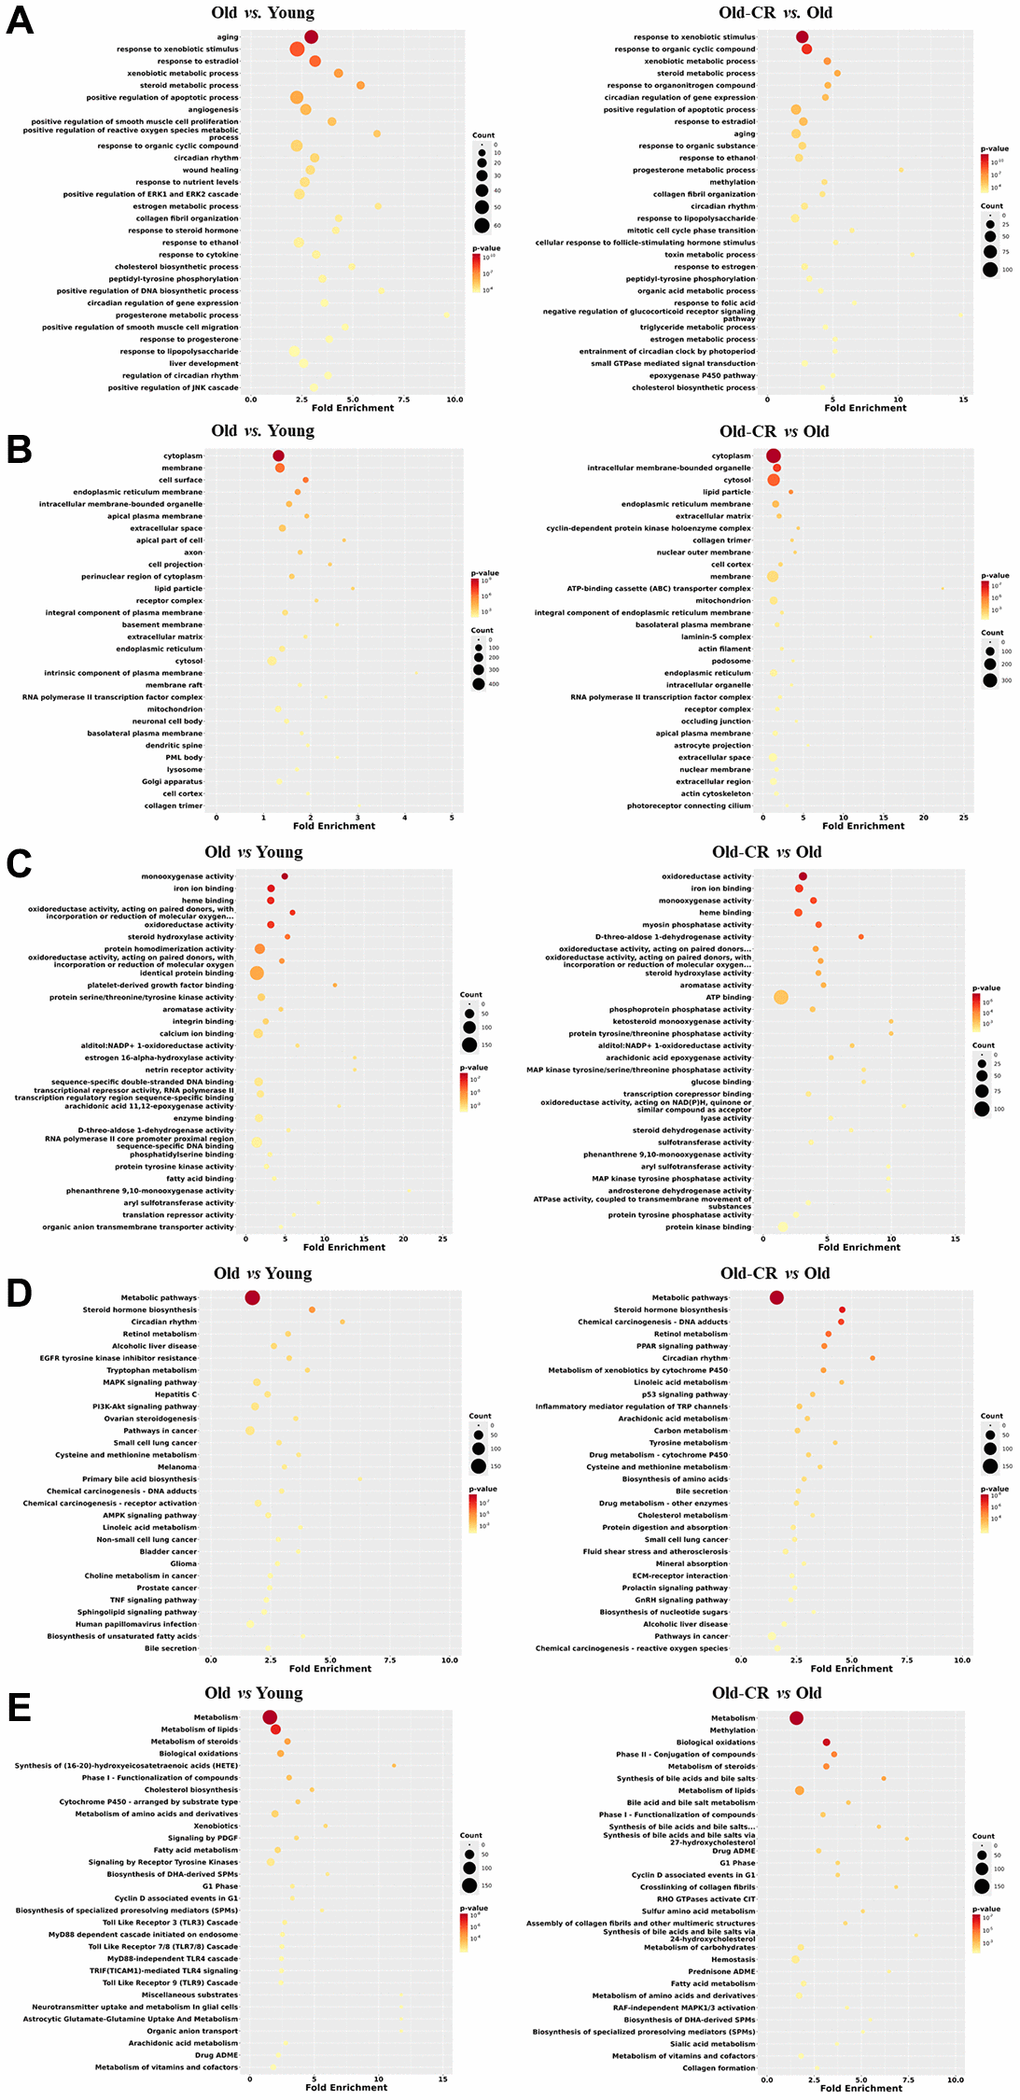
Figure 3.Top 30 enriched GO or pathway terms of the DEGs in the Old vs. Young and Old-CR vs. Old datasets from SD rats. (A) BP, (B) CC, (C) MF, (D) KEGG, and (E) Reactome data. Gene ontology analysis revealed significant alterations in metabolic processes, circadian rhythm, and inflammation (BP); lipid particles, collagen, and mitochondria (CC); and energy/lipid metabolism enzymes (MF). Pathway analysis identified changes in AMPK/PPAR signaling and circadian rhythm (KEGG), with distinct inflammatory signatures in aging and extracellular matrix responses in CR (Reactome). The criterion for a significant term was p < 0.05. Counts indicate the number of genes related to each term in the analysis. The fold enrichment indicates how much a particular GO term or pathway is overrepresented in the list of genes compared to that expected by chance. Old-CR, old group under CR.