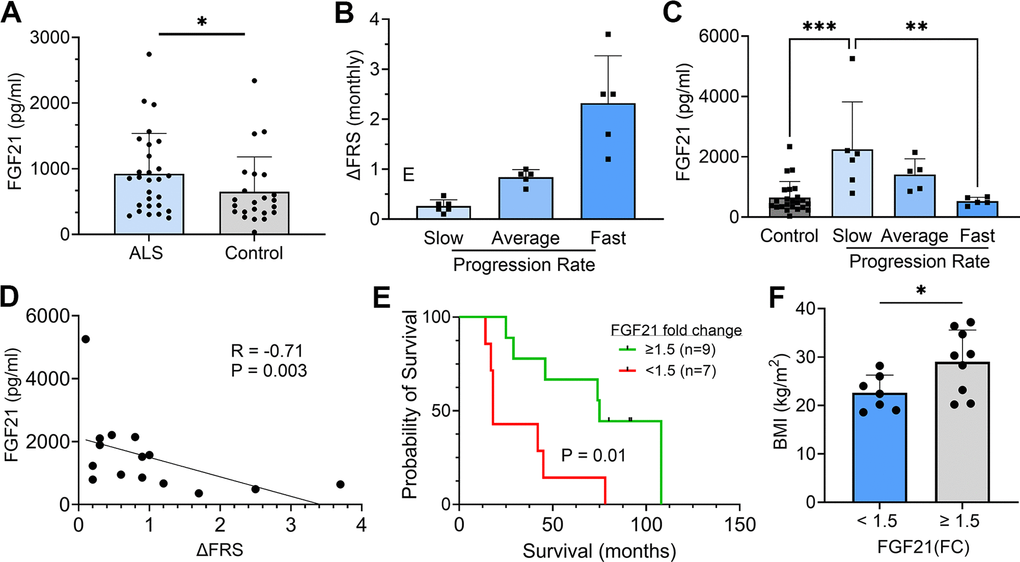
Figure 3.Plasma FGF21 is increased in ALS patients and high levels associated with slower disease progression and prolonged survival. (A) Plasma samples from age-matched normal controls (n = 23) and ALS patients (n = 28) and assayed by ELISA for FGF21. *P = 0.043, unpaired two-tailed t-test. (B) 16 ALS patients from a prior biomarker study were divided into slow (n = 6), average (n = 5), and fast (n = 5) progressing groups based on the average in the study monthly decline in ALSFRS-R scores. (C) Plasma FGF21 levels were measured at baseline and 3 months and averaged. The normal control values were added for comparison. **P = 0.003, ***P = 0.0003; one-way ANOVA followed by Tukey post hoc test. (D) Correlation between plasma FGF21 levels with monthly change in the ALSFRS-R scores (∆FRS) for each subject. Spearman correlation test. (E) Kaplan–Meier survival curves for study patients whose FGF21 plasma levels were < 1.5-fold-change (FC) over the normal control group versus study patients with ≥ 1.5-FC in FGF21 levels. *P = 0.015; Log-rank (Mantel-Cox) test. (F) Comparison of body mass index (BMI) between the < 1.5 FC and ≥ 1.5-FC groups. *P = 0.037; unpaired two-tailed t-test. For all graphs, error bars represent SD.