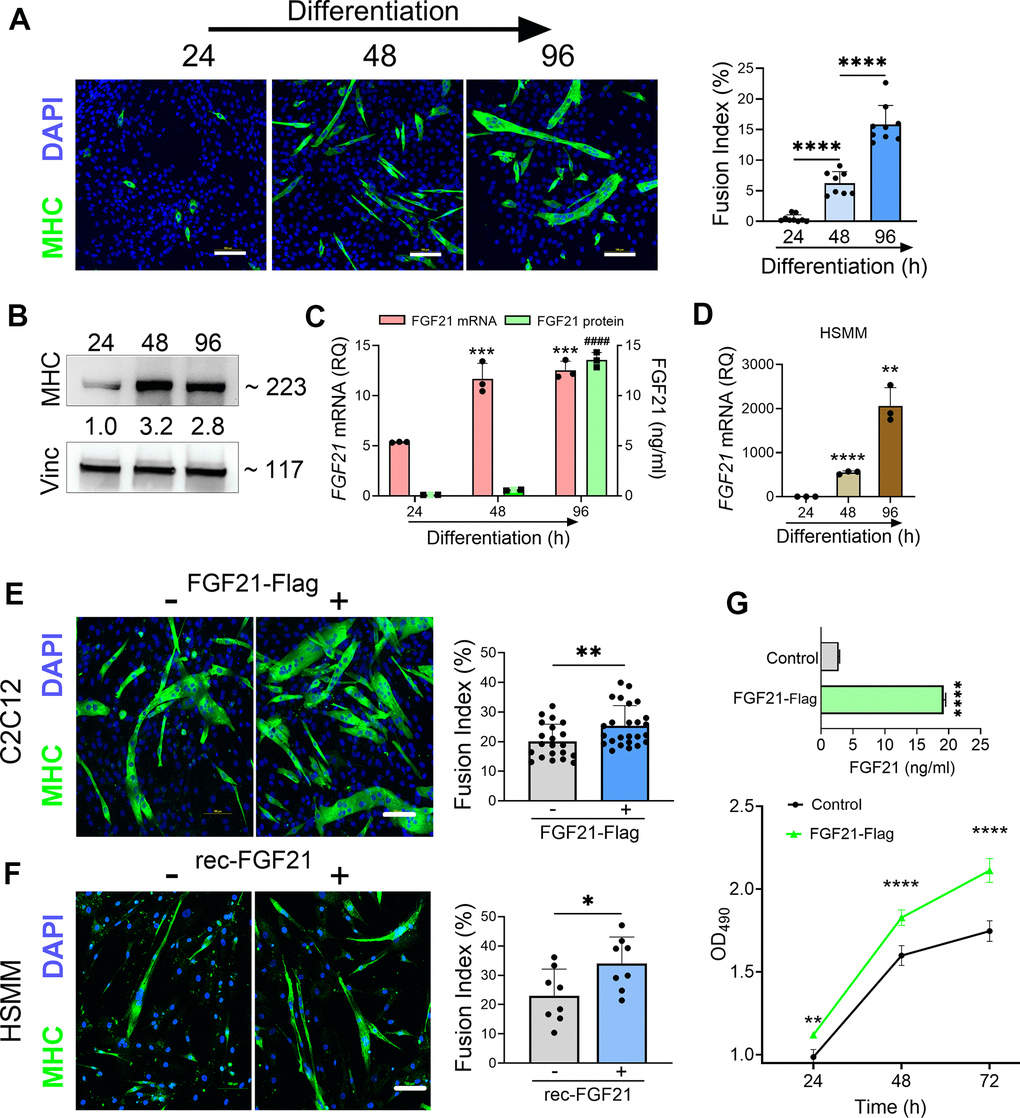
Figure 8.FGF21 is upregulated during myogenesis and facilitates myogenic differentiation of C2C12 and human primary muscle cells (HSMM). (A) C2C12 myoblasts were treated with DM for various time intervals and immunostained with an anti-MHC antibody followed by DAPI counterstaining. Myotube formation was detected by MHC-positive staining. Scale bars, 100 μm. The fusion index (%) was quantified as described in the methods (right panel). (B) C2C12 myoblasts treated with DM were lysed at specific time intervals and immunoblotted with antibodies against MHC and vinculin. Densitometry values (24 h time interval was set at 1) are shown. (C) FGF21 mRNA levels were quantified from the lysates and FGF21 protein from conditioned media. ***P = 0.0005 comparing to the 24 h time interval, ####P < 0.0001 comparing to the 24 and 48 h time intervals; one-way ANOVA followed by Tukey’s multiple comparisons test. (D) HSMM cells were treated with DM for various time intervals and FGF21 mRNA levels were quantified from the lysates as described in (C). **P < 0.01, ****P < 0.0001; unpaired two-tailed t-test. (E) C2C12 myoblasts were transfected with an FGF21-FLAG plasmid and cultured in DM for 96 h. Myotube formation was assessed by MHC-positive staining as in (A). Scale bar, 100 μm (left panel). Fusion index for transfected C2C12 cells. **P = 0.008; unpaired two-tailed t-test (right panel). (F) HSMM cells were treated with recombinant FGF21 (100ng/ml) and cultured in DM for 96 h. Myotube formation was assessed by MHC-positive staining as in (A, E). Scale bar, 100 μm (left panel). Fusion index for transfected HSMM cells. *P = 0.02; unpaired two-tailed t-test (right panel). (G) FGF21 levels in the conditioned media from C2C12 myoblasts transfected with FGF21-FLAG or empty vector control were quantified by ELISA (upper graph). ****P < 0.0001; unpaired two-tailed t test. Cells were reseeded and cultured in growth medium (GM) for 72 h. Cell proliferation was assessed at indicated time intervals using MTS (lower graph). **P = 0.007, ****P < 0.0001; one-way ANOVA followed by Tukey’s multiple comparisons test. Data points represent biological replicates and bars are the mean ± SD.