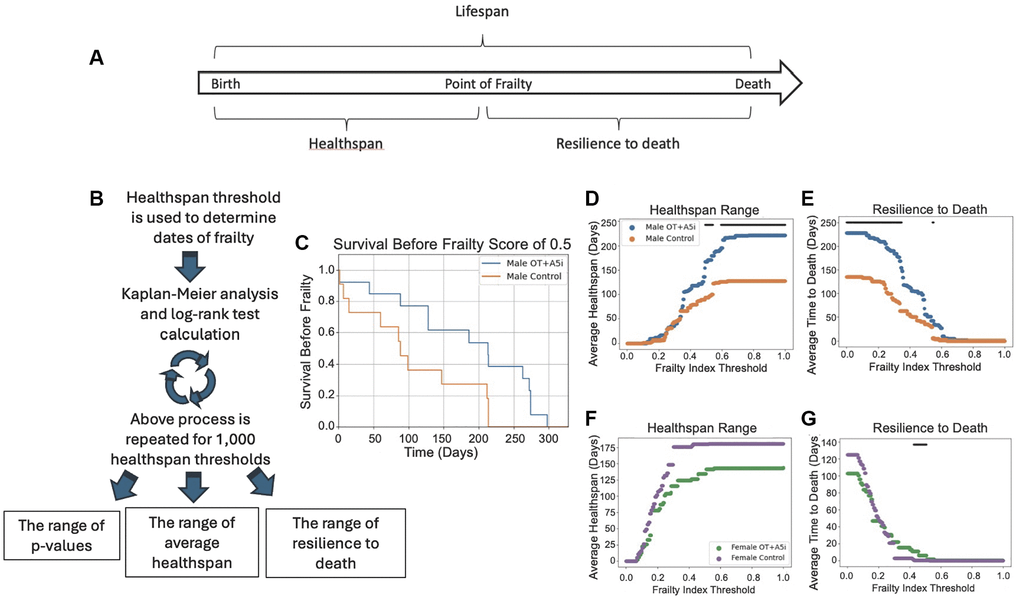
Figure 2.A5i+OT extends the healthspan of old frail male mice. (A) Overview of lifespan vs. healthspan and related terms. (B) Outline of the novel statistical model created to analyze healthspan. Healthspan thresholds are used to determine the dates of incurred frailty and log-rank test analysis is performed. This is repeated 1,000 times for a range of healthspans and the average healthspans are plotted as well as the resilience to death. (C) Representative Kaplan-Meier plot demonstrating the healthspan of mice before they reach a frailty of 0.5 (p = 0.0230). (D) The average healthspans of OT+A5i and control mice across the range of frailty thresholds from 0 to 1. The black bar represents thresholds at which there is a statistically significant difference as calculated by log-rank analysis. The maximum significant frailty index value threshold = 1.0 and the minimum threshold = 0.4925. (E) The average time to death after the frailty threshold is reached, which we denote as “resilience to death.” Male mice: control n = 12 and OT+A5i n = 14. The maximum significant frailty index value threshold = 0.5495 and the minimum significant frailty index value = 0.0. (F) The average healthspans of OT+A5i and control female mice across the range of frailty thresholds from 0 to 1. The black bar (or lack thereof) represents thresholds at which there is a statistically significant difference as calculated by log-rank analysis. There were no thresholds at which a statistically significant difference was observed. (G) The average time to death after the frailty threshold was reached for female mice: “resilience to death”. Female mice: control n = 13 and OT+A5i n = 10. The maximum significant frailty index value threshold = 0.5075 and the minimum significant frailty index value = 0.4254.