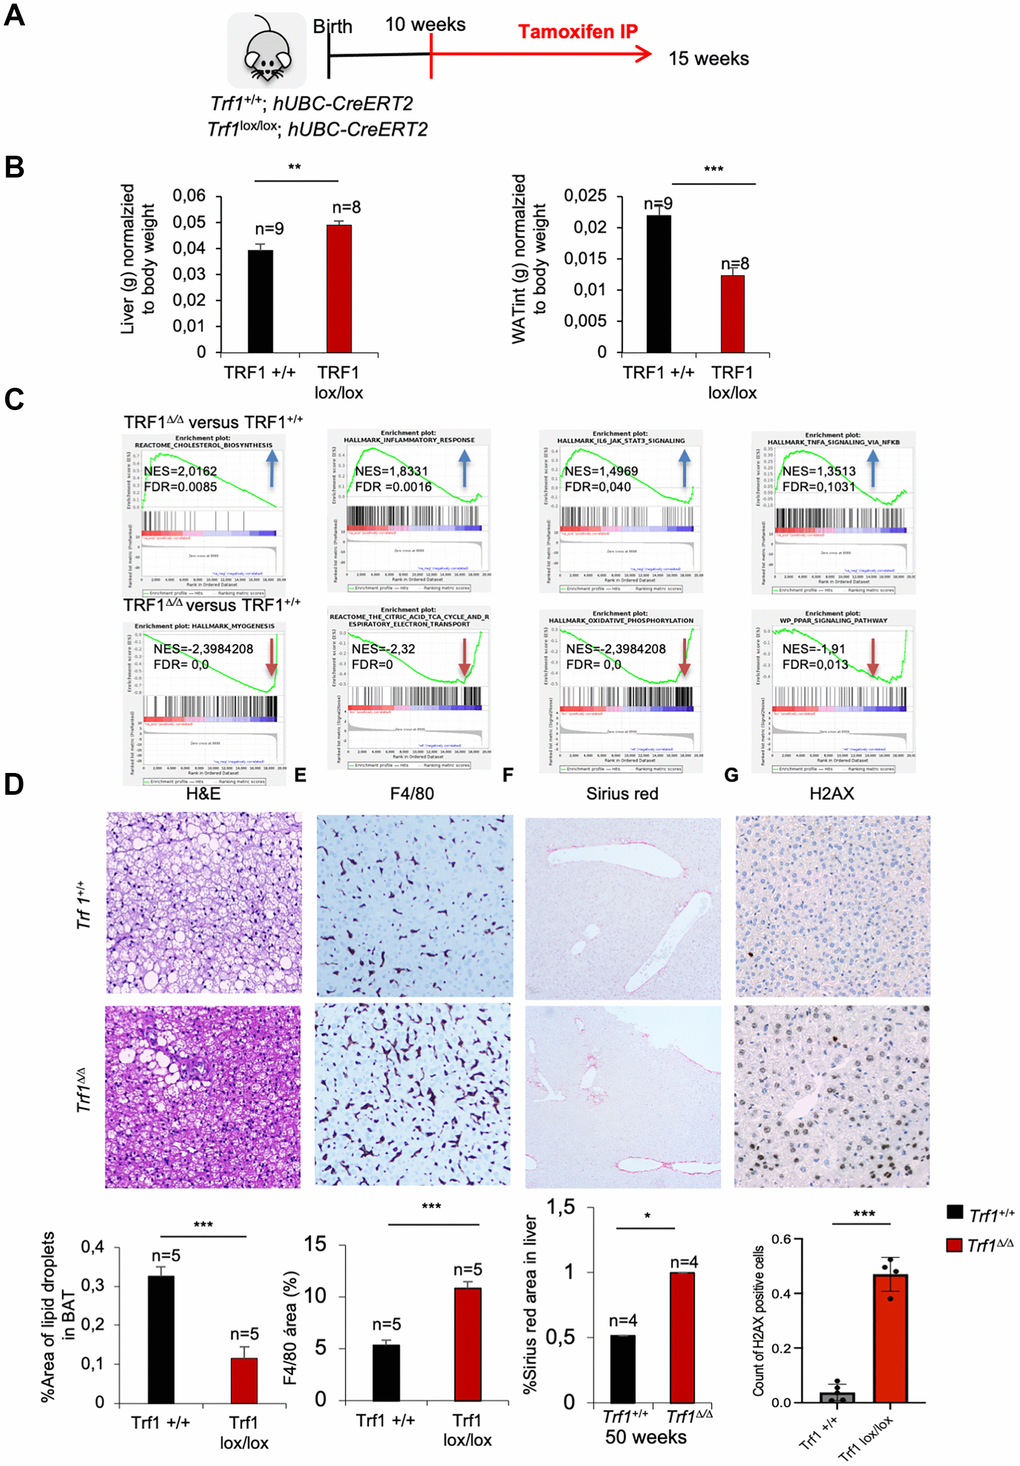
Figure 5.Deletion of Trf1 induces differences in tissue weight in early stages, before body weight differences. (A) Experimental plan: Trf1+/+ and Trf1lox/lox; hUBC-CreERT2 female mice were treated with tamoxifen at 10 weeks of age. Mice were euthanized 5 weeks after tamoxifen treatment. (B) Weight of liver and white adipose tissue (grams) normalized to body weight. Note that Trf1 Δ/Δ liver weighted more compared to the wild-types, while the opposite was observed for white adipose tissue. (C) Gene expression data obtained by RNA-seq of liver samples of 15 weeks Trf1+/+ and Trf1Δ/Δ was analyzed by GSEA to determine significantly enriched gene sets. GSEA plots for the indicated pathways in liver samples for Trf1Δ/Δ versus Trf1+/+ mice. The red to blue horizontal bar represents the ranked list. Genes located at the central area of the bar show small differences in gene expression between the pairwise comparisons. Genes with higher expression levels are located at the red edge while the genes with lower expression levels are located at the blue edge of the bar. Blue and red arrows indicated downregulation and upregulation, respectively, of the pathway in the pairwise comparisons. (D) Representative image and quantification of area of lipid droplets in brown adipose tissue. Trf1Δ/Δ had lower lipid droplets in brown adipose tissue. (E) Representative images and quantification of liver stained with F4/80 immunohistochemistry staining. Note that Trf1Δ/Δ presents higher macrophage infiltration. (F) Sirius red staining in the liver of 50-week- old females represented in images and quantification of the area of Sirius red staining. Note that 50 weeks of age Trf1Δ/Δ females have a higher area of Sirius red staining. (G) H2AX staining in the liver of RNAseq cohort of female mice. Note that Trf Δ/Δ female mice have more DNA damage than wild-types. Error bars, s.e.m.; only significant values are shown; *P < 0.05; **P < 0.01; ***P < 0.001 determined by two-tailed Student’s t-test (B, D)