


Introduction
Recently, we identified a loss of stromal caveolin-1 (Cav-1) as a novel biomarker for the cancer-associated fibroblast phenotype in human breast cancers [1]. More specifically, when fibroblasts were isolated from human breast cancers, 8 out of 11 patients showed >2-fold reduction in Cav-1 protein expression, relative normal matched fibroblasts prepared from the same patients [1]. Furthermore, detailed phenotypic analysis of mammary fibroblasts derived from Cav-1 (-/-) null mice revealed that they share numerous properties with cancer-associated fibroblasts, such as constitutively active TGFbeta signaling, and that they have the ability to promote normal mammary epithelial cells to undergo an EMT (epithelial-mesenchymal transition) [2].
To determine if loss of stromal Cav-1 has prognostic value, we performed a series of independent biomarker studies [3,4]. Using a cohort of 160 breast cancer patients, with nearly 20 years of follow-up data, we showed that a loss of stromal Cav-1 (in the fibroblast compartment) is a powerful single independent predictor early tumor recurrence, lymph node metastasis, tamoxifen-resistance, and poor clinical outcome [4]. As the prognostic value of a loss of stromal Cav-1 was independent of epithelial marker status, it appears that a loss of Cav-1 has predictive value in all the different epithelial subtypes of human breast cancer, including ER+, PR+, HER2+, and triple-negative patients [4]. The high predictive value of a loss of stromal Cav-1 was also independently validated by another independent laboratory, using a second independent breast cancer patient cohort [5].
A loss of stromal Cav-1 also appears to play a role in tumor initiation and progression [6]. Using a DCIS patient cohort, in which patients were treated with wide-excision, but without any chemo- or radio-therapy, we also evaluated the prognostic value of stromal Cav-1 [6]. In this DCIS patient cohort, a loss of stromal Cav-1 was specifically associated with DCIS recurrence and invasive progression. 100% of the patients with a loss of stromal Cav-1 underwent recurrence, and 80% of these patients progressed to invasive disease, namely frank invasive ductal carcinoma [6]. Similar results were also independently obtained in human prostate cancers, where a loss of stromal Cav-1 was specifically associated with advanced prostate cancer, tumor progression, and metastatic disease [7].
To begin to understand the mechanism(s) underlying the lethality of a loss of Cav-1 in cancer-associated fibroblasts, we turned to Cav-1 (-/-) deficient mice as a model system.
For this purpose, we isolated bone marrow derived stromal cells from WT and Cav-1 (-/-) deficient mice, as cancer-associated fibroblasts are thought to evolve from mesenchymal stem cells [8]. These cells were then subjected to unbiased proteomic and genome-wide transcriptional analysis. Interestingly, proteomic analysis revealed the upregulation of i) 8 myofibroblast markers (including vimentin, calponin, and tropomyosin), ii) 8 glycolytic enzymes (including PKM2 and LDHA), and iii) 2 markers of oxidative stress (peroxiredoxin1 and catalase) [8]. The glycolytic phenotype of Cav-1 (-/-) null stromal cells was also supported by transcriptional analysis, as most of the proteins that were found to be upregulated by proteomics, were also transcriptionally upregulated [8]. Based on these findings, we proposed a new model to understand the role of the Warburg effect ("aerobic glycolysis") in tumor metabolism. We hypothesized that glycolytic cancer-associated fibroblasts promote tumor growth by the secretion of energy-rich metabolites (such as pyruvate and lactate) that could then be taken up by adjacent epithelial cancer cells, where they would be incorporated into the tumor cell's TCA cycle, leading to enhanced ATP production [8]. This would provide a feed-forward mechanism by which glycolytic fibroblasts could promote tumor growth, progression, and metastasis. Because the Warburg effect was previously thought to be largely confined to tumor cells, and not to the cancer-associated fibroblast compartment, we have termed this new idea "The Reverse Warburg Effect" [8].
In order to determine which transcriptional programs are activated in Cav-1 (-/-) stromal cells, we performed an extensive bioinformatics analysis of our genome-wide profiling data [9]. This informatics analysis revealed that a loss of Cav-1 (-/-) in stromal cells drives ROS production and oxidative stress [9]. This, in turn, results in the activation of key transcription factor, such as HIF and NF-kB, which can then drive aerobic glycolysis and inflammation in the tumor micro-environment [9]. This could provide a molecular basis for understanding the lethality of a loss of stromal Cav-1 in human breast cancer patients.
Here, we have used a bioinformatics approach to determine whether similar "Warburg-like" transcrip-tional profiles exist in the tumor stroma isolated from human breast cancers. For this purpose, we analyzed an existing data set in which the tumor stroma was isolated away from adjacent breast cancer cells using laser-capture micro-dissection [10]. We now provide new evidence for the existence of the "Reverse Warburg Effect" in human tumor stroma from breast cancer patients. More specifically, the tumor stroma of human breast cancers shows a transcriptional shift towards oxidative stress, DNA damage/repair, inflammation, hypoxia, and aerobic glycolysis, supporting with the "Reverse Warburg Effect". Consistent with the idea that oxidative stress in the tumor stroma is a driving factor in promoting tumor progression and metastasis, we also show that the tumor stroma of human breast cancers overlaps significantly with the transcriptional profiles associated with Alzheimer's brain disease.
Finally, the "Reverse Warburg Effect" is strikingly similar to the theory of "Neuon-Glia Metabolic Coupling" [11-18], which was proposed more than 10 years ago to explain metabolic changes associated with normal synaptic transmission, which may be exacerbated during neuronal stress and neuronal degeneration, as in Alzheimer's disease. In "Neuron-Glia Metabolic Coupling", astrocytes undergo aerobic glycolysis, secrete energy-rich metabolites (pyruvate and lactate), and neurons then take up these metabolites and use them in the neuronal TCA cycle to generate high amounts of ATP. Thus, we propose that "The Reverse Warburg Effect" we observe could also be more broadly termed "Epithelial-Stromal Metabolic Coupling".
As such, tumors may be initiating a survival mechanism that is normally used by the brain during stress. Interestingly, myofibroblasts and mesenchymal stem cells are known to often express GFAP (glial fibrillary acidic protein) [19-21], an intermediate filament protein that is thought to be relatively specific for astrocytes in the central nervous system. Here, we see that GFAP is upregulated in the "tumor stroma" and in the stroma of "metastasis-prone" breast cancer patients. Thus, possible similarities between astrocytes and myo-fibroblasts/cancer-associated fibroblasts should be further explored.
Results
Transcriptional comparison of Cav-1 (-/-) stromal cells with human breast cancer stroma
Previously, we subjected Cav-1 (-/-) bone marrow derived stromal cells, and their wild-type counter-parts to genome-wide transcriptional profiling [8]. Because such a large number of gene transcript levels are changed, we focused on the gene transcripts that are upregulated. We speculated that these Cav-1 (-/-) stromal gene profiles might also overlap with the transcriptional stromal profiles obtained from human breast cancers.
To test this hypothesis directly, we obtained the transcriptional profiles of a large data set of human breast cancer patients [10] whose tumors were subjected to laser-capture micro-dissection, to selectively isolate the tumor stroma. Based on this data set [10], we then generated three human breast cancer stromal genes lists:
1) Tumor Stroma vs. Normal Stroma List - Compares the transcriptional profiles of tumor stroma obtained 53 patients to normal stroma obtained from 38 patients. Genes transcripts that were consistently upregulated in tumor stroma were selected and assigned a p-value, with a cut-off of p <0.05 (contains 6,777 genes) (Supplementary Table 1).
2) Recurrence Stroma List - Compares the transcript-tional profiles of tumor stroma obtained from 11 patients with tumor recurrence to the tumor stroma of 42 patients without tumor recurrence. Genes transcripts that were consistently upregulated in the tumor stroma of patients with recurrence were selected and assigned a p-value, with a cut-off of p <0.05 (contains 3,354 genes) (Supplementary Table 2).
3)Lymph-node (LN) Metastasis Stroma List - Compares the transcriptional profiles of tumor stroma obtained from 25 patients with LN metastasis to the tumor stroma of 25 patients without LN metastasis. Genes transcripts that were consistently upregulated in the tumor stroma of patients with LN metastasis were selected and assigned a p-value, with a cut-off of p <0.05 (contains 1,182 genes) ( Supplementary Table 3).
These three gene lists were then individually intersected with the transcriptional profile of Cav-1 (-/-) null stromal cells [8]. The results of these intersections are presented in Figure 1, as Venn diagrams. Most important- ly, significant overlap was seen with all three gene lists. Greater than 2,000 genes were common between the Cav-1 (-/-) stromal gene list and the gene transcripts upregulated in breast cancer tumor stroma (p = 1.6 x 10⁻³). Also, more than 1,000 gene transcripts were common between the Cav-1 (-/-) stromal gene list and the gene transcripts upregulated in the breast cancer tumor stroma of patients with tumor recurrence (p = 1 x 10⁻³). Finally, nearly 500 genes were commonly upregulated between Cav-1 (-/-) stromal cells and the breast cancer tumor stroma of patients with LN metastasis (p = 4.6 x 10⁻⁶). Thus, the transcriptional profiles of Cav-1 (-/-) stromal cells are most ignificantly related to the tumor stroma of patients with LN-metastasis. Independently, our previous data demonstrated that a loss of stromal Cav-1 protein expression (by immuno-histochemistry) in human breast cancers is specifically associated with a 2.6-fold increase in the number of tumor cell positive lymph nodes (LN-metastasis) [3,4].
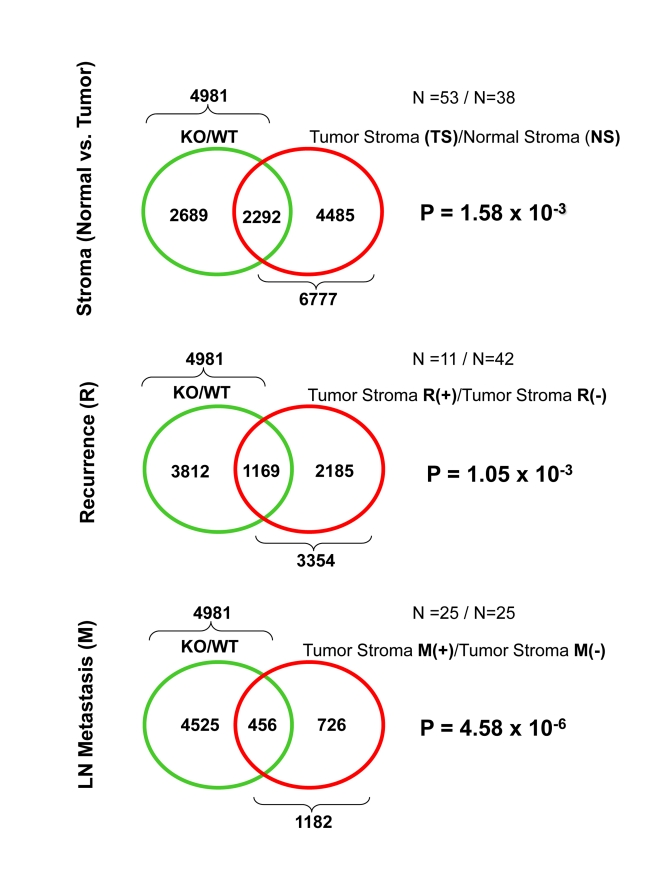
Figure 1. Venn diagrams for the transcriptional overlap between Cav-1 (-/-) stromal cells and tumor stroma from breast cancer patients.
The top 100 most significant gene transcripts for all three human breast cancer stromal gene lists, including their transcriptional intersection with Cav-1 (-/-) stromal cells, is included in Supplementary Tables 3, 4, and 5.
As Cav-1 (-/-) stromal cells are a genetic model of activated myofibroblasts [2] which biosynthetically secrete more collagen, and fibrosis is a critical risk factor for poor clinical outcome in human breast cancer patients [3], we also looked at the potential overlap been the expression of collagen gene transcripts (See Table 1). Thirty-five collagen gene transcripts were specifically upregulated in tumor stroma; 16 were upregulated in "recurrence-prone" stroma; and only 1 was upregulated in "metastasis-prone" stroma. In all three cases, there was striking overlap with the collagen gene transcripts upregulated in Cav-1 (-/-) stromal cells, as indicated in bold (24 out of 35 transcripts; 12 out of 16 transcripts; and 1 out of 1 transcript; See Table 1).
Cav-1 (-/-) stromal cells have also been previously subjected to extensive analysis via an unbiased proteomics approach [8,24]. We next intersected these proteomic results with the three human breast cancer stromal gene lists. The results of this intersection are shown in Table 2. Note that many of the proteins that are upregulated in Cav-1 (-/-) stromal cells are also transcriptionally upregulated in the stroma of human breast cancer patients. Most notably, there was a strong association between the metabolic enzymes that were upregulated in Cav-1 (-/-) stromal cells and the "recurrence-prone" and "metastasis-prone" stromal gene lists.
Validating the "Reverse Warburg Hypothesis" in human breast cancer stroma
Recently, based on the unbiased proteomic and transcriptional analysis of Cav-1 (-/-) stromal cells, we have proposed that tumor stromal fibroblasts may undergo aerobic glycolysis [8]. We have termed this new idea the "Reverse Warburg Effect" [8].
Transcriptional analysis of Cav-1 (-/-) stromal cells [9] indicated that the "Reverse Warburg Effect" is associated with transcriptional over-expression of glycolysis-associated genes, HIF-target genes [25], NF-kB target genes [26], genes associated with the response to oxidative stress (GO_0006979), as well as the concomitant compensatory transcriptional upregulation of mitochondrial associated genes (GO_0005739) [9].
Table 1. Collagen gene expression in the human breast cancer stromal gene lists.
Genes intersecting with the Cav-1 (-/-) bone marrow derived stromal gene list are shown in bold.
| Tumor Stroma Associated (24 of 35 collagen genes) | P-value | |
| Col11a1 | collagen, type XI, alpha 1 | 1.51E-73 |
| Col8a1 | collagen, type VIII, alpha 1 | 1.11E-51 |
| Col10a1 | collagen, type X, alpha 1 | 2.37E-42 |
| Col12a1 | collagen, type XII, alpha 1 | 6.40E-34 |
| Col5a2 | collagen, type V, alpha 2 | 7.78E-33 |
| Col5a1 | collagen, type V, alpha 1 | 2.54E-31 |
| Col1a2 | collagen, type I, alpha 2 | 1.07E-27 |
| Col3a1 | collagen, type III, alpha 1 | 3.32E-27 |
| Col4a5 | collagen, type IV, alpha 5 | 6.04E-23 |
| Col8a2 | collagen, type VIII, alpha 2 | 1.78E-22 |
| Col6a3 | collagen, type VI, alpha 3 | 3.87E-19 |
| Col6a1 | collagen, type VI, alpha 1 | 8.97E-19 |
| Col9a1 | collagen, type IX, alpha 1 | 3.05E-18 |
| Col17a1 | collagen, type XVII, alpha 1 | 4.11E-18 |
| Col4a6 | collagen, type IV, alpha 6 | 2.50E-17 |
| Col1a1 | collagen, type I, alpha 1 | 3.20E-17 |
| Col25a1 | collagen, type XXV, alpha 1 | 7.13E-17 |
| Col5a3 | collagen, type V, alpha 3 | 1.17E-16 |
| Col20a1 | collagen, type XX, alpha 1 | 2.35E-16 |
| Col16a1 | collagen, type XVI, alpha 1 | 3.77E-16 |
| Col13a1 | collagen, type XIII, alpha 1 | 4.27E-14 |
| Col24a1 | collagen, type XXIV, alpha 1 | 4.07E-13 |
| Col15a1 | collagen, type XV, alpha 1 | 2.00E-12 |
| Col4a4 | collagen, type IV, alpha 4 | 5.55E-12 |
| Col4a2 | collagen, type IV, alpha 2 | 1.17E-11 |
| Col18a1 | collagen, type XVIII, alpha 1 | 5.00E-11 |
| Col9a2 | collagen, type IX, alpha 2 | 5.30E-11 |
| Col14a1 | collagen, type XIV, alpha 1 | 4.92E-10 |
| Col23a1 | collagen, type XXIII, alpha 1 | 7.52E-08 |
| Col11a2 | collagen, type XI, alpha 2 | 3.90E-07 |
| Col2a1 | collagen, type II, alpha 1 | 6.22E-07 |
| Col27a1 | collagen, type XXVII, alpha 1 | 4.93E-06 |
| Col4a3 | collagen, type IV, alpha 3 | 1.21E-05 |
| Col19a1 | collagen, type XIX, alpha 1 | 1.90E-05 |
| Col4a1 | collagen, type IV, alpha 1 | 4.37E-02 |
| Recurrence-Prone Stroma (12 of 16 collagen genes) | ||
| Col13a1 | collagen, type XIII, alpha 1 | 4.16E-05 |
| Col20a1 | collagen, type XX, alpha 1 | 4.34E-05 |
| Col3a1 | collagen, type III, alpha 1 | 8.00E-05 |
| Col11a1 | collagen, type XI, alpha 1 | 2.84E-04 |
| Col1a1 | collagen, type I, alpha 1 | 2.46E-03 |
| Col11a2 | collagen, type XI, alpha 2 | 4.63E-03 |
| Col8a2 | collagen, type VIII, alpha 2 | 8.91E-03 |
| Col23a1 | collagen, type XXIII, alpha 1 | 1.05E-02 |
| Col4a2 | collagen, type IV, alpha 2 | 1.51E-02 |
| Col9a1 | collagen, type IX, alpha 1 | 1.58E-02 |
| Col4a5 | collagen, type IV, alpha 5 | 1.85E-02 |
| Col14a1 | collagen, type XIV, alpha 1 | 1.94E-02 |
| Col2a1 | collagen, type II, alpha 1 | 2.06E-02 |
| Col10a1 | collagen, type X, alpha 1 | 2.08E-02 |
| Col9a2 | collagen, type IX, alpha 2 | 2.97E-02 |
| Col19a1 | collagen, type XIX, alpha 1 | 3.90E-02 |
| Metastasis-Prone Stroma (1 of 1 collagen genes) | ||
| Col6a1 | collagen, type VI, alpha 1 | 4.00E-02 |
Table 2. Intersection of Cav-1 (-/-) stromal proteomics with the human breast cancer stromal gene lists.
Includes proteins upregulated in Cav-1 (-/-) bone marrow derived stromal cells (ref # 8), Cav-1 (-/-) mouse embryo fibroblasts (ref # 24), and Cav-1 (-/-) mammary fat pad. P values listed are from the Human Breast Cancer Stromal Gene Lists. Genes in bold are associated with metabolism.
| Gene | Description | Tumor Stroma | Recurrence-Prone | Metastasis-Prone |
| Capg | capping protein (actin filament), gelsolin-like | 4.18e-38 | 4.07e-03 | |
| Sparc | secreted acidic cysteine rich glycoprotein | 1.49e-35 | ||
| Arhgdib | Rho, GDP dissociation inhibitor (GDI) beta | 3.92e-32 | ||
| Gpd2 | glycerol phosphate dehydrogenase 2, mitochondrial | 1.39e-29 | ||
| Upp1 | uridine phosphorylase 1 | 2.77e-28 | ||
| Col3a1 | collagen, type III, alpha 1 | 3.30e-27 | 8.00e-05 | |
| Col1a2 | collagen, type I, alpha 2 | 1.07e-27 | ||
| Tpm1 | tropomyosin 1, alpha | 2.20e-26 | 5.23e-07 | |
| Sh3bgrl3 | SH3 domain binding glutamic acid-rich protein-like 3 | 4.35e-24 | ||
| Col1a1 | collagen, type I, alpha 1 | 3.20e-17 | 2.46e-03 | |
| Eef1d | eukaryotic translation elongation factor 1 delta (guanine nucleotide exchange protein) | 2.00e-12 | ||
| Nme2 | non-metastatic cells 2, protein (NM23B) expressed in | 2.39e-09 | ||
| Sncg | synuclein, gamma (breast cancer-specific protein 1) | 8.86e-08 | ||
| Ldhc | lactate dehydrogenase C | 1.26e-07 | 1.78e-03 | |
| Myl1 | myosin, light chain 1, alkali; skeletal, fast | 3.60e-07 | ||
| Gsn | gelsolin | 6.30e-05 | ||
| Ckm | creatine kinase, muscle | 3.88e-05 | ||
| Tpm2 | tropomyosin 2, beta | 1.38e-03 | 2.22e-03 | |
| Cnn2 | calponin 2 | 2.26e-02 | ||
| Fth1 | ferritin, heavy polypeptide 1 | 2.72e-02 | ||
| Pdha1 | pyruvate dehydrogenase E1 alpha subunit | 2.85e-02 | ||
| Pgk1 | phosphoglycerate kinase 1 | 3.21e-02 | ||
| Eno3 | enolase 3, beta muscle | 1.29e-03 | ||
| Aldoa | aldolase A, fructose-bisphosphate | 1.69e-03 | ||
| Afp | alpha fetoprotein | 3.06e-02 | ||
| Pkm2 | pyruvate kinase, muscle | 3.73e-02 | ||
| Alb | albumin | 3.95e-02 | ||
| Pgd | phosphogluconate dehydrogenase | 4.19e-02 | ||
| Serpinb2 | serine (or cysteine) peptidase inhibitor, clade B, member 2 | 4.27e-02 | ||
| Eef2 | eukaryotic translation elongation factor 2 | 4.41e-02 |
Table 3. Intersection of human breast cancer stromal gene sets with gene sets related to the "Reverse Warburg Effect".
| Glycolysis | HIF Targets | Mitochondrial Genes | NF-kB Targets | Ox Stress | Alzheimer's | |
| Stromal Gene Set | ||||||
| Tumor Stroma | 19 | 213 | 233 | 199 | 51 | 676 |
| Recurrence-Prone | 10 | 108 | 120 | 86 | 22 | 338 |
| Metastasis-Prone | 7 | 42 | 68 | 32 | 9 | 145 |
Table 3 shows that all of these gene sets are well-represented in tumor stroma, "recurrence-prone" stroma, and the "metastasis-prone" stroma of human breast cancer patients (See also SupplmentalTables 7, 8, and 9 for detailed gene lists).
It is important to note that these breast cancer stromal gene lists also include Cxcl12, a known HIF-target gene [25], that is transcriptionally-upregulated ~5-fold in Cav-1 (-/-) stromal cells [8].
The "Reverse Warburg Effect" and similarities with Alzheimer's disease
We have previously shown that the transcriptional profiles of Cav-1 (-/-) stromal cells significantly ovelap with the transcriptional profiles obtained from the analysis of Alzheimers disease brain [9]. We believe this is functionally due to the activation of similar biological processes in both "The Reverse Warburg Effect" and Alzheimer's disease [9], including oxidative stress, NO over-production (peroxynitrite formation), inflammation, hypoxia, and mitochondrial dysfunction [27].
Thus, here, we independently evaluated the association between Alzheimer's disease and human breast cancer tumor stroma. These transcriptional overlaps are enumerated in Table 3, and are illustrated schematically as Venn diagrams in Figure 2. Detailed gene lists are provided in Supplemental Tables 7, 8, and 9.
Interestingly, as predicted, the genes that are transcriptionally upregulated in Alzheimer's disease significantly overlap with tumor stroma, "recurrence-prone" stroma, and "metastasis-prone" stroma. This clearly functionally links Alzheimer's disease with the human breast cancer tumor stroma.
As with the gene profiles of Cav-1 (-/-) stromal cells, the Alzheimer's disease profiles were most significantly associated with the "metastasis-prone" stromal gene set (p = 9 x 10⁻⁵).
Detailed analysis of the "Metastasis-Prone" stromal gene set
Next, we examined the possible overlap of the "metastasis-prone" stromal gene set with other existing transcriptional profiles, using gene-set enrichment analysis.
Our results are shown in Table 4. Briefly, we see that the "metastasis-prone" stromal gene set is associated with a number of interesting biological processes, including cell cycle progression and survival, DNA damage/repair, scleroderma, "stemness", aging and oxidative stress, Alzheimer's disease, decreased DNA-methylation, tamoxifen-resistance, metastasis, Myc-associated target genes, inflammation (NF-kB/STAT), TGFbeta signaling and myofibroblast differentiation, hypoxia and HIF signaling, mitochondrial function, and liver-specific gene transcription.
Table 4. Comparative results for wild type N2 vs. nth-1;xpa-1.
| Data Set | Description | P-value |
| Cell Cycle Progression and Survival | ||
| MORF_ANP32B | Neighborhood of ANP32B acidic (leucine-rich) nuclear phosphoprotein 32 family, member B in the MORF expression compendium | 2.34E-08 |
| MORF_CSNK2B | Neighborhood of CSNK2B casein kinase 2, beta polypeptide in the MORF expression compendium | 3.97E-06 |
| MORF_PCNA | Neighborhood of PCNA proliferating cell nuclear antigen in the MORF expression compendium | 6.66E-06 |
| MORF_DEK | Neighborhood of DEK oncogene (DNA binding) in the MORF expression compendium | 4.97E-05 |
| SHIPP_FL_VS_DLBCL_DN | Genes upregulated in diffuse B-cell lymphomas (DLBCL) and downregulated in follicular lymphoma (FL) (fold change of at least 3) | 1.17E-04 |
| MORF_RAN | Neighborhood of RAN, member RAS oncogene family in the MORF expression compendium | 2.14E-04 |
| MORF_SKP1A | Neighborhood of SKP1A S-phase kinase-associated protein 1A (p19A) in the MORF expression Compendium | 2.28E-04 |
| TGANTCA_V$AP1_C | Genes with promoter regions [-2kb,2kb] around transcription start site containing the motif TGANTCA which matches annotation for JUN: jun oncogene | 4.47E-04 |
| GNF2_RAN | Neighborhood of RAN, member RAS oncogene family in the GNF2 expression compendium | 8.76E-04 |
| GCM_ANP32B | Neighborhood of ANP32B acidic (leucine-rich) nuclear phosphoprotein 32 family, member B in the GCM expression compendium | 1.92E-03 |
| MITOSIS | Genes annotated by the GO term GO:0007067. Progression through mitosis, the division of the eukaryotic cell nucleus to produce two daughter nuclei that, usually, contain the identical chromosome complement to their mother. | 1.10E-02 |
| SMITH_HTERT_UP | Genes upregulated by telomerase | 1.90E-02 |
| CHANG_SERUM_RESPONSE_UP | CSR (Serum Response) signature for activated genes (Stanford) | 2.13E-02 |
| DNA Damage and Repair | ||
| CIS_XPC_UP | Increased expression in XPC-defective fibroblasts, compared to normal fibroblasts, following treatment with cisplatin | 2.08E-07 |
| MORF_RAD23A | Neighborhood of RAD23A, RAD23 homolog A (S. cerevisiae) in the MORF expression compendium; nucleotide excision repair (NER) | 3.01E-07 |
| MORF_G22P1 | Neighborhood of G22P1 NULL in the MORF expression compendium a.k.a., XRCC6 Gene, X-ray repair complementing defective repair in Chinese hamster cells 6; a.k.a., thyroid autoantigen 70kD (Ku antigen) | 6.29E-07 |
| MORF_XRCC5 | Neighborhood of XRCC5 X-ray repair complementing defective repair in Chinese hamster cells 5 (double-strand-break rejoining; Ku autoantigen, 80kDa) in the MORF expression compendium | 2.48E-04 |
| MORF_EIF3S6 | Neighborhood of EIF3S6 eukaryotic translation initiation factor 3, subunit 6 48kDa in the MORF expression compendium; murine mammary tumor integration site 6 (oncogene homolog) | 3.61E-04 |
| GNF2_G22P1 | Neighborhood of G22P1 NULL in the GNF2 expression compendium | 4.90E-04 |
| MORF_RAD21 | Neighborhood of RAD21 RAD21 homolog (S. pombe) in the MORF expression compendium | 1.28E-03 |
| UVC_LOW_A2_UP | Up-regulated at 6-12 hours following treatment of WS1 human skin fibroblasts with UVC at a low dose (10 J/m^2) (cluster a2) | 3.90E-03 |
| UVB_NHEK3_C7 | Regulated by UV-B light in normal human epidermal keratinocytes, cluster 7 | 6.80E-03 |
| UVC_LOW_ALL_UP | Up-regulated at any timepoint following treatment of WS1 human skin fibroblasts with UVC at a low dose (10 J/m^2) (clusters a1-a4) | 7.84E-03 |
| UVB_NHEK3_C4 | Regulated by UV-B light in normal human epidermal keratinocytes, cluster 4 | 9.69E-03 |
| UVB_NHEK1_C4 | Upregulated by UV-B light in normal human epidermal keratinocytes, cluster 4 | 9.75E-03 |
| UVB_NHEK3_ALL | Regulated by UV-B light in normal human epidermal keratinocytes | 1.00E-02 |
| Scleroderma | ||
| MORF_FBL | Neighborhood of FBL fibrillarin in the MORF expression compendium a.k.a., 34 kDa nucleolar scleroderma antigen, or RNA, U3 small nucleolar interacting protein 1 | 7.49E-07 |
| Stem Cells | ||
| STEMCELL_NEURAL_UP | Enriched in mouse neural stem cells, compared to differentiated brain and bone marrow cells | 6.93E-06 |
| STEMCELL_EMBRYONIC_UP | Enriched in mouse embryonic stem cells, compared to differentiated brain and bone marrow cells | 1.97E-04 |
| LIN_WNT_UP | Genes up-regulated by APC in SW480 (colon cancer) | 7.50E-04 |
| HSC_INTERMEDIATE PROGENITORS_FETAL | Up-regulated in mouse hematopoietic intermediate progenitors from fetal liver (Intermediate Progenitors Shared + Fetal) | 3.75E-03 |
| HSA04310_WNT_ SIGNALING_PATHWAY | Genes involved in Wnt signaling pathway | 7.14E-03 |
| HSA04330_NOTCH_ SIGNALING_PATHWAY | Genes involved in Notch signaling pathway | 1.28E-02 |
| V$TCF4_Q5 | Genes with promoter regions [-2kb,2kb] around transcription start site containing the motif SCTTTGAW which matches annotation for TCF4: transcription factor 4 | 1.49E-02 |
| HSC_HSCANDPROGENITORS _SHARED | Up-regulated in mouse hematopoietic stem cells and progenitors from both adult bone marrow and fetal liver (Cluster iii, HSC and Progenitors Shared) | 2.00E-02 |
| HSC_HSCANDPROGENITORS _FETAL | Up-regulated in mouse hematopoietic stem cells and progenitors from fetal liver (HSC and Progenitors Shared) | 2.09E-02 |
| HSC_INTERMEDIATE PROGENITORS_SHARED | Up-regulated in mouse hematopoietic intermediate progenitors from both adult bone marrow and fetal liver (Cluster v, Intermediate Progenitors Shared) | 2.15E-02 |
| MAMMARY_DEV_UP | Up-regulated in the intact developing mouse mammary gland; higher expression in 5/6 week pubertal glands than in 3 week, mid-pregnant, lactating, involuting or resuckled glands | 2.15E-02 |
| Aging, Alzheimer's Disease, and Oxidative Stress | ||
| MORF_SOD1 | Neighborhood of SOD1 superoxide dismutase 1, soluble (amyotrophic lateral sclerosis 1 (adult)) in the MORF expression compendium | 1.98E-05 |
| ALZHEIMERS_DISEASE_UP | Upregulated in correlation with overt Alzheimer's Disease, in the CA1 region of the hippocampus | 9.05E-05 |
| MORF_JUND | Neighborhood of JUND jun D proto-oncogene in the MORF expression compendium | 2.87E-03 |
| Regulation of DNA Methylation | ||
| MORF_HDAC1 | Neighborhood of HDAC1 histone deacetylase 1 in the MORF expression compendium | 9.91E-06 |
| TSA_PANC50_UP | 50 most interesting genes upregulated by TSA treatment in at least one of four pancreatic cancer cell lines, but not in normal (HPDE) cells | 4.32E-04 |
| MORF_HAT1 | Neighborhood of HAT1 histone acetyltransferase 1 in the MORF expression compendium | 9.44E-04 |
| Breast Cancer Associated Tamoxifen-Resistance | ||
| MORF_NPM1 | Neighborhood of NPM1 nucleophosmin (nucleolar phosphoprotein B23, numatrin) in the MORF expression compendium | 1.73E-04 |
| GCM_NPM1 | Neighborhood of NPM1 nucleophosmin (nucleolar phosphoprotein B23, numatrin) in the GCM expression compendium | 7.21E-03 |
| GNF2_NPM1 | Neighborhood of NPM1 | 1.24E-02 |
| Metastasis | ||
| MORF_NME2 | Neighborhood of NME2 non-metastatic cells 2, protein (NM23B) expressed in in the MORF expression compendium | 2.04E-03 |
| MORF_MTA1 | Neighborhood of MTA1 metastasis associated 1 in the MORF expression compendium | 1.28E-02 |
| CROMER_HYPOPHARYNGEAL_ MET_VS_NON_UP | Genes increased in metastatic hypopharyngeal cancer tumours | 2.37E-02 |
| Myc-Associated Genes | ||
| CACGTG_V$MYC_Q2 | Genes with promoter regions [-2kb,2kb] around transcription start site containing the motif CACGTG which matches annotation for MYC: v-myc myelocytomatosis viral oncogene homolog (avian) | 2.05E-03 |
| LEE_MYC_TGFA_UP | Genes up-regulated in hepatoma tissue of Myc+Tgfa transgenic mice | 7.34E-03 |
| LEE_MYC_UP | Genes up-regulated in hepatoma tissue of Myc transgenic mice | 1.00E-02 |
| MYC_ONCOGENIC_SIGNATURE | Genes selected in supervised analyses to discriminate cells expressing c-Myc oncogene from control cells expressing GFP. | 1.00E-02 |
| V$MYC_Q2 | Genes with promoter regions [-2kb,2kb] around transcription start site containing the motif CACGTGS which matches annotation for MYC: v-myc myelocytomatosis viral oncogene homolog (avian) | 1.26E-02 |
| V$NMYC_01 | Genes with promoter regions [-2kb,2kb] around transcription start site containing the motif NNCCACGTGNNN which matches annotation for MYCN: v-myc myelocytomatosis viral related oncogene, neuroblastoma derived (avian) | 1.32E-02 |
| FERNANDEZ_MYC_TARGETS | MYC target genes by ChIP in U-937,HL60 (leukemia),P493 (B-cell),T98G (glioblastoma),WS1 (fibroblast) | 2.43E-02 |
| Inflammation/NF-kB/STAT Signaling | ||
| IL6_FIBRO_UP | Upregulated following IL-6 treatment in normal skin fibroblasts | 2.05E-03 |
| TNFALPHA_30MIN_UP | Upregulated 30min after TNF-alpha treatment of HeLa cells | 2.23E-03 |
| HESS_HOXAANMEIS1_UP | Genes upregulated in Hoxa9/Meis1 transduced cells vs control | 6.31E-03 |
| ST_INTERLEUKIN_13_PATHWAY | IL-13 is produced by Th2 cells on activation of the T cell antigen receptor, and by mast and basophil cells on activation of the IgE receptor. | 9.22E-03 |
| ST_IL_13_PATHWAY | Like IL-4, IL-13 is produced by Th2 cells on activation of the T cell antigen receptor, and by mast and basophil cells on activation of the IgE receptor. | 9.45E-03 |
| V$IRF_Q6 | Genes with promoter regions [-2kb,2kb] around transcription start site containing the motif BNCRSTTTCANTTYY which matches annotation for IRF1: interferon regulatory factor 1 | 1.42E-02 |
| TNFALPHA_ALL_UP | Upregulated at any timepoint after TNF-alpha treatment of HeLa cells | 1.44E-02 |
| TGFbeta Signaling/Myofibroblast Differentiation/Fibrosis | ||
| GCM_ACTG1 | Neighborhood of ACTG1 actin, gamma 1 in the GCM expression compendium | 2.18E-03 |
| TGFBETA_ALL_UP | Upregulated by TGF-beta treatment of skin fibroblasts, at any timepoint | 6.80E-03 |
| MYOD_BRG1_UP | Genes up-regulated following transduction of MyoD in NIH 3T3 cells that fail to acheive full induction with expression of a dominant-negative BRG1 allele | 7.07E-03 |
| MORF_ACTG1 | Neighborhood of ACTG1 actin, gamma 1 in the MORF expression compendium | 9.15E-03 |
| MYOD_NIH3T3_UP | Up-regulated at 24 hours in NIH 3T3 murine fibroblasts following transduction with MyoD and incubation in differentiation medium | 1.08E-02 |
| POMEROY_DESMOPLASIC_VS_ CLASSIC_MD_UP | Genes expressed in desmoplastic medulloblastomas. (p < 0.01) | 9.68E-03 |
| TGFBETA_LATE_UP | Upregulated by TGF-beta treatment of skin fibroblasts only at 1-4 hrs (clusters 4-6) | 2.36E-02 |
| Hypoxia/HIF Signaling/Mitochondrial Genes/Metabolism | ||
| HYPOXIA_REVIEW | Genes known to be induced by hypoxia | 8.96E-03 |
| HIF1_TARGETS | Hif-1 (hypoxia-inducible factor 1) transcripional targets | 1.07E-02 |
| HUMAN_MITODB_6_2002 | Mitochondrial genes | 1.08E-02 |
| MITOCHONDRIA | Mitochondrial genes | 1.28E-02 |
| HYPOXIA_RCC_UP | Upregulated by hypoxia in VHL-rescued renal carcinoma cells (Fig. 3f+g) | 1.42E-02 |
| HSA00330_ARGININE_AND _PROLINE_METABOLISM | Genes involved in arginine and proline metabolism | 2.20E-02 |
| Liver Specific Transcription | ||
| HSIAO_LIVER_SPECIFIC_GENES | Liver selective genes | 1.04E-02 |
We have independently shown that many of these same biological processes are activated in Cav-1 (-/-) stromal cells [9], consistent with the idea that Cav-1 (-/-) stromal cells are a valid model for exploring the tumor-promoting effects of an activated tumor stromal micro-environment.
Similarities of the Cav-1 (-/-) stromal gene set with transcriptional profiling data from ER-negative breast cancer
A comparison of the Cav-1 (-/-) stromal cell gene set with other existing transcriptional profiles also shows significant overlap with ER-negative human breast cancer (p = 8.96 x 10⁻¹⁰; BRCA_ER_NEG [28]). For this overlap analysis, UP genes from the Cav-1 (-/-) stromal data set with a fold-change of > 2.0 (KO/WT) and a P value of < 0.1 were utilized for comparison with existing gene sets in the data base.
Interestingly, these tumors were not laser-capture micro-dissected, so this provides an indication that the Cav-1 (-/-) stromal gene set may also be well represented in the transcriptional profiles obtained from whole tumors. A HeatMap containing these intersecting genes is shown in Figure 3 (205 overlapping genes; FC > 1.5; p < 0.05). See also Supplementary Tables.
These include key overlapping genes associated with metabolism and glycolysis (Acot7, Acsl4, Eno1, Gapdh, Ldhb, Mtrf1l, Pfkl, Pgk1, Pgm2, Pgm3, Slc2a5, Slc2a6), hypoxia (Hyou1), the inflammatory response (Aif1, C3, Ccl5, Crlf3, Ifngr1, Il10ra, Irak1, Irf5, Isg20, Nfib, Nfkbie, Nos3, Tnfaip3, Tnfrsf21, Tnfsf13b, Traf1), myofibroblast differentiation and the extracellular matrix (Actl6a, Capg, Col9a3, Dnmt3b, Mmp9, Myo10, Spock2, Tgfbi, Tgm1, Timp2), as well as DNA-damage and repair (Ddit3, Rad54l). These results are consistent with the existence of the "Reverse Warburg Effect" in ER-negative breast cancers.
Interestingly, it has been previously demonstrated that key secreted inflammatory factors, such as Aif1 (allograft inflammatory factor-1) (upregulated nearly 3-fold in Cav-1 (-/-) stromal cells; Supplementary Tables) promote NFkB-activation, the paracrine growth of ER-negative breast cancer cells [29], and are involved in the pathogenesis of pro-fibrotic diseases, such as scleroderma (systemic sclerosis) [30-32].
Similarly, Aif1 expression is highly-upregulated in the tumor stroma of human breast cancers (See Supplementary Table 1; p = 8.35 x 10⁻²⁴).
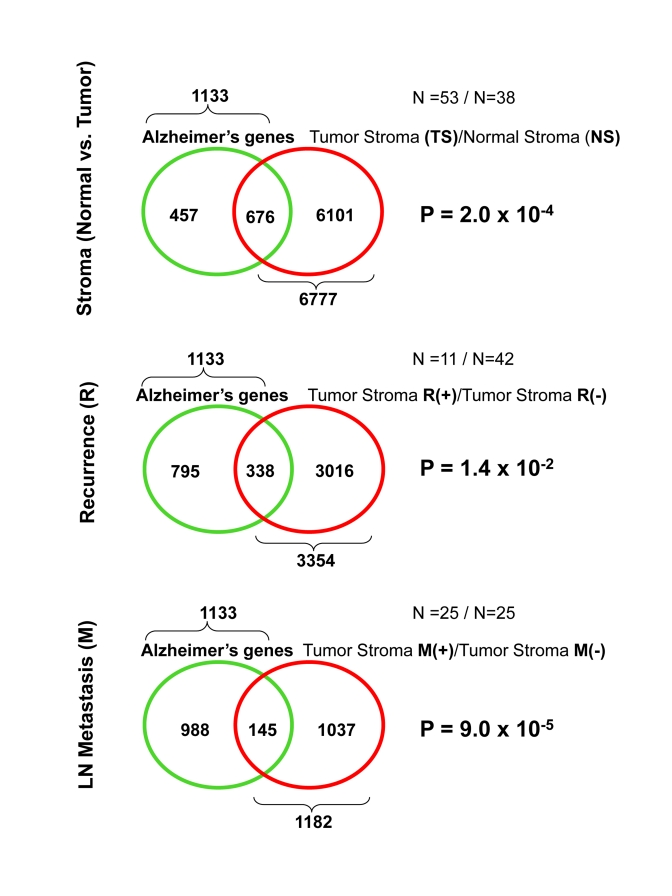
Figure 2. Venn diagrams for the transcriptional overlap between Alzheimer's disease brain and tumor stroma from breast cancer patients.
Discussion
Here, we provide compelling transcriptional evidence for the "Reverse Warburg Effect" in human breast cancer tumor stroma. Using an unbiased informatics analysis of transcriptional gene profiling, we show that Cav-1 (-/-) stromal cells bear a striking resemblance to the activated tumor stroma of human breast cancers. More specifically, the transcriptional profiles of Cav-1 (-/-) stromal cells were most closely related to the stroma of breast cancer patients that had undergone LN-metastasis. This is consistent with our previous data showing that a loss of stromal Cav-1 protein expression (by immuno-histochemistry) in human breast cancer tumor micro-arrays is specifically associated with increased LN-metastasis [3,4].
Moreover, we provide evidence that the tumor stroma of human breast cancers shows a transcriptional shift towards oxidative stress, DNA damage/repair, inflammation, hypoxia, and aerobic glycolysis. These findings are consistent with the "Reverse Warburg Effect" [8,9]. Notably, the tumor stroma of "metastasis-prone" breast cancer patients was also closely related to the transcriptional profiles derived from the brains of patients with Alzheimer's disease. As such, certain fundamental biological processes are common to both an activated tumor stroma and neuro-degenerative stress. These key biological processes most likely include oxidative stress, NO over-production (peroxynitrite formation), inflammation, hypoxia, and mitochondrial dysfunction, which are all thought to drive Alzheimer's disease pathogenesis.
Thus, we avidly reviewed the literature regarding theories of neuronal functioning, neuronal stress, and neuro-degeneration, in the central nervous system and we stumbled upon the idea of "Neuron-Glia Metabolic Coupling" [11-18] In this model, first proposed over 10 years ago, astrocytes shift towards aerobic glycolyis, secrete pyruvate and lactate, which is then taken-up by adjacent neurons and then "feeds" into the neuronal TCA cycle, resulting in increased neuronal oxidative mitochondrial metabolism, and higher ATP production in neurons. In essence, the astrocytes would function as support cells to "feed" the adjacent neuronal cells. Thus, "Neuron-Glia Metabolic Coupling" and the "Reverse Warburg Effect" are analogous biological processes, where the astrocytes are the cancer-associated fibroblasts and the neurons are the epithelial tumor cells. As such, we propose that the "Reverse Warburg Effect" could also be more generally termed "Epithelial-Stromal Metabolic Coupling" or "Epithelial-Fibroblast Metabolic Coupling".
If these two processes are indeed analogous, then epithelial tumor cells have already learned to behave as neurons, using the stroma as a means of support and nourishment. Figure 4 directly compares "Neuron-Glia Metabolic Coupling" with the "Reverse Warburg effect" schematically.
Myofibroblasts and mesenchymal stem cells are known to often express GFAP (glial fibrillary acidic protein) [19-21], an intermediate filament protein that is thought to be relatively specific for astrocytes in the central nervous system. Table 5 shows that GFAP and other glial-related gene transcripts are indeed upregulated in "tumor stroma" and in the stroma of "metastasis-prone" breast cancer patients. Thus, possible metabolic and functional similarities between CNS astrocytes and myofibroblasts/cancer-associated fibroblasts should be further explored.
Interestingly, in "Neuron-Glia Metabolic Coupling" the glycolytic shift in astrocytes is thought to be mediated by the secretion of glutamate (a neurotransmitter) from neurons. Then, astrocytes take up glutamate via high affinity sodium-dependent glutamate transporters, such as Slc1a2 and Slc1a3. Importantly, one of these two glial-specific glutamate transporters (Slc1a3) is also transcriptionally over-expressed in the stroma of human breast cancer patients (Table 5). As such, the similarities between brain astrocytes, myofibroblasts, mesenchymal stem cells, and tumor stromal cells may be more extensive than we previously appreciated.
Table 5. Expression of glial-related genes in human breast cancer stromal gene sets.
Gfap is highlighted in bold because it is also known to be a common marker of astrocytes, myo-fibroblasts, and mesenchymal stem cells.
| Gene | Description | Tumor Stroma | Recurrence -Prone Stroma | Metastasis-Prone Stroma |
| Gcm1 | glial cells missing homolog 1 (Drosophila) | 6.50e-21 | 8.39e-04 | |
| Gfap | glial fibrillary acidic protein | 1.64e-18 | 1.36e-03 | 2.28e-02 |
| Gfra2 | glial cell line derived neurotrophic factor family receptor alpha 2 | 2.28e-17 | 3.58E-02 | |
| Slc1a3 | solute carrier family 1 (glial high affinity glutamate transporter), member 3 | 4.22e-17 | 5.70e-03 | |
| Gfra3 | glial cell line derived neurotrophic factor family receptor alpha 3 | 2.97e-16 | ||
| Gdnf | glial cell line derived neurotrophic factor | 6.48e-14 | ||
| Gcm2 | glial cells missing homolog 2 (Drosophila) | 1.38e-05 | 2.06e-02 | |
| Gfra4 | glial cell line derived neurotrophic factor receptor alpha 4 | 1.02e-02 |
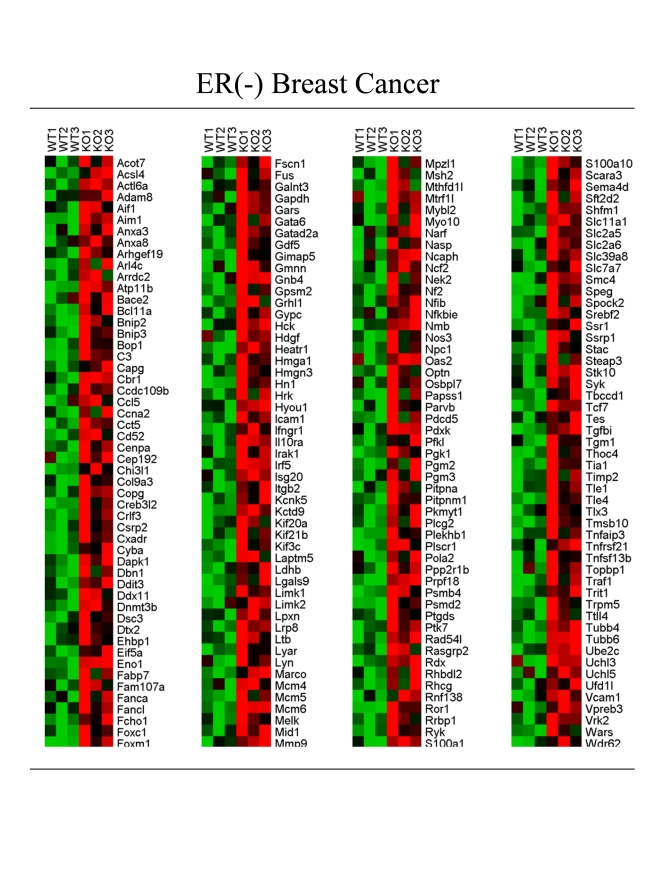
Figure 3. Transcriptional overlap of the Cav-1 (-/-) stromal gene set with ER-negative breast cancer.
A HeatMap containing 205 intersecting genes is shown (FC >1.5; p <0.05). See
also Supplementary Tables. FC, fold-change.
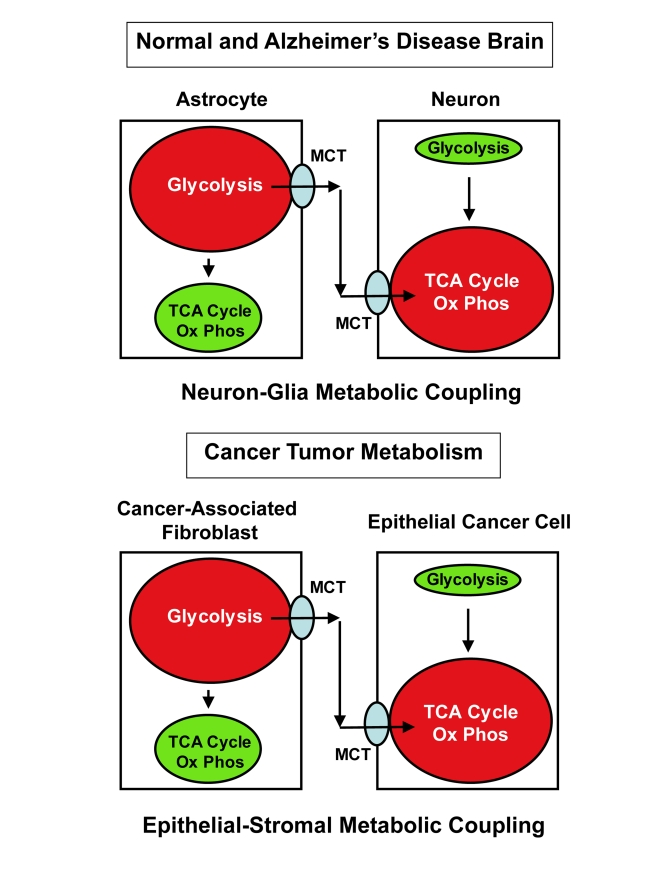
Figure 4. Comparisons between the "Reverse Warburg Effect" and "Neuron-Glia Metabolic Coupling", suggest "Epithelial-Stromal Metabolic Coupling".
In "Neuron-Glia Metabolic Coupling", astrocytes take up more glucose, shift towards aerobic
glycolyis, secrete pyruvate and lactate, which is then taken up by adjacent
neurons and then "feeds" into the neuronal TCA cycle, resulting in
increased neuronal oxidative mitochondrial metabolism, and higher ATP
production in neurons. In essence, the astrocytes function as support cells
to "feed" the adjacent neuronal cells. This schematic diagram shows that
"Neuron-Glia Metabolic Coupling" and the "Reverse Warburg Effect" are
analogous biological processes, where the astrocytes are the
cancer-associated fibroblasts and the neurons are the epithelial tumor cells. Thus, the "Reverse Warburg Effect"
could also be more generally termed "Epithelial-Stromal Metabolic Coupling"
or "Epithelial-Fibroblast Metabolic Coupling". This figure was partially
re-drawn from Bonucelli et al. 2010, with permission [24]. MCT,
mono-carboxylate transporter.
Methods of analysis
Venn diagrams. In the Venn diagram of Figure 1, we show the intersections between the set of genes that are upregulated in Cav-1 (-/-) versus wild-type stromal cells [8] and three breast cancer gene sets [10].
(a) the set of stromal genes that are upregulated in breast cancer tumor patients versus normal breast stroma; (b) the set of stromal genes that are upregulated in recurrence positive versus recurrence negative breast cancer patients (c) the set of stromal genes that are upregulated in lymph-node metastasis positive versus lymph-node metastasis negative breast cancer patients.
In the Venn diagram of Figure 2, we show the intersections between the set of genes that are upregulated in Alzheimer's brain disease [22] and the sets of genes (a)-(c) listed above. The p-values determining the significance of upregulation for each gene were computed using a one-sided t-test statistic (Tables 1, 2, and 5). For each pair (X,Y) of sets of genes, we also computed the probability (p-value) that the size of their intersection is less than or equal to the size of the intersection between set X and a randomly-chosen set of size equal to the size of set Y. This probability was calculated by applying the cumulative density function of the hypergeometric distribution on the size of set X, the size of set Y, the observed overlap between X and Y, and the total number of available genes.
Gene set enrichment analysis. For the functional analysis presented in Table 4, we used data from the Molecular Signatures Database (MsigDB [23]) which comprises a collection of gene sets: - collected from various sources such as online pathway databases, publications, and knowledge of domain experts, - comprising genes that share a conserved cis-regulatory motif across the human, mouse, rat, and dog genomes, - identified as co-regulated gene clusters by mining large collections of cancer-oriented microarray data, and - annotated by a common Gene Ontology (GO) term.
For our analysis we used the latest release of MSigDB database v2.5 (April 7, 2008), after converting all the gene names in the database into RefSeq gene IDs. After this preprocessing step, we chose the sub-collection of gene sets that was relevant to our study, and for each gene set X in that sub-collection, we computed the overlap between X and the set of genes Y that are upregulated in lymph-node metastasis positive versus lymph-node metastasis negative breast cancer patients (p-value ≤0.05). Then, we computed the probability (p-value) of the observed overlap between sets X and Y as described in the "Venn diagrams" section.
Supplementary Materials
Acknowledgments
M.P.L. and his laboratory were supported by grants from the NIH/NCI (R01-CA-080250; R01-CA-098779; R01-CA-120876; R01-AR-055660), and the Susan G. Komen Breast Cancer Foundation. F.S. was supported by grants from the W.W. Smith Charitable Trust, the Breast Cancer Alliance (BCA), and a Research Scholar Grant from the American Cancer Society (ACS). P.G.F. was supported by a grant from the W.W. Smith Charitable Trust, and a Career Catalyst Award from the Susan G. Komen Breast Cancer Foundation. R.G.P. was supported by grants from the NIH/NCI (R01-CA-70896, R01-CA-75503, R01-CA-86072, and R01-CA-107382) and the Dr. Ralph and Marian C. Falk Medical Research Trust. The Kimmel Cancer Center was supported by the NIH/NCI Cancer Center Core grant P30-CA-56036 (to R.G.P.). Funds were also contributed by the Margaret Q. Landenberger Research Foundation (to M.P.L.). This project is funded, in part, under a grant with the Pennsylvania Department of Health (to M.P.L.). The Department specifically disclaims responsibility for any analyses, interpretations or conclusions. This work was also supported, in part, by a Centre grant in Manchester from Breakthrough Breast Cancer in the U.K. (to A.H.) We would also like to thank Despina Hadjikyriakou who provided the crucial link between the two co-first authors of this paper by introducing them to each other and foreseeing the potential of their collaboration. The authors would also like to thank Dr. Isidore Rigoutsos (IBM/Thomas Jefferson University) for his generous help and critical reading of the manuscript.
Conflicts of Interest
The authors of this manuscript have no conflict of interest to declare.
References
- 1. Mercier I , Casimiro MC , Wang C , Rosenberg AL , Quong J , Allen KG , Danilo C , Sotgia F , Bonnucelli G , Jasmin JF , Xu H , Bosco E , Aronow B , Witkiewicz A , Pestell RG , Knudsen ES and Lisanti MP. Human Breast Cancer-Associated Fibroblasts (CAFs) Show Caveolin-1 Down-regulation and RB Tumor Suppressor Functional Inactivation: Implications for the Response to Hormonal Therapy. Cancer Biol Ther. 2008; 7: 1212 -25. [PubMed] .
- 2. Sotgia F , Del Galdo F , Casimiro MC , Bonuccelli G , Mercier I , Whitaker-Menezes D , Daumer KM , Zhou J , Wang C , Katiyar S , Xu H , Bosco E , Quong AA , Aronow B , Witkiewicz AK , Minetti C , Frank PG , Jimenez SA , Knudsen ES , Pestell RG and Lisanti MP. Caveolin-1-/- null mammary stromal fibroblasts share characteristics with human breast cancer-associated fibroblasts. Am J Pathol. 2009; 174: 746 -61. [PubMed] .
- 3. Witkiewicz AK , Casimiro MC , Dasgupta A , Mercier I , Wang C , Bonuccelli G , Jasmin JF , Frank PG , Pestell RG , Kleer CG , Sotgia F and Lisanti MP. Towards a new "stromal-based" classification system for human breast cancer prognosis and therapy. Cell Cycle. 2009; 8: 1654 -8. [PubMed] .
- 4. Witkiewicz AK , Dasgupta A , Sotgia F , Mercier I , Pestell RG , Sabel M , Kleer CG , Brody JR and Lisanti MP. An Absence of Stromal Caveolin-1 Expression Predicts Early Tumor Recurrence and Poor Clinical Outcome in Human Breast Cancers. Am J Pathol. 2009; 174: 2023 -34. [PubMed] .
- 5. Sloan EK , Ciocca D , Pouliot N , Natoli A , Restall C , Henderson M , Fanelli M , Cuello-Carrión F , Gago F and Anderson R. Stromal Cell Expression of Caveolin-1 Predicts Outcome in Breast Cancer. Am J Pathol. 2009; 174: 2035 -43. [PubMed] .
- 6. Witkiewicz AK , Dasgupta A , Nguyen KH , Liu C , Kovatich AJ , Schwartz GF , Pestell RG , Sotgia F , Rui H and Lisanti MP. Stromal caveolin-1 levels predict early DCIS progression to invasive breast cancer. Cancer Biol Ther. 2009; 8: 1167 -75. [PubMed] .
- 7. Di Vizio D , Morello M , Sotgia F , Pestell RG , Freeman MR and Lisanti MP. An Absence of Stromal Caveolin-1 is Associated with Advanced Prostate Cancer, Metastatic Disease and Epithelial Akt Activation. Cell Cycle. 2009; 8: 2420 -4. [PubMed] .
- 8. Pavlides S , Whitaker-Menezes D , Castello-Cros R , Flomenberg N , Witkiewicz AK , Frank PG , Casimiro MC , Wang C , Fortina P , Addya S , Pestell RG , Martinez-Outschoorn UE , Sotgia F and Lisanti MP. The reverse Warburg effect: aerobic glycolysis in cancer associated fibroblasts and the tumor stroma. Cell Cycle. 2009; 8: 3984 -4001. [PubMed] .
- 9. Pavlides S , Tsirigos A , Vera I , Flomenberg N , Frank PG , Casimiro MC , Wang C , Fortina P , Addya S , Pestell RG , Rigoutsos I , Martinez-Outschoorn UE , Sotgia F and Lisanti MP. Loss of Stromal Caveolin-1 Leads to Oxidative Stress, Mimics Hypoxia, and Drives Inflammation in the Tumor Microenvironment, Conferring the "Reverse Warburg Effect": A Transcriptional Informatics Analysis with Validation. Cell Cycle. 2010; In Press .
- 10. Finak G , Bertos N , Pepin F , Sadekova S , Souleimanova M , Zhao H , Chen H , Omeroglu G , Meterissian S , Omeroglu A , Hallett M and Park M. Stromal gene expression predicts clinical outcome in breast cancer. Nat Med. 2008; 14: 518 -27. [PubMed] .
- 11. Magistretti PJ Role of glutamate in neuron-glia metabolic coupling. Am J Clin Nutr. 2009; 90: 875S -80S. [PubMed] .
- 12. Magistretti PJ Neuron-glia metabolic coupling and plasticity. J Exp Biol. 2006; 209: 2304 -11. [PubMed] .
- 13. Kasischke KA , Vishwasrao HD , Fisher PJ , Zipfel WR and Webb WW. Neural activity triggers neuronal oxidative metabolism followed by astrocytic glycolysis. Science. 2004; 305: 99 -103. [PubMed] .
- 14. Tsacopoulos M Metabolic signaling between neurons and glial cells: a short review. J Physiol Paris. 2002; 96: 283 -8. [PubMed] .
- 15. Hulsmann S , Oku Y , Zhang W and Richter DW. Metabolic coupling between glia and neurons is necessary for maintaining respiratory activity in transverse medullary slices of neonatal mouse. Eur J Neurosci. 2000; 12: 856 -62. [PubMed] .
- 16. Magistretti PJ and Pellerin L. The contribution of astrocytes to the 18F-2-deoxyglucose signal in PET activation studies. Mol Psychiatry. 1996; 1: 445 -52. [PubMed] .
- 17. Tsacopoulos M and Magistretti PJ. Metabolic coupling between glia and neurons. J Neurosci. 1996; 16: 877 -85. [PubMed] .
- 18. Pellerin L and Magistretti PJ. Glutamate uptake into astrocytes stimulates aerobic glycolysis: a mechanism coupling neuronal activity to glucose utilization. Proc Natl Acad Sci U S A. 1994; 91: 10625 -9. [PubMed] .
- 19. Cassiman D , Libbrecht L , Desmet V , Denef C and Roskams T. Hepatic stellate cell/myofibroblast subpopulations in fibrotic human and rat livers. J Hepatol. 2002; 36: 200 -9. [PubMed] .
- 20. Olaso E , Salado C , Egilegor E , Gutierrez V , Santisteban A , Sancho-Bru P , Friedman SL and Vidal-Vanaclocha F. Proangiogenic role of tumor-activated hepatic stellate cells in experimental melanoma metastasis. Hepatology. 2003; 37: 674 -85. [PubMed] .
- 21. Tondreau T , Lagneaux L , Dejeneffe M , Massy M , Mortier C , Delforge A and Bron D. Bone marrow-derived mesenchymal stem cells already express specific neural proteins before any differentiation. Differentiation. 2004; 72: 319 -26. [PubMed] .
- 22. Blalock EM , Geddes JW , Chen KC , Porter NM , Markesbery WR and Landfield PW. Incipient Alzheimer's disease: microarray correlation analyses reveal major transcriptional and tumor suppressor responses. Proc Natl Acad Sci U S A. 2004; 101: 2173 -8. [PubMed] .
- 23. Subramanian A , Tamayo P , Mootha VK , Mukherjee S , Ebert BL , Gillette MA , Paulovich A , Pomeroy SL , Golub TR , Lander ES and Mesirov JP. Gene set enrichment analysis: a knowledge-based approach for interpreting genome-wide expression profiles. Proc Natl Acad Sci U S A. 2005; 102: 15545 -50. [PubMed] .
- 24. Bonuccelli G , Whitaker-Menezes D , Castello-Cros R , Pavlides S , Pestell RG , Fatatis A , Witkiewicz AK , Vander Heiden MG , Migneco G , Chiavarina B , Frank PG , Capozza F , Flomenberg N , Martinez-Outschoorn UE , Sotgia F and Lisanti MP. The Reverse Warburg Effect: Glycolysis Inhibitors Prevent the Tumor Promoting Effects of Caveolin-1 Deficient Cancer Associated Fibroblasts. Cell Cycle. 2010; 9: In Press .
- 25. Benita Y , Kikuchi H , Smith AD , Zhang MQ , Chung DC and Xavier RJ. An integrative genomics approach identifies Hypoxia Inducible Factor-1 (HIF-1)-target genes that form the core response to hypoxia. Nucleic Acids Res. 2009; 37: 4587 -602. [PubMed] .
- 26. Lovas A , Radke D , Albrecht D , Yilmaz ZB , Moller U , Habenicht AJ and Weih F. Differential RelA- and RelB-dependent gene transcription in LTbetaR-stimulated mouse embryonic fibroblasts. BMC Genomics. 2008; 9: 606 [PubMed] .
- 27. Yao J , Irwin RW , Zhao L , Nilsen J , Hamilton RT and Brinton RD. Mitochondrial bioenergetic deficit precedes Alzheimer's pathology in female mouse model of Alzheimer's disease. Proc Natl Acad Sci U S A. 2009; 106: 14670 -5. [PubMed] .
- 28. van 't Veer LJ , Dai H , van de Vijver MJ , He YD , Hart AA , Mao M , Peterse HL , van der Kooy K , Marton MJ , Witteveen AT , Schreiber GJ , Kerkhoven RM , Roberts C , Linsley PS , Bernards R and Friend SH. Gene expression profiling predicts clinical outcome of breast cancer. Nature. 2002; 415: 530 -6. [PubMed] .
- 29. Liu S , Tan WY , Chen QR , Chen XP , Fu K , Zhao YY and Chen ZW. Daintain/AIF-1 promotes breast cancer proliferation via activation of the NF-kappaB/cyclin D1 pathway and facilitates tumor growth. Cancer Sci. 2008; 99: 952 -7. [PubMed] .
- 30. Del Galdo F and Jimenez SA. T cells expressing allograft inflammatory factor 1 display increased chemotaxis and induce a profibrotic phenotype in normal fibroblasts in vitro. Arthritis Rheum. 2007; 56: 3478 -88. [PubMed] .
- 31. Otieno FG , Lopez AM , Jimenez SA , Gentiletti J and Artlett CM. Allograft inflammatory factor-1 and tumor necrosis factor single nucleotide polymorphisms in systemic sclerosis. Tissue Antigens. 2007; 69: 583 -91. [PubMed] .
- 32. Del Galdo F , Maul GG , Jimenez SA and Artlett CM. Expression of allograft inflammatory factor 1 in tissues from patients with systemic sclerosis and in vitro differential expression of its isoforms in response to transforming growth factor beta. Arthritis Rheum. 2006; 54: 2616 -25. [PubMed] .