


Introduction
TP63, a member of the TP53 gene family, encodes p63 with 2 types of isoforms: a form with the N-terminal transactivation (TA) domain (TAp63) and a truncated form without the N-terminus (∆Np63). Both TAp63 and ΔNp63 have isoforms α, β, γ, δ, and ε owing to alternative splicing at the 3′ end [1–5]. p63 shares structural and sequence homology with p53 and p73, the third member of the p53 family [1, 6]. Like p53, TAp63 has been implicated in cell cycle arrest and apoptosis in response to DNA damage, ectoderm development, maternal reproduction and metabolism, dependent or independent of p53-functions [1, 7#x2013;13]. For example, TAp63 can transactivate some well-known p53 target genes including CDKN1A, BAX and MDM2 [1, 14]. Moreover, p53-dependent apoptosis in response to DNA damage required p63 and p73 in mouse developing brain and embryonic fibroblasts [7]. However, in a mouse model p63 and p73 did not contribute to p53 tumor suppression function in lymphoma development [15]. ∆Np63, on the other hand, interacts with p53, TAp63, and TAp73 in a dominant-negative fashion to inhibit their tumor-suppressive functions [3]. It is generally believed that TAp63, like p53, is a tumor suppressor, whereas ∆Np63 has a critical role in epidermal development and functions as an oncogene in a mouse model [16–19]. Furthermore, the α, β, γ, δ, and ε isoforms of TAp63 and ΔNp63 have differential functions [5, 14, 20–24].
In normal human tissues, p63 expression is tissue-specific and restricted to epithelial cells, certain subpopulations of basal cells, and occasionally cells in the germinal centers of lymph nodes [1, 25, 26]. Accordingly, in tumors structural disruption of TP63 and aberrant p63 expression are commonly seen in squamous cell and transitional cell carcinomas, but are also observed in non-Hodgkin lymphomas, predominantly in diffuse large B-cell lymphoma (DLBCL) and follicular lymphoma (grade 2 and 3) [25–30].
In basal epithelial cells and squamous cell carcinomas, the ∆Np63 isoform, especially ∆Np63α, is predominantly expressed, possibly due to the increased ∆Np63 stability caused by the lack of the transactivation domain which is indispensable for proteasome-dependent MDM2-independent degradation of p63 [24, 31]. In contrast, TAp63 is present mostly in epithelial lining cells at lower levels under normal physiological conditions, and in adenocarcinoma, thymoma and lymphoma cells; TAp63 accumulates in response to genotoxic stress [24, 26]. Although p63 expression has been shown in a few studies to indicate a poor prognosis in some carcinomas [32–34], its prognostic significance in DLBCL is unclear.
DLBCL is the most common type of non-Hodgkin lymphoma and can be divided into germinal center B-cell–like (GCB) and activated B-cell–like (ABC) subgroups by gene expression profiling [35]. Numerous genetic factors affecting the prognosis of DLBCL have been identified [36]. In our previous study, TP53 mutations were detected in approximately 20% of de novo DLBCL cases and conferred a worse prognosis among DLBCL patients treated with rituximab, cyclophosphamide, doxorubicin, vincristine, and prednisolone (R-CHOP) [37]. Overexpression of mutated but not wild-type p53 (WT-p53) protein is also associated with a poor prognosis in DLBCL patients [38]. The dysregulation, expression, and clinical implications of p63 in DLBCL are less clear than those of p53; likewise, p63's role in tumorigenesis and its functional relationship with p53 are not well understood. p63, predominantly TAp63 (likely TAp63β and/or TAp63γ) but not ∆Np63 or p63α, was found expressed in 15.1% to 52.5% of DLBCLs at higher levels than in normal lymphoid tissues [21, 25–27, 39]. Truncated p63 homologous to ∆Np63 due to TP63 gene rearrangements was also reported in 1.2%-5% of DLBCL, exclusive of GCB subtype [40, 41]. Conflicting results showing the effect of p63 expression on patients’ prognosis have been reported [21, 27, 39, 42, 43], likely owing to small number of patients (fewer than 100) in each study, the use of different cutoffs for p63 positivity, the differential functions and complicated interactions of multiple p63 isoforms [23, 43].
To fill this knowledge gap, we studied the prognostic effects of p63 expression correlating with TP53 status in a multicenter cohort of patients with well-characterized de novo DLBCL treated with R-CHOP. We found that p63 expression conferred better clinical outcomes in DLBCL which however could be compromised or abolished by the difference in International Prognostic Index (IPI) scores and/or the presence of TP53 mutations. We further investigated p63-associated biology to understand possible underlying molecular mechanisms.
Results
p63 expression in DLBCL
We observed nuclear expression of p63 at variable levels in tumor cells of 317 (61%) of 520 samples from patients in the training set and 180 (65%) of 275 samples from patients in the validation set. Representative immunohistochemical stains are shown in Fig 1A, B and the histograms of p63 expression by immunohistochemistry are shown in Fig 1C, D. The mean number of p63 positive tumor cells in the training set was 18%, which was significantly higher than that of WT-p53 (P=0.017) but significantly lower than that of mutated p53 (MUT-p53, P<0.0001, Fig 1E) (Supplemental Fig 1A, B) [37, 38], although the TP63 mRNA levels were significantly lower than the TP53 mRNA levels (P<0.0001, Fig 1F). p63 protein expression significantly correlated with TP63 mRNA (Spearman rank correlation: r=0.596, P<0.0001).
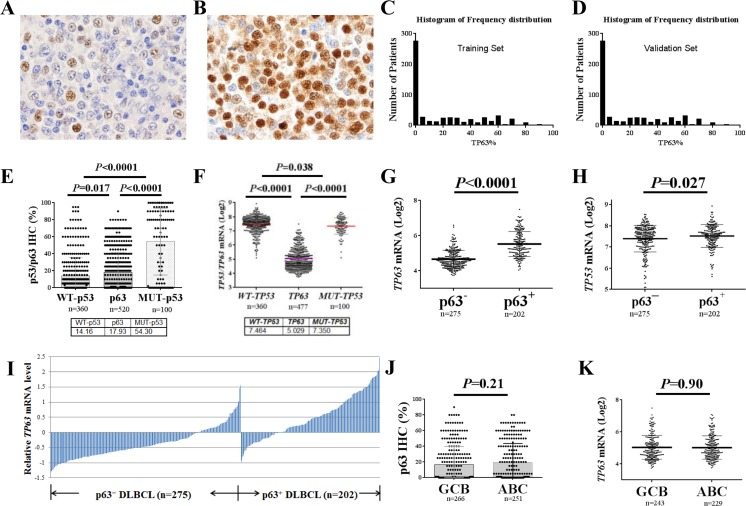
Figure 1. p63 expression in diffuse large B-cell lymphoma (DLBCL) in comparison with p53 expression (A-B) Representative immunohistochemistry staining for p63 (10% and 95%) in DLBCL. (C-D) Histograms of p63 expression in the training and validation sets. (E) Comparisons between p63 and p53 expression levels in DLBCL. (F) Comparisons between TP63 and TP53 mRNA levels in DLBCL. (G) p63+ DLBCL had significantly higher levels of TP63 mRNA compared with p63− DLBCL. (H) p63+ DLBCL had significantly higher TP53 mRNA levels compared with p63− DLBCL. (I) Expression of p63 protein correlated with TP63 mRNA levels. The TP63 mRNA expression levels (Log2 values) were retrieved from the gene expression profiling data. The mean values of 3 probe-sets (1555581_a_at, 207382_at, 209863_s_at) for each patient were used. The relative mRNA level refers to the difference between the TP63 mRNA level for each patient and the mean TP63 mRNA level for the entire cohort. (J-K) Comparisons of p63 protein and TP63 mRNA expression levels between germinal center B-cell–like (GCB) and activated B-cell–like (ABC) subtypes of DLBCL patients.
Owing to the significantly lower level of p63 compared with MUT-p53 expression in DLBCL and the exclusion of potential false-positive cases, we used a cutoff value of 5% of tumor cells being p63-positive for p63 expression in DLBCL (p63+: >5%). Using this cutoff, 221 patients (42.5%) in the training set, and 130 (47%) of 275 patients in the validation set had p63+ DLBCL. The p63+ group showed a significantly higher mean TP63 mRNA level compared with the p63− group (unpaired t test, P<0.0001, Fig 1G) and TP53 mRNA level (Fig 1H). Transcriptional activation appeared to be the most common mechanism for p63 expression in this study of DLBCL (Fig 1I). No significant difference in the expression levels of p63/TP63 was observed between the GCB and ABC subtypes of tumor samples, either at the protein (16.66% vs. 19.26%, P=0.21) or mRNA (P=0.90) levels (Fig 1J, K).
Clinical and pathobiological features of p63+ DLBCL
We compared the clinicopathologic features of patients with p63+ and p63− DLBCL. The p63+ group more often had male (P=0.0056) and patients with small (< 5 cm) tumors (P=0.05) than did the p63− group. In addition, a higher proportion (41.9%) of p63+ patients had an IPI score >2 compared with p63− patients (34.4%), but this difference was not significant (P=0.086); however, by unpaired t test, patients with IPI scores >2 showed significantly higher mean levels of p63 (P=0.05, Fig 2A) and MUT-p53 (P=0.011, figure not shown) than did patients with IPI scores ≤ 2. When DLBCL cases were stratified into the GCB and ABC subtypes, in GCB-DLBCL p63+ compared with p63− patients was associated with IPI scores >2, small tumors, and possibly stage III/IV disease (P=0.06), whereas in ABC-DLBCL p63+ patients had higher percentages of male gender and extranodal DLBCL (44% compared with the 31% in p63− ABC-DLBCL) (Table 1). In contrast, WT-p53 overexpression was more common in nodal DLBCL (data not shown).
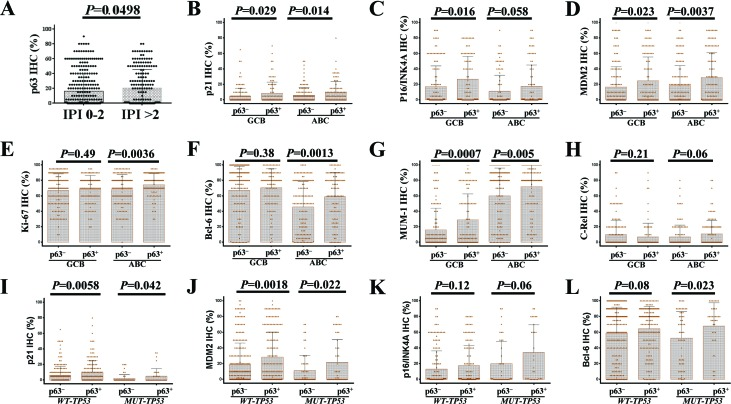
Figure 2. Correlations between p63 expression and other tumor associated factors (A) The group with high International Prognostic Index (IPI) scores had a significantly higher mean level of p63 expression. (B-D) p63 expression was associated with significantly higher levels of p21, MDM2, and p16-INK4a in both germinal center B-cell like (GCB) and activated B-cell like (ABC) subtypes of DLBCL patients. (E-F) p63 expression was associated with significantly higher levels Ki-67 and Bcl-6 in ABC-DLBCL. (G) p63 expression was associated with significantly higher levels of IRF4/MUM-1 in both GCB and ABC subtypes of DLBCL patients. (H) p63+ ABC-DLBCL was associated with a trend toward higher c-Rel level. (I-J) The association of p63 expression with p21 and MDM2 is independent of p53 mutation status. (K-L) p53 mutation status did not impact the association with increased p16-INK4a, Bcl-6 and IRF4/MUM-1(figure not shown) levels.
Table 1. Clinical characteristics of patients with de novo DLBCL in the training cohort
| DLBCL | GCB-DLBCL | ABC-DLBCL | |||||||||||||||||||||||||||||||||||||||||||||||||||||||||||||||||||||||||||||||||||||||||||||||||
|---|---|---|---|---|---|---|---|---|---|---|---|---|---|---|---|---|---|---|---|---|---|---|---|---|---|---|---|---|---|---|---|---|---|---|---|---|---|---|---|---|---|---|---|---|---|---|---|---|---|---|---|---|---|---|---|---|---|---|---|---|---|---|---|---|---|---|---|---|---|---|---|---|---|---|---|---|---|---|---|---|---|---|---|---|---|---|---|---|---|---|---|---|---|---|---|---|---|---|---|
| p63+ | p63− | p63+ | p63− | p63+ | p63− | ||||||||||||||||||||||||||||||||||||||||||||||||||||||||||||||||||||||||||||||||||||||||||||||
| N (%) | N (%) | P1 | N (%) | N (%) | P2 | N (%) | N (%) | P3 | P4 | ||||||||||||||||||||||||||||||||||||||||||||||||||||||||||||||||||||||||||||||||||||||||||
| Patients | 221 | 299 | 110 | 156 | 110 | 141 | .59 | ||||||||||||||||||||||||||||||||||||||||||||||||||||||||||||||||||||||||||||||||||||||||||||
| Age (yr) | |||||||||||||||||||||||||||||||||||||||||||||||||||||||||||||||||||||||||||||||||||||||||||||||||||
| < 60 | 92 (42) | 133 (45) | .52 | 52 (47) | 84 (54) | .29 | 39 (35) | 47 (33) | .73 | .075 | |||||||||||||||||||||||||||||||||||||||||||||||||||||||||||||||||||||||||||||||||||||||||
| ≥ 60 | 129 (58) | 166 (55) | 58 (53) | 72 (46) | 71 (65) | 94 (67) | |||||||||||||||||||||||||||||||||||||||||||||||||||||||||||||||||||||||||||||||||||||||||||||
| Sex | |||||||||||||||||||||||||||||||||||||||||||||||||||||||||||||||||||||||||||||||||||||||||||||||||||
| Female | 76 (34) | 139 (46) | .0056 | 41 (37) | 68 (44) | .30 | 34 (31) | 70 (50) | .0028 | .32 | |||||||||||||||||||||||||||||||||||||||||||||||||||||||||||||||||||||||||||||||||||||||||
| Male | 145 (66) | 160 (54) | 69 (63) | 88 (56) | 76 (69) | 71 (50) | |||||||||||||||||||||||||||||||||||||||||||||||||||||||||||||||||||||||||||||||||||||||||||||
| Stage | |||||||||||||||||||||||||||||||||||||||||||||||||||||||||||||||||||||||||||||||||||||||||||||||||||
| I-II | 94 (44) | 141(49) | .30 | 50 (48) | 89 (59) | .06 | 44 (41) | 51 (37) | .54 | .34 | |||||||||||||||||||||||||||||||||||||||||||||||||||||||||||||||||||||||||||||||||||||||||
| III-IV | 119 (56) | 148 (51) | 55 (52) | 61 (41) | 63 (59) | 86 (63) | |||||||||||||||||||||||||||||||||||||||||||||||||||||||||||||||||||||||||||||||||||||||||||||
| B symptoms | |||||||||||||||||||||||||||||||||||||||||||||||||||||||||||||||||||||||||||||||||||||||||||||||||||
| No | 136 (63) | 183 (65) | .63 | 73 (67) | 101 (70) | .67 | 62 (58) | 81 (60) | .76 | .17 | |||||||||||||||||||||||||||||||||||||||||||||||||||||||||||||||||||||||||||||||||||||||||
| Yes | 79 (37) | 97 (35) | 35 (32) | 43 (30) | 44 (42) | 53 (40) | |||||||||||||||||||||||||||||||||||||||||||||||||||||||||||||||||||||||||||||||||||||||||||||
| Serum LDH | |||||||||||||||||||||||||||||||||||||||||||||||||||||||||||||||||||||||||||||||||||||||||||||||||||
| Normal | 79 (39) | 107 (39) | .97 | 42 (42) | 56 (39) | .70 | 37 (36) | 51 (39) | .71 | .40 | |||||||||||||||||||||||||||||||||||||||||||||||||||||||||||||||||||||||||||||||||||||||||
| Elevated | 124 (61) | 169 (61) | 58 (58) | 86 (61) | 65 (64) | 81 (61) | |||||||||||||||||||||||||||||||||||||||||||||||||||||||||||||||||||||||||||||||||||||||||||||
| No. of extranodal sites | |||||||||||||||||||||||||||||||||||||||||||||||||||||||||||||||||||||||||||||||||||||||||||||||||||
| 0-1 | 156 (75) | 228 (79) | .27 | 79 (78) | 121 (81) | .56 | 76 (71) | 106 (77) | .30 | .23 | |||||||||||||||||||||||||||||||||||||||||||||||||||||||||||||||||||||||||||||||||||||||||
| ≥ 2 | 53 (25) | 61 (21) | 22 (22) | 28 (19) | 31 (29) | 32 (23) | |||||||||||||||||||||||||||||||||||||||||||||||||||||||||||||||||||||||||||||||||||||||||||||
| Performance status | |||||||||||||||||||||||||||||||||||||||||||||||||||||||||||||||||||||||||||||||||||||||||||||||||||
| 0-1 | 164 (85) | 225 (83) | .66 | 78 (85) | 119 (86) | .76 | 85 (84) | 104 (79) | .35 | .90 | |||||||||||||||||||||||||||||||||||||||||||||||||||||||||||||||||||||||||||||||||||||||||
| ≥ 2 | 30 (15) | 46 (17) | 14 (15) | 19 (14) | 16 (16) | 27 (21) | |||||||||||||||||||||||||||||||||||||||||||||||||||||||||||||||||||||||||||||||||||||||||||||
| Size of largest tumor | |||||||||||||||||||||||||||||||||||||||||||||||||||||||||||||||||||||||||||||||||||||||||||||||||||
| < 5cm | 106 (65) | 120 (55) | .05 | 56 (70) | 62 (55) | .04 | 49 (59) | 58 (54) | .51 | .14 | |||||||||||||||||||||||||||||||||||||||||||||||||||||||||||||||||||||||||||||||||||||||||
| ≥ 5cm | 58 (35) | 99 (45) | 24 (30) | 50 (45) | 34 (41) | 49 (46) | |||||||||||||||||||||||||||||||||||||||||||||||||||||||||||||||||||||||||||||||||||||||||||||
| IPI score | |||||||||||||||||||||||||||||||||||||||||||||||||||||||||||||||||||||||||||||||||||||||||||||||||||
| 0-2 | 125 (58) | 189 (66) | .086 | 65 (61) | 111 (75) | .025 | 59 (55) | 76 (56) | .90 | .32 | |||||||||||||||||||||||||||||||||||||||||||||||||||||||||||||||||||||||||||||||||||||||||
| 3-5 | 90 (42) | 99 (34) | 41 (39) | 38 (25) | 49 (45) | 61 (44) | |||||||||||||||||||||||||||||||||||||||||||||||||||||||||||||||||||||||||||||||||||||||||||||
| Therapy response | |||||||||||||||||||||||||||||||||||||||||||||||||||||||||||||||||||||||||||||||||||||||||||||||||||
| CR | 178 (81) | 227 (76) | .21 | 87 (79) | 118 (76) | .51 | 90 (82) | 104 (74) | .13 | .61 | |||||||||||||||||||||||||||||||||||||||||||||||||||||||||||||||||||||||||||||||||||||||||
| PR | 24 | 43 | 13 | 19 | 11 | 24 | |||||||||||||||||||||||||||||||||||||||||||||||||||||||||||||||||||||||||||||||||||||||||||||
| SD | 8 | 13 | 6 | 7 | 2 | 6 | |||||||||||||||||||||||||||||||||||||||||||||||||||||||||||||||||||||||||||||||||||||||||||||
| PD | 11 | 16 | 4 | 12 | 7 | 7 | |||||||||||||||||||||||||||||||||||||||||||||||||||||||||||||||||||||||||||||||||||||||||||||
| Primary origin | |||||||||||||||||||||||||||||||||||||||||||||||||||||||||||||||||||||||||||||||||||||||||||||||||||
| Nodal | 131 (60) | 193 (66) | .16 | 69 (64) | 97 (64) | 1.0 | 62 (56) | 95 (69) | .048 | .27 | |||||||||||||||||||||||||||||||||||||||||||||||||||||||||||||||||||||||||||||||||||||||||
| Extranodal | 88 (40) | 99 (34) | 39 (36) | 55 (36) | 48 (44) | 43 (31) | |||||||||||||||||||||||||||||||||||||||||||||||||||||||||||||||||||||||||||||||||||||||||||||
| Ki-67 | |||||||||||||||||||||||||||||||||||||||||||||||||||||||||||||||||||||||||||||||||||||||||||||||||||
| < 70% | 66 (30) | 119 (40) | .0016 | 41 (37) | 64 (42) | .45 | 24 (22) | 55 (39) | .004 | .018 | |||||||||||||||||||||||||||||||||||||||||||||||||||||||||||||||||||||||||||||||||||||||||
| ≥ 70% | 155 (70) | 175 (60) | 69 (63) | 88 (58) | 86 (78) | 86 (61) | |||||||||||||||||||||||||||||||||||||||||||||||||||||||||||||||||||||||||||||||||||||||||||||
| TP53 mutations | |||||||||||||||||||||||||||||||||||||||||||||||||||||||||||||||||||||||||||||||||||||||||||||||||||
| WT-TP53 | 154 (80) | 206 (77) | .65 | 70 (74) | 105 (76) | .76 | 83 (85) | 100 (79) | .38 | .059 | |||||||||||||||||||||||||||||||||||||||||||||||||||||||||||||||||||||||||||||||||||||||||
| MUT-TP53 | 40 (21) | 60 (23) | 25 (26) | 34 (24) | 15 (15) | 26 (21) | |||||||||||||||||||||||||||||||||||||||||||||||||||||||||||||||||||||||||||||||||||||||||||||
| MYC translocation | |||||||||||||||||||||||||||||||||||||||||||||||||||||||||||||||||||||||||||||||||||||||||||||||||||
| No | 138 (89) | 158 (88) | .86 | 62 (89) | 73 (80) | .20 | 75 (89) | 85 (95) | .15 | 1 | |||||||||||||||||||||||||||||||||||||||||||||||||||||||||||||||||||||||||||||||||||||||||
| Yes | 17 (11) | 22 (12) | 8 (11) | 18 (20) | 9 (11) | 4 (5) | |||||||||||||||||||||||||||||||||||||||||||||||||||||||||||||||||||||||||||||||||||||||||||||
| BCL2 translocation | |||||||||||||||||||||||||||||||||||||||||||||||||||||||||||||||||||||||||||||||||||||||||||||||||||
| No | 159 (84) | 187 (81) | .44 | 68 (74) | 74 (64) | .18 | 90 (94) | 113 (97) | .31 | .0002 | |||||||||||||||||||||||||||||||||||||||||||||||||||||||||||||||||||||||||||||||||||||||||
| Yes | 30 (16) | 44 (19) | 24 (26) | 41 (36) | 6 (6) | 3 (3) | |||||||||||||||||||||||||||||||||||||||||||||||||||||||||||||||||||||||||||||||||||||||||||||
| BCL6 translocation | |||||||||||||||||||||||||||||||||||||||||||||||||||||||||||||||||||||||||||||||||||||||||||||||||||
| No | 98 (60) | 145 (74) | .0041 | 54 (69) | 83 (78) | .16 | 43 (51) | 61 (69) | .0016 | .016 | |||||||||||||||||||||||||||||||||||||||||||||||||||||||||||||||||||||||||||||||||||||||||
| Yes | 66 (40) | 51 (26) | 24 (31) | 23 (22) | 42 (49) | 28 (31) | |||||||||||||||||||||||||||||||||||||||||||||||||||||||||||||||||||||||||||||||||||||||||||||
| REL gains | |||||||||||||||||||||||||||||||||||||||||||||||||||||||||||||||||||||||||||||||||||||||||||||||||||
| Normal | 140 (86) | 216 (92) | .068 | 62 (77) | 118 (92) | .003 | 77 (94) | 98 (92) | .036 | .0001 | |||||||||||||||||||||||||||||||||||||||||||||||||||||||||||||||||||||||||||||||||||||||||
| Amplification/polysomy | 23 (14) | 19 (8) | 18 (23) | 10 (8) | 5 (6) | 9 (8) | |||||||||||||||||||||||||||||||||||||||||||||||||||||||||||||||||||||||||||||||||||||||||||||
| REL amplification | |||||||||||||||||||||||||||||||||||||||||||||||||||||||||||||||||||||||||||||||||||||||||||||||||||
| No | 156 (95) | 227 (97) | .60 | 72 (91) | 121 (95) | .40 | 83 (99) | 106 (99) | 1.0 | .03 | |||||||||||||||||||||||||||||||||||||||||||||||||||||||||||||||||||||||||||||||||||||||||
| Yes | 8 (5) | 8 (3) | 7 (9) | 7 (5) | 1 (1) | 1 (1) | |||||||||||||||||||||||||||||||||||||||||||||||||||||||||||||||||||||||||||||||||||||||||||||
| CD30 expression | |||||||||||||||||||||||||||||||||||||||||||||||||||||||||||||||||||||||||||||||||||||||||||||||||||
| − | 175 (79) | 259 (88) | .0048 | 86 (78) | 133 (88) | .06 | 88 (80) | 125 (89) | .049 | .87 | |||||||||||||||||||||||||||||||||||||||||||||||||||||||||||||||||||||||||||||||||||||||||
| + | 46 (21) | 34 (12) | 24 (22) | 19 (12) | 22 (20) | 15 (11) | |||||||||||||||||||||||||||||||||||||||||||||||||||||||||||||||||||||||||||||||||||||||||||||
| p53 expression | |||||||||||||||||||||||||||||||||||||||||||||||||||||||||||||||||||||||||||||||||||||||||||||||||||
| < 20% | 116 (61) | 172 (66) | .27 | 57 (61) | 89 (66) | .40 | 59 (62) | 83 (66) | .48 | 1.0 | |||||||||||||||||||||||||||||||||||||||||||||||||||||||||||||||||||||||||||||||||||||||||
| ≥ 20% | 74 (39) | 87 (34) | 37 (39) | 45 (34) | 37 (38) | 42 (34) | |||||||||||||||||||||||||||||||||||||||||||||||||||||||||||||||||||||||||||||||||||||||||||||
| Abbreviations: DLBCL, diffuse large B-cell lymphoma; GCB, germinal center B-cell–like; ABC, activated B-cell–like; LDH, lactate dehydrogenase; IPI, International Prognostic Index; CR, complete remission; PR, partial response; SD, stable disease; PD, progressive disease. | |||||||||||||||||||||||||||||||||||||||||||||||||||||||||||||||||||||||||||||||||||||||||||||||||||
| Note:P values indicate the significance of differences in the positivity frequencies of listed parameters between 2 groups. P1 values are for comparisons between overall p63+ and p63− DLBCL patients; P2 values are for comparisons between p63+ and p63− GCB-DLBCL patients; P3 values are for comparisons between p63+ and p63− ABC-DLBCL patients; P4 values are for comparisons between p63+ GCB-DLBCL and p63+ ABC-DLBCL patients. For therapy response, we calculated P values by comparing CR to other responses. | |||||||||||||||||||||||||||||||||||||||||||||||||||||||||||||||||||||||||||||||||||||||||||||||||||
When correlating p63 expression with other genetic abnormalities and immunohistochemical biomarkers in DLBCL, we found that the p63+ group had higher frequencies of BCL6 translocation and CD30 positivity (21% compared with the 12% in p63− patients) (Table 1), as well as elevated expression levels of Bcl-6, IRF4/MUM-1, p21, MDM2, p16-INK4a, and Ki-67 (in ABC-DLBCL only); most of these associations were independent of TP53 mutation status (Fig 2B-L). In addition, p63 expression was associated with REL gains (including amplification and polysomies) in both the GCB and ABC subsets. No significant differences in frequencies of TP53 mutations, MYC or BCL2 translocations, or the expression levels of p53, Myc, or Bcl-2, were observed between the p63+ and p63− groups.
p63 expression confers better clinical outcomes, more apparently in high-risk DLBCL and ABC-DLBCL
Univariate survival analysis in the training set
With a median follow-up of 62 months, p63+ DLBCL patients showed better progression-free survival (PFS, P=0.05) compared with p63− DLBCL patients (Fig 3a, b). When patients with low-risk (IPI score ≤ 2) and high-risk DLBCL (IPI score >2) were analyzed separately (Fig 3c, d), p63 expression showed prognostic significance only in the high-risk group and correlated with significantly better overall survival (OS) (P=0.006) and PFS (P=0.0043).
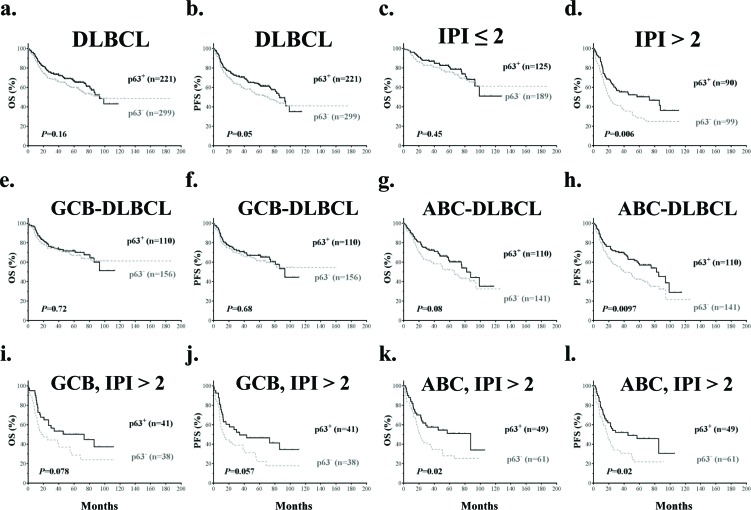
Figure 3. Prognostic analysis of p63 expression in DLBCL (a-b) p63 expression correlated with significantly better progression-free survival (PFS) but not overall survival (OS) in DLBCL. (c-d) p63 expression correlated with significantly better overall survival in DLBCL patients with IPI scores > 2 but not in DLBCL patients with IPI scores ≤ 2. (e-h) p63 expression correlated with significantly better PFS in ABC- but not GCB-DLBCL patients. (i-j) p63 expression was associated with trends towards better survival outcomes in GCB-DLBCL patients with IPI scores > 2. (k-l) p63 expression correlated with significantly better survival outcomes in ABC-DLBCL patients with IPI scores > 2.
When analyzed in GCB- and ABC-DLBCL subsets separately, patients with p63+ ABC-DLBCL showed significantly better PFS (P=0.0097) and a trend of better OS (P=0.08) compared with p63− ABC-DLBCL patients. In contrast, in GCB-DLBCL, p63 expression did not show significant impact on OS or PFS (Fig 3e-h). Consistently, survival analysis based on TP63 mRNA levels showed that TP63 mRNA expression correlated with favorable OS and significantly better PFS in ABC-DLBCL patients only (P=0.06 and P=0.036 respectively, Supplemental Fig S1D-G).
Since the p63+ GCB-DLBCL group had a higher portion of patients with high-risk DLBCL (Table 1) which may have confounded the analysis [44], patients with low-risk and high-risk DLBCL were analyzed separately. In GCB-DLBCL patients with IPI scores >2, p63+ GCB-DLBCL patients showed trends of better OS and PFS (P=0.078 and P=0.057 respectively) (Fig 3i-j). Similarly, the prognostic impact of p63 expression in ABC-DLBCL patients was more apparent in those with IPI scores >2 (Fig 3k-l); For ABC-DLBCL patients with IPI scores ≤ 2, OS and PFS rates were higher for p63+ patients but not the differences were not significant (P=0.48 and P=0.12 respectively).
Multivariate survival analysis
We performed multivariate survival analysis for p63 expression adjustin g clinic al parameters including IPI score, sex, tumor size and B symptoms. p63 expression was found to be an independent prognostic factor for better OS in the overall DLBCL, GCB-DLBCL and ABC-DLBCL sets, and an independent prognostic factor for better PFS in the overall DLBCL and ABC-DLBCL sets but not in the GCB-DLBCL set (Table 2).
Table 2. Multivariate survival analysis
| OS | PFS | ||||||||||||||||||||||||||||||||||||||||||||||||||||||||||||||||||||||||||||||||||||||||||||||||||
|---|---|---|---|---|---|---|---|---|---|---|---|---|---|---|---|---|---|---|---|---|---|---|---|---|---|---|---|---|---|---|---|---|---|---|---|---|---|---|---|---|---|---|---|---|---|---|---|---|---|---|---|---|---|---|---|---|---|---|---|---|---|---|---|---|---|---|---|---|---|---|---|---|---|---|---|---|---|---|---|---|---|---|---|---|---|---|---|---|---|---|---|---|---|---|---|---|---|---|---|
| Variable | HR | 95% CI | P | HR | 95% CI | P | |||||||||||||||||||||||||||||||||||||||||||||||||||||||||||||||||||||||||||||||||||||||||||||
| Overall DLBCL | |||||||||||||||||||||||||||||||||||||||||||||||||||||||||||||||||||||||||||||||||||||||||||||||||||
| IPI >2 | 3.08 | 2.21-4.38 | < .0001 | 2.84 | 2.08-3.89 | < .0001 | |||||||||||||||||||||||||||||||||||||||||||||||||||||||||||||||||||||||||||||||||||||||||||||
| p63+ | .62 | .45-.87 | .006 | .66 | .48-.90 | .009 | |||||||||||||||||||||||||||||||||||||||||||||||||||||||||||||||||||||||||||||||||||||||||||||
| Female sex | .86 | .62-1.20 | .37 | .92 | .67-1.26 | .60 | |||||||||||||||||||||||||||||||||||||||||||||||||||||||||||||||||||||||||||||||||||||||||||||
| Tumor size ≥5 cm | 1.30 | .94-1.79 | .11 | 1.26 | .93-1.70 | .14 | |||||||||||||||||||||||||||||||||||||||||||||||||||||||||||||||||||||||||||||||||||||||||||||
| B symptoms present | 1.32 | .95-1.85 | .10 | 1.24 | .90-1.71 | .18 | |||||||||||||||||||||||||||||||||||||||||||||||||||||||||||||||||||||||||||||||||||||||||||||
| GCB-DLBCL | |||||||||||||||||||||||||||||||||||||||||||||||||||||||||||||||||||||||||||||||||||||||||||||||||||
| IPI >2 | 4.00 | 2.36-6.79 | < .0001 | 3.44 | 2.27-5.21 | < .0001 | |||||||||||||||||||||||||||||||||||||||||||||||||||||||||||||||||||||||||||||||||||||||||||||
| p63+ | .64 | .41-.99 | .045 | .67 | .42-1.09 | .11 | |||||||||||||||||||||||||||||||||||||||||||||||||||||||||||||||||||||||||||||||||||||||||||||
| Female sex | .94 | .61-1.45 | .78 | 1.00 | .67-1.50 | .99 | |||||||||||||||||||||||||||||||||||||||||||||||||||||||||||||||||||||||||||||||||||||||||||||
| Tumor size ≥5 cm | 1.53 | .92-2.54 | .10 | 1.46 | .92-2.34 | .11 | |||||||||||||||||||||||||||||||||||||||||||||||||||||||||||||||||||||||||||||||||||||||||||||
| B symptoms present | 1.08 | .69-1.70 | .74 | 1.21 | .74-1.98 | .44 | |||||||||||||||||||||||||||||||||||||||||||||||||||||||||||||||||||||||||||||||||||||||||||||
| ABC-DLBCL | |||||||||||||||||||||||||||||||||||||||||||||||||||||||||||||||||||||||||||||||||||||||||||||||||||
| IPI >2 | 2.35 | 1.61-3.43 | < .0001 | 2.23 | 1.57-3.16 | < .0001 | |||||||||||||||||||||||||||||||||||||||||||||||||||||||||||||||||||||||||||||||||||||||||||||
| p63+ | .56 | .38-.83 | .004 | .58 | .40-.83 | .003 | |||||||||||||||||||||||||||||||||||||||||||||||||||||||||||||||||||||||||||||||||||||||||||||
| Female sex | .77 | .52-1.15 | .20 | .78 | .54-1.12 | .17 | |||||||||||||||||||||||||||||||||||||||||||||||||||||||||||||||||||||||||||||||||||||||||||||
| Tumor size ≥5 cm | 1.03 | .58-1.56 | .88 | .99 | .66-1.47 | .94 | |||||||||||||||||||||||||||||||||||||||||||||||||||||||||||||||||||||||||||||||||||||||||||||
| B symptoms present | 1.06 | .72-1.58 | .76 | 1.14 | .79-1.64 | .49 | |||||||||||||||||||||||||||||||||||||||||||||||||||||||||||||||||||||||||||||||||||||||||||||
| DLBCL with WT-TP53 | |||||||||||||||||||||||||||||||||||||||||||||||||||||||||||||||||||||||||||||||||||||||||||||||||||
| IPI >2 | 3.29 | 2.21-4.88 | < .0001 | 3.21 | 2.18-4.72 | < .0001 | |||||||||||||||||||||||||||||||||||||||||||||||||||||||||||||||||||||||||||||||||||||||||||||
| p63+ | .61 | .40-.91 | .015 | .63 | .43-.92 | .016 | |||||||||||||||||||||||||||||||||||||||||||||||||||||||||||||||||||||||||||||||||||||||||||||
| p53+ | .97 | .62-1.52 | .90 | .91 | .60-1.40 | .68 | |||||||||||||||||||||||||||||||||||||||||||||||||||||||||||||||||||||||||||||||||||||||||||||
| Female sex | .91 | .61-1.36 | .65 | .85 | .57-1.26 | .42 | |||||||||||||||||||||||||||||||||||||||||||||||||||||||||||||||||||||||||||||||||||||||||||||
| Tumor size ≥5 cm | 1.19 | .81-176 | .38 | 1.11 | .76-1.62 | .59 | |||||||||||||||||||||||||||||||||||||||||||||||||||||||||||||||||||||||||||||||||||||||||||||
| B symptoms present | 1.45 | .97-2.17 | .07 | 1.48 | 1.00-2.20 | .049 | |||||||||||||||||||||||||||||||||||||||||||||||||||||||||||||||||||||||||||||||||||||||||||||
| DLBCL with MUT-TP53 | |||||||||||||||||||||||||||||||||||||||||||||||||||||||||||||||||||||||||||||||||||||||||||||||||||
| IPI >2 | 2.43 | 1.17-5.05 | .017 | 2.11 | 1.07-4.18 | .032 | |||||||||||||||||||||||||||||||||||||||||||||||||||||||||||||||||||||||||||||||||||||||||||||
| p63+ | .70 | .34-1.44 | .33 | .72 | .36-1.44 | .36 | |||||||||||||||||||||||||||||||||||||||||||||||||||||||||||||||||||||||||||||||||||||||||||||
| p53+ | 3.16 | 1.17-8.52 | .023 | 2.30 | .97-5.45 | .06 | |||||||||||||||||||||||||||||||||||||||||||||||||||||||||||||||||||||||||||||||||||||||||||||
| Female sex | 1.02 | .50-2.11 | .96 | 1.12 | .57-2.20 | .75 | |||||||||||||||||||||||||||||||||||||||||||||||||||||||||||||||||||||||||||||||||||||||||||||
| Tumor size ≥5 cm | 1.57 | .77-3.20 | .21 | 1.85 | .95-3.63 | .07 | |||||||||||||||||||||||||||||||||||||||||||||||||||||||||||||||||||||||||||||||||||||||||||||
| B symptoms present | 1.19 | .54-2.60 | .67 | 1.03 | .49-2.17 | .93 | |||||||||||||||||||||||||||||||||||||||||||||||||||||||||||||||||||||||||||||||||||||||||||||
| Abbreviations: DLBCL, diffuse large B-cell lymphoma; ABC, activated B-cell–like; OS, overall survival; PFS, progression-free survival; HR, hazard ratio; CI, confidence interval; IPI, International Prognostic Index. | |||||||||||||||||||||||||||||||||||||||||||||||||||||||||||||||||||||||||||||||||||||||||||||||||||
Validation set
Similar to the training set, no significant difference was observed in p63 expression between the GCB and ABC subtypes (P=0.68). These similar prognostic impacts as in the training set were all significant with a ≥5% cutoff value for p63 expression (P=0.02, P=0.047, and P=0.0007 for PFS in DLBCL, ABC-DLBCL and high-risk DLBCL respectively. Supplemental Fig S2). A multivariate survival analysis indicated that after adjusting clinical parameters, p63 expresssion ≥5% was an independent favorable prognostic factor in overall DLBCL and ABC-DLBCL but not in GCB-DLBCL (data not shown).
Relationships with TP53 mutations and p53 expression
Non-significant correlation with p53 expression and correlation with TP53 mRNA
By Spearman rank correlation TP63 mRNA showed correlation with TP53 mRNA levels in the overall DLBCL set (r=0.091, P=0.048) and WT-TP53 subset (r=0.106, P=0.044) but not in the MUT-TP53 subset. In contrast, p63 expression did not show significant correlation with overall p53 (r=0.071, P=0.132), WT-p53 (r=0.08, P=0.135), or MUT-p53 (r=0.072, P=0.481). Using unpaired t-tests, p63 expression did not correlate with p53 levels (Supplemental Fig S1C), but was associated with elevated TP53 mRNA levels (Fig 1H). Analysis in GCB/ABC DLBCL subsets with WT-p53 or MUT-p53 showed no significant correlations between p63 positivity and WT-p53/MUT-p53 expression levels (Table 1, Fig 4A, B). However, the WT-p53+ (≥20% [38]) compared with the WT-p53− DLBCL group had a significantly higher mean level of p63 protein (Fig 4C(b)) but not TP63 mRNA (Fig 4D).
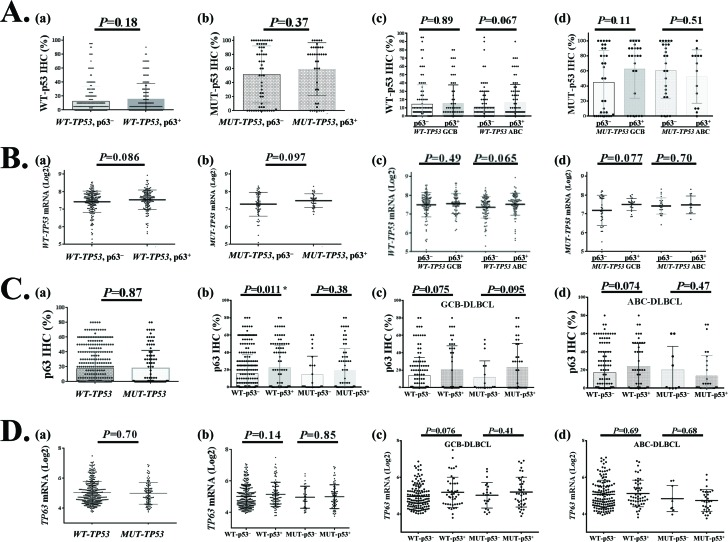
Figure 4. Relationship between TP63/p63 and TP53/p53 expression in DLBCL (A) Comparison of wild-type (WT) or mutated (MUT) p53 protein expression between p63+ and p63− patients with DLBCL or GCB/ABC subtypes of DLBCL. (B) Comparison of TP53 mRNA expression between p63+ and p63− patients with WT-TP53 or MUT-TP53 and GCB/ABC DLBCL. (C) Comparison of p63 protein expression between WT-TP53 and MUT-TP53 DLBCL, and between p53+ and p53− patients with DLBCL or GCB/ABC subtypes of DLBCL. (D) Comparison of TP63 mRNA expression between WT-TP53 and MUT-TP53 DLBCL, and between p53+ and p53− patients with DLBCL or GCB/ABC subtypes of DLBCL.
Prognostic impact of p63 expression in the presence of WT-TP53 or MUT-TP53
The clinicopathologic features of patients with p63+ or p63− DLBCL with WT-TP53 or MUT-TP53 are shown in Table 3. p63 expression was associated with significantly better OS and PFS in patients with WT-TP53 and IPI scores >2 (Fig 5A, B) and in ABC-DLBCL patients with WT-TP53 (Fig 5C, D), and favorable trends in patients with MUT-p53+ GCB-DLBCL (Fig 5G, H).
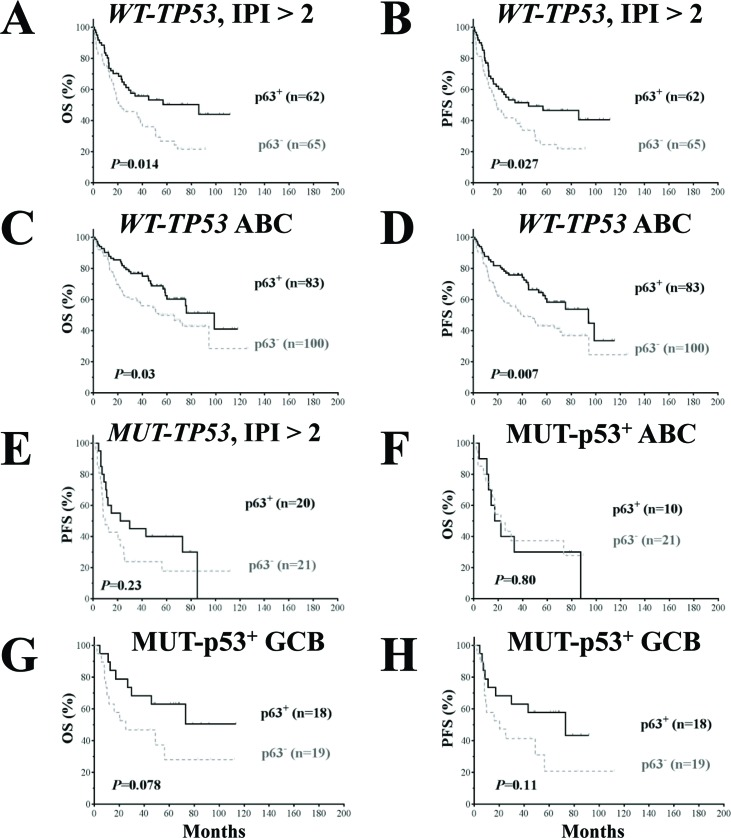
Figure 5. Prognostic analysis for p63 expression in DLBCL patients with wild- type and mutated TP53 (A-B) p63 expression correlated with significantly better survival outcomes in patients with high-risk (IPI > 2) DLBCL and WT-TP53. (C-D) p63 expression correlated with significantly better survival outcomes in patients with ABC-DLBCL and WT-TP53. (E) In patients with high-risk (IPI > 2) DLBCL and MUT-TP53, p63 expression did not correlate with survival outcomes although showed a trend toward better PFS. (F) p63 expression did not correlate with survival outcomes in patients with ABC-DLBCL and MUT-p53 overexpression. (G-H) p63 expression was associated with trends toward better survival outcomes in GCB-DLBCL patients with MUT-p53 overexpression (marginal P values).
Table 3. Clinical characteristics of DLBCL patients with wild-type TP53 (WT-TP53) or mutated TP53 (MUT-TP53)
| WT-TP53 | MUT-TP53 | ||||||||||||||||||||||||||||||||||||||||||||||||||||||||||||||||||||||||||||||||||||||||||||||||||
|---|---|---|---|---|---|---|---|---|---|---|---|---|---|---|---|---|---|---|---|---|---|---|---|---|---|---|---|---|---|---|---|---|---|---|---|---|---|---|---|---|---|---|---|---|---|---|---|---|---|---|---|---|---|---|---|---|---|---|---|---|---|---|---|---|---|---|---|---|---|---|---|---|---|---|---|---|---|---|---|---|---|---|---|---|---|---|---|---|---|---|---|---|---|---|---|---|---|---|---|
| p63+ | p63− | p63+ | p63− | ||||||||||||||||||||||||||||||||||||||||||||||||||||||||||||||||||||||||||||||||||||||||||||||||
| Characteristic | N (%) | N (%) | P | N (%) | N (%) | P | |||||||||||||||||||||||||||||||||||||||||||||||||||||||||||||||||||||||||||||||||||||||||||||
| Patients | 154 | 206 | 40 | 60 | |||||||||||||||||||||||||||||||||||||||||||||||||||||||||||||||||||||||||||||||||||||||||||||||
| Age (y) | |||||||||||||||||||||||||||||||||||||||||||||||||||||||||||||||||||||||||||||||||||||||||||||||||||
| < 60 | 62 (40) | 87 (42) | .75 | 16 (40) | 25 (42) | 1.0 | |||||||||||||||||||||||||||||||||||||||||||||||||||||||||||||||||||||||||||||||||||||||||||||
| ≥ 60 | 92 (60) | 119 (58) | 24 (60) | 35 (58) | |||||||||||||||||||||||||||||||||||||||||||||||||||||||||||||||||||||||||||||||||||||||||||||||
| Gender | |||||||||||||||||||||||||||||||||||||||||||||||||||||||||||||||||||||||||||||||||||||||||||||||||||
| Male | 106 (69) | 107 (52) | .0013 | 24 (60) | 36 (60) | 1.0 | |||||||||||||||||||||||||||||||||||||||||||||||||||||||||||||||||||||||||||||||||||||||||||||
| Female | 48 (31) | 99 (48) | 16 (40) | 24 (40) | |||||||||||||||||||||||||||||||||||||||||||||||||||||||||||||||||||||||||||||||||||||||||||||||
| Stage | |||||||||||||||||||||||||||||||||||||||||||||||||||||||||||||||||||||||||||||||||||||||||||||||||||
| I-II | 62 (42) | 97 (49) | .21 | 17 (43) | 28 (47) | .68 | |||||||||||||||||||||||||||||||||||||||||||||||||||||||||||||||||||||||||||||||||||||||||||||
| III-IV | 84 (58) | 100 (51) | 23 (58) | 32 (53) | |||||||||||||||||||||||||||||||||||||||||||||||||||||||||||||||||||||||||||||||||||||||||||||||
| B symptoms | |||||||||||||||||||||||||||||||||||||||||||||||||||||||||||||||||||||||||||||||||||||||||||||||||||
| No | 100 (67) | 196 (66) | .92 | 23 (59) | 38 (68) | .37 | |||||||||||||||||||||||||||||||||||||||||||||||||||||||||||||||||||||||||||||||||||||||||||||
| Yes | 50 (33) | 65 (34) | 16 (41) | 18 (32) | |||||||||||||||||||||||||||||||||||||||||||||||||||||||||||||||||||||||||||||||||||||||||||||||
| LDH | |||||||||||||||||||||||||||||||||||||||||||||||||||||||||||||||||||||||||||||||||||||||||||||||||||
| Normal | 58 (41) | 82 (44) | .66 | 12 (32) | 19 (33) | .93 | |||||||||||||||||||||||||||||||||||||||||||||||||||||||||||||||||||||||||||||||||||||||||||||
| Elevated | 82 (59) | 105 (56) | 25 (68) | 38 (67) | |||||||||||||||||||||||||||||||||||||||||||||||||||||||||||||||||||||||||||||||||||||||||||||||
| No. of extranodal sites | |||||||||||||||||||||||||||||||||||||||||||||||||||||||||||||||||||||||||||||||||||||||||||||||||||
| 0-1 | 105 (73) | 155 (78) | .30 | 29 (74) | 46 (78) | .68 | |||||||||||||||||||||||||||||||||||||||||||||||||||||||||||||||||||||||||||||||||||||||||||||
| ≥ 2 | 38 (27) | 43 (22) | 10 (26) | 13 (22) | |||||||||||||||||||||||||||||||||||||||||||||||||||||||||||||||||||||||||||||||||||||||||||||||
| Performance status | |||||||||||||||||||||||||||||||||||||||||||||||||||||||||||||||||||||||||||||||||||||||||||||||||||
| 0-1 | 117 (87) | 231 (85) | .62 | 30 (88) | 50 (86) | .78 | |||||||||||||||||||||||||||||||||||||||||||||||||||||||||||||||||||||||||||||||||||||||||||||
| ≥ 2 | 18 (13) | 28 (15) | 4 (12) | 8 (14) | |||||||||||||||||||||||||||||||||||||||||||||||||||||||||||||||||||||||||||||||||||||||||||||||
| Size of largest tumor | |||||||||||||||||||||||||||||||||||||||||||||||||||||||||||||||||||||||||||||||||||||||||||||||||||
| < 5cm | 81 (68) | 90 (58) | .079 | 18 (58) | 23 (48) | .38 | |||||||||||||||||||||||||||||||||||||||||||||||||||||||||||||||||||||||||||||||||||||||||||||
| ≥ 5cm | 38 (32) | 66 (42) | 13 (42) | 25 (52) | |||||||||||||||||||||||||||||||||||||||||||||||||||||||||||||||||||||||||||||||||||||||||||||||
| IPI risk group | |||||||||||||||||||||||||||||||||||||||||||||||||||||||||||||||||||||||||||||||||||||||||||||||||||
| 0-2 | 87 (58) | 132 (67) | .10 | 19 (49) | 38 (64) | .12 | |||||||||||||||||||||||||||||||||||||||||||||||||||||||||||||||||||||||||||||||||||||||||||||
| 3-5 | 62 (42) | 65 (33) | 20 (51) | 21 (36) | |||||||||||||||||||||||||||||||||||||||||||||||||||||||||||||||||||||||||||||||||||||||||||||||
| Therapy response | |||||||||||||||||||||||||||||||||||||||||||||||||||||||||||||||||||||||||||||||||||||||||||||||||||
| CR | 126 (82) | 163 (79) | .59 | 27 (68) | 35 (58) | .40 | |||||||||||||||||||||||||||||||||||||||||||||||||||||||||||||||||||||||||||||||||||||||||||||
| PR | 16 | 24 | 7 | 13 | |||||||||||||||||||||||||||||||||||||||||||||||||||||||||||||||||||||||||||||||||||||||||||||||
| SD | 3 | 7 | 3 | 3 | |||||||||||||||||||||||||||||||||||||||||||||||||||||||||||||||||||||||||||||||||||||||||||||||
| PD | 9 | 12 | 3 | 9 | |||||||||||||||||||||||||||||||||||||||||||||||||||||||||||||||||||||||||||||||||||||||||||||||
| Ki-67 | |||||||||||||||||||||||||||||||||||||||||||||||||||||||||||||||||||||||||||||||||||||||||||||||||||
| < 70% | 50 (33) | 83 (41) | .10 | 9 (22) | 17 (29) | .64 | |||||||||||||||||||||||||||||||||||||||||||||||||||||||||||||||||||||||||||||||||||||||||||||
| ≥ 70% | 104 (67) | 119 (59) | 31 (78) | 42 (71) | |||||||||||||||||||||||||||||||||||||||||||||||||||||||||||||||||||||||||||||||||||||||||||||||
| Primary origin | |||||||||||||||||||||||||||||||||||||||||||||||||||||||||||||||||||||||||||||||||||||||||||||||||||
| Nodal | 91 (40) | 134 (66) | .21 | 25 (37) | 39 (70) | .54 | |||||||||||||||||||||||||||||||||||||||||||||||||||||||||||||||||||||||||||||||||||||||||||||
| Extranodal | 61 (60) | 68 (66) | 15 (63) | 17 (30) | |||||||||||||||||||||||||||||||||||||||||||||||||||||||||||||||||||||||||||||||||||||||||||||||
| DLBCL subtypes | |||||||||||||||||||||||||||||||||||||||||||||||||||||||||||||||||||||||||||||||||||||||||||||||||||
| GCB | 70 (46) | 105 (51) | .34 | 25 (62) | 34 (57) | .68 | |||||||||||||||||||||||||||||||||||||||||||||||||||||||||||||||||||||||||||||||||||||||||||||
| ABC | 83 (54) | 100 (49) | 15 (38) | 26 (43) | |||||||||||||||||||||||||||||||||||||||||||||||||||||||||||||||||||||||||||||||||||||||||||||||
| BCL6 translocation | |||||||||||||||||||||||||||||||||||||||||||||||||||||||||||||||||||||||||||||||||||||||||||||||||||
| – | 73 (63) | 97 (70) | .21 | 17(57) | 35 (85) | .007 | |||||||||||||||||||||||||||||||||||||||||||||||||||||||||||||||||||||||||||||||||||||||||||||
| + | 43 (37) | 41 (30) | 13(43) | 6 (15) | |||||||||||||||||||||||||||||||||||||||||||||||||||||||||||||||||||||||||||||||||||||||||||||||
| CD30 | |||||||||||||||||||||||||||||||||||||||||||||||||||||||||||||||||||||||||||||||||||||||||||||||||||
| − | 120 (78) | 178 (89) | .0085 | 32 (80) | 54 (92) | .13 | |||||||||||||||||||||||||||||||||||||||||||||||||||||||||||||||||||||||||||||||||||||||||||||
| + | 34 (22) | 23 (11) | 8 (20) | 5 (8.5) | |||||||||||||||||||||||||||||||||||||||||||||||||||||||||||||||||||||||||||||||||||||||||||||||
| p53 expression | |||||||||||||||||||||||||||||||||||||||||||||||||||||||||||||||||||||||||||||||||||||||||||||||||||
| < 20% | 106 (70) | 154 (77) | .18 | 10 (26) | 18 (31) | .65 | |||||||||||||||||||||||||||||||||||||||||||||||||||||||||||||||||||||||||||||||||||||||||||||
| ≥ 20% | 45 (30) | 47 (23) | 29 (74) | 40 (69) | |||||||||||||||||||||||||||||||||||||||||||||||||||||||||||||||||||||||||||||||||||||||||||||||
| Abbreviations: DLBCL, diffuse large B-cell lymphoma; R-CHOP, rituximab with cyclophosphamide, doxorubicin, vincristine, and prednisone; LDH, lactate dehydrogenase; IPI, international prognostic index; CR, complete remission; PR, partial response; SD, stable disease; PD, progressive disease; GCB, germinal center B-cell–like; ABC, activated B-cell–like. | |||||||||||||||||||||||||||||||||||||||||||||||||||||||||||||||||||||||||||||||||||||||||||||||||||
Multivariate survival analysis
We further performed multivariate survival analysis including p63 expression, p53 overexpression, and clinical parameters in the WT-TP53 and MUT-TP53 subsets individually. In the WT-TP53 subset, p63 expression but not WT-p53 overexpression remained as an independent prognostic factor for better OS and PFS; in the MUT-TP53 subset, MUT-p53 overexpression but not p63 expression was an independent prognostic factor for poorer PFS (borderline P value for OS) (Table 2).
Gene expression profiling signature of p63 expression
To gain insights into the potential molecular mechanisms underlying the prognostic observation, we performed a series of GEP analyses comparing p63+ and p63− patients in the overall DLBCL group and various subsets stratified by GCB/ABC subtype, TP53 mutation and p53 overexpression status (Fig 6A-H, Supplemental Fig S3A-D). Counts of significant differentially expressed genes (DEGs) between compared groups with different false discovery rate (FDR) thresholds are listed in Supplemental Table S1. Largely, whether p63 expression was associated with distinct GEP signatures did not correlated with whether p63 showed apparent prognostic effects, and the GEP signature of p63 expression in the MUT-TP53 subset was much more prominent (Fig 6B, Table 4) than that in the WT-TP53 subset (7 genes only with a FDR threshold of 0.30, figure not shown). However, after dividing the WT-TP53 subset into GCB and ABC subtypes of DLBCL patients, p63 expression showed GEP signatures, more distinctive in ABC than in GCB (Fig 6C, Supplemental Fig S3A), which was opposite to the pattern for overall ABC and GCB (only few DEGs in ABC compared to the distinct GEP signature in GCB, Supplemental Table S1). The p63 GEP signatures in the MUT-TP53 and WT-TP53 subsets had both similarity (upregulated ATP2A2 and downregulated ZNF652) and difference (three genes, GABBR2, PDHA1 and NFYB, showed opposite up- or down-regulation). Reinforcing the idea that p63 GEP signatures are more highlighted in the absence of WT-p53 activities as shown in the MUT-TP53 subset, we further found that in WT-p53− ABC-DLBCL but not in WT-p53+ ABC-DLBCL, p63 expression was associated with significant DEGs (Supplemental Fig S3B, Supplemental Table S3).
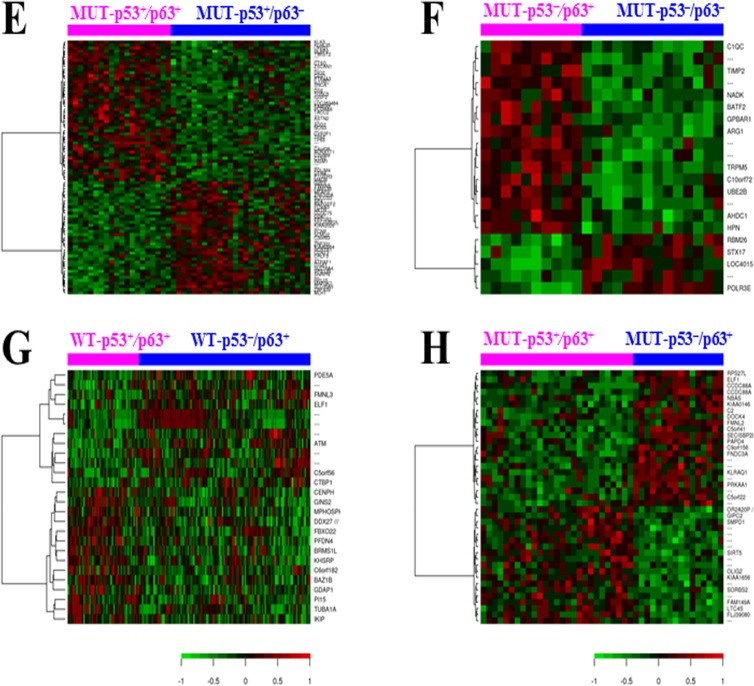
Figure 6. Gene expression profiling analysis (A) Heatmap for comparison between p63+ and p63− DLBCL patients (false discovery rate < 0.15). (B) Heatmap for comparison between p63+ and p63− DLBCL patients with MUT-TP53 (false discovery rate < 0.05, fold change >1.68). (C) Heatmap for comparison between p63+versus p63− patients with ABC-DLBCL and WT-TP53 (false discovery rate < 0.20). (D) Heatmap for comparison between p63+versus p63− patients with GCB-DLBCL (false discovery rate < 0.05). (E) Heatmap for comparison between p63+ and p63− DLBCL patients with MUT-p53 overexpression (false discovery rate < 0.15). (F) Heatmap for comparison between p63+ and p63− DLBCL patients with no or low (< 20%) expression levels of MUT-p53 (false discovery rate < 0.10). (G) Heatmap for comparison between WT-p53+ (≥ 20%) and WT-p53− (< 20%) DLBCL patients with p63 expression (false discovery rate < 0.30). (H) Heatmap for comparison between MUT-p53+ (≥ 20%) and MUT-p53− (< 20%) DLBCL patients with p63 expression (false discovery rate < 0.20).
Table 4. Genes differentially expressed between patients with p63+ and p63− DLBCL
| p63+ DLBCL FDR< 0.20 | p63+ DLBCL with MUT-TP53 FDR< 0.05, fold change > 1.68 | p63+ ABC-DLBCL with WT-TP53 FDR< 0.20 | |||||||||||||||||||||||||||||||||||||||||||||||||||||||||||||||||||||||||||||||||||||||||||||||||
|---|---|---|---|---|---|---|---|---|---|---|---|---|---|---|---|---|---|---|---|---|---|---|---|---|---|---|---|---|---|---|---|---|---|---|---|---|---|---|---|---|---|---|---|---|---|---|---|---|---|---|---|---|---|---|---|---|---|---|---|---|---|---|---|---|---|---|---|---|---|---|---|---|---|---|---|---|---|---|---|---|---|---|---|---|---|---|---|---|---|---|---|---|---|---|---|---|---|---|---|
| Function categories | Upregulated | Downregulated | Upregulated | Downregulated | Upregulated | Downregulated | |||||||||||||||||||||||||||||||||||||||||||||||||||||||||||||||||||||||||||||||||||||||||||||
| Signaling, immune response, inflammation | FLJ23834, TRAF1 | SGPP1 | FOXD1, PDE7A | GABRR2, MS4A2, COMMD5 | |||||||||||||||||||||||||||||||||||||||||||||||||||||||||||||||||||||||||||||||||||||||||||||||
| Development, differentiation | SOX4, FOXC1 | ZNF141, BACH2 | SOX4, EPHA4 | ||||||||||||||||||||||||||||||||||||||||||||||||||||||||||||||||||||||||||||||||||||||||||||||||
| Cell growth and proliferation, gene expression, metabolism | H2AFB1/2/3 | MSI2, TBC1D1, ZNF652, TOR1AIP1, ZMYM2 | STRBP, CDC2L5, DDX18, MSI2, ZNF439, ZNF91, ZNF226, MTMR2 | MEF2C, DCN, KDM2B, RPS15, NFYB, DDX3Y, FOXD1,UTY | CCND2 | ||||||||||||||||||||||||||||||||||||||||||||||||||||||||||||||||||||||||||||||||||||||||||||||
| Apoptosis, cell death, DNA damage response | TP63, BCL2L1, ZAK, RFFL, ATG4B, MKL1, HIPK2 | C13orf15 | TP63 | TP63, MKL1 | |||||||||||||||||||||||||||||||||||||||||||||||||||||||||||||||||||||||||||||||||||||||||||||||
| Protein folding, protein translocation, heat shock | PPIL6 | HSF2, SEC62 | |||||||||||||||||||||||||||||||||||||||||||||||||||||||||||||||||||||||||||||||||||||||||||||||||
| Transport, mobility, cell adhesion | KCNMA1, ATP2B1, KIF21A, ANKH, TRPM4 | VAMP1 | ITGB1, CXCR4 | ECM2, RHOBTB3 | |||||||||||||||||||||||||||||||||||||||||||||||||||||||||||||||||||||||||||||||||||||||||||||||
| IncRNA and other unknown function | COBLL1, NCRNA00173 | C17orf58, C8orf6 | SETD5, SLMO2 | DNAJC5B, TMEM57, ANUBL1, IQCK | C10orf53 | ||||||||||||||||||||||||||||||||||||||||||||||||||||||||||||||||||||||||||||||||||||||||||||||
| Abbreviations: DLBCL, diffuse large B-cell lymphoma; FDR, false discovery rate; IncRNA, long noncoding RNA. | |||||||||||||||||||||||||||||||||||||||||||||||||||||||||||||||||||||||||||||||||||||||||||||||||||
To gain insights into the functional relationship between p53 and p63, we further analyzed the overlap and difference between the p53 [37, 38] and p63 GEP signatures. The results (Table 5) suggest p63 expression had a WT-p53-like GEP signature either in the context of WT-TP53 (such as CTAG2, SOX4 and ELL2, accounting for approximately 21% of the DEGs between WT-TP53/p63+ and WT-TP53/p63−) or MUT-TP53 (such as DSE, ATM, CDK13, CD47, ELF1, DYRK1A [45], PFDN4, and TMEM97, accounting for approximately 4% of the DEGs between MUT-TP53/p63+ and MUT-TP53/p63−), yet remained some MUT-p53-like GEP signature mainly in the context of MUT-TP53 (such as CAMTA1 resembling the MUT-p53 GEP signature, and ABHD11, KCNN3, MART3, and MRPL30 opposite to the WT-p53 GEP signature; accounting for approximately 1.4% of the DEGs between MUT-TP53/p63+ and MUT-TP53/p63−). Moreover, only in the p63+ but not in the p63− subset, expression of WT-p53 or MUT-p53 was associated with distinct GEP signatures (Fig 6G, H), which may suggest that p63 is important for p53 activities.
Table 5. Lists of differentially expressed genes between p63+ and p63− DLBCL that are also in the p53 signatures and MDM2 signatures
| Common genes shared by the p63+ and p53+ signatures | ||||
| WT-TP53 WT-p53+vs WT-p53− | MUT-TP53 MUT-p53+vs WT-p53−MUT-TP53 vs WT-TP53 | |||
| Same | Same | |||
| Up ↑ | DSE | ↑ in MUT-TP53/p63+vs MUT-TP53/p63− ↑ in MUT-p53+/p63+vs MUT-p53+/p63− | BCAS1 | ↑in p63+ GCB vs p63− GCB |
| ELL2 | ↑ in WT-TP53/p63+vs WT-TP53/p63− | |||
| FDXR | ↑ in WT-p53−/p63+ ABC vs WT-p53−/p63− ABC | |||
| GRRP1 | ↑ in MUT-TP53/p63+vs MUT-TP53/p63− | |||
| HPGD | ↑ in MUT-TP53/p63+vs MUT-TP53/p63− | |||
| PFDN4 | ↑ in MUT-TP53/p63+vs MUT-TP53/p63− | |||
| SOX4 | ↑ in p63+ vs p63− ↑ in WT-TP53/p63+vs WT-TP53/p63− ↑in WT-p53−/p63+ ABC vs WT-p53−/p63− ABC | |||
| Down↓ | ATM | ↓ in MUT-TP53/p63+vs MUT-TP53/p63− | CAMTA1 | ↓ in MUT-TP53/p63+vs MUT-TP53/p63− ↓ in MUT-TP53/p63+ GCB vs MUT-TP53/p63− GCB |
| C3orf63 | ↓ in MUT-p53+/p63+vs MUT-p53+/p63− | |||
| CCDC69 | ↓ in p63+ GCB vs p63− GCB | |||
| CD47 | ↓ in MUT-p53+/p63+vs MUT-p53+/p63− | |||
| CDC2L5/CDK13 | ↓ in MUT-TP53/p63+vs MUT-TP53/p63− ↓ in MUT-TP53/p63+ GCB vs MUT-TP53/p63− GCB | |||
| DCLRE1C | ↓ in MUT-TP53/p63+vs MUT-TP53/p63− ↓ in MUT-TP53/p63+ GCB vs MUT-TP53/p63− GCB | |||
| DYRK1A | ↓ in MUT-TP53/p63+vs MUT-TP53/p63− | |||
| ELF1 | ↓ in MUT-TP53/p63+vs MUT-TP53/p63− ↓ in MUT-TP53/p63+ GCB vs MUT-TP53/p63− GCB ↓ in p63+ GCB vs p63− GCB | |||
| ESR2 | ↓ in p63+ GCB vs p63− GCB | |||
| HCG18 | ↓ in WT-TP53/p63+vs WT-TP53/p63− | |||
| HERC4 | ↓ in MUT-TP53/p63+vs MUT-TP53/p63− ↓ in MUT-TP53/p63+ GCB vs MUT-TP53/p63− GCB | |||
| ITCH | ↓ in MUT-TP53/p63+vs MUT-TP53/p63− | |||
| LOC645513 | ↓ in MUT-TP53/p63+vs MUT-TP53/p63− | |||
| ORC4L | ↓ in MUT-TP53/p63+vs MUT-TP53/p63− | |||
| PPP1R2 | ↓ in MUT-TP53/p63+vs MUT-TP53/p63− | |||
| TBC1D1 | ↓ in p63+ vs p63−↓ in p63+ GCB vs p63− GCB | |||
| PXK | ↓ in p63+ GCB vs p63− GCB | |||
| TMCC1 | ↓ in MUT-TP53/p63+ ABC vs MUT-TP53/p63− ABC | |||
| ZCCHC7 | ↓ in MUT-TP53/p63+vs MUT-TP53/p63− | |||
| ZNF221 | ↓ in WT-p53−/p63+ ABC vs WT-p53−/p63− ABC | |||
| Opposite | Opposite | |||
| Up ↑ | KCNN3 | ↓ in p63+ GCB vs p63− GCB | CTAG2 | ↓ in WT-p53−/p63+ ABC vs WT-p53−/p63− ABC |
| KIAA0564 | ↓ in MUT-TP53/p63+vs MUT-TP53/p63− ↓ in MUT-p53+/p63+vs MUT-p53+/p63− | TMEM97 | ↓ in MUT-TP53/p63+vs MUT-TP53/p63− | |
| MATR3 | ↓ in MUT-TP53/p63+vs MUT-TP53/p63− | SLC16A1 | ↓ in p63+ GCB vs p63− GCB | |
| MRPL30 | ↓ in MUT-TP53/p63+vs MUT-TP53/p63− | |||
| Down↓ | ABHD11 | ↑in MUT-TP53/p63+ ABC vs MUT-TP53/p63− ABC | ||
| Common genes shared by the p63+ and MDM2+ signatures | ||||
| WT-TP53 MDM2+vs MDM2− | MUT-TP53 MDM2+vs MDM2− | |||
| Same | Same | |||
| Up ↑ | FAM83A | ↑ in MUT-TP53/p63+ ABC vs MUT-TP53/p63− ABC | ||
| FDXR | ↑in WT-p53−/p63+ ABC vs WT-p53−/p63− ABC | |||
| MICAL2 | ↑in MUT-TP53/p63+ GCB vs MUT-TP53/p63− GCB | |||
| PCBP3 | ↑in MUT-TP53/p63+vs MUT-TP53/p63− | |||
| TCEB3 | ↑Rin p63+ vs p63− | |||
| Down↓ | ATM | ↓ in MUT-TP53/p63+vs MUT-TP53/p63− | ||
| BPTF | ↓ in MUT-TP53/p63+vs MUT-TP53/p63− ↓ in p63+ GCB vs p63− GCB | ATG7 | ↓ in p63+ GCB vs p63− GCB | |
| BRWD1 | ↓ in p63+ GCB vs p63− GCB | ATP5C1 | ↓ in MUT-TP53/p63+vs MUT-TP53/p63− ↓ in MUT-TP53/p63+ GCB vs MUT-TP53/p63− GCB | |
| CD22 | ↓ in p63+ GCB vs p63− GCB | EIF2A | ↓ in MUT-TP53/p63+vs MUT-TP53/p63− | |
| DHX36 | ↓ in MUT-TP53/p63+vs MUT-TP53/p63− | PAK2 | ↓ in MUT-TP53/p63+vs MUT-TP53/p63− | |
| EIF2A | ↓ in MUT-TP53/p63+vs MUT-TP53/p63− | PRICKLE4/TOMM6 | ↓ in MUT-TP53/p63+ ABC vs MUT-TP53/p63− ABC | |
| NKTR | ↓ in MUT-TP53/p63+vs MUT-TP53/p63− ↓ in MUT-p53+/p63+vs MUT-p53+/p63− ↓ in MUT-TP53/p63+ GCB vs MUT-TP53/p63− GCB | |||
| RBM26 | ↓ in MUT-TP53/p63+vs MUT-TP53/p63− ↓ in MUT-p53−/p63+vs MUT-p53−/p63− | |||
| RPL34 | ↓ in MUT-TP53/p63+vs MUT-TP53/p63− | |||
| SLC35F5 | ↓ in MUT-TP53/p63+vs MUT-TP53/p63− | |||
| WT-TP53 MDM2+vs MUT-TP53 MDM2+ | ||||
| Same | ||||
| Down↓ | LPP | ↓ in p63+ GCB vs p63− GCB | ||
We also compared the p63 GEP signature with the MDM2 GEP signature [38], and found 21 DEGs were common between the GEP signatures of p63 and MDM2 expression, among which 16 DEGs were not shared by the p53 GEP signature (Table 5).
Although the p53 and p63 GEP signatures overlapped, majority of the DEGs were not shared. Nonetheless, a p53-like tumor suppressor role of p63 was suggested by the p63 GEP signatures, including downregulation of CCND2 (in WT-TP53/p63+ ABC-DLBCL), CDC27 and MYCT1 (in WT-TP53/p63+ GCB-DLBCL), CDC2L5/CDK13 and CXCR4 (in MUT-TP53/p63+ DLBCL. TP53 mutations were associated with increased CXCR4 levels especially in GCB- DLBCL as previously reported [46]), ELF1 which encodes a transcription factor that activates LYN and BLK (in MUT-TP53/p63+ GCB-DLBCL), MYBL1 and STRBP which play roles in proliferation and growth (in MUT-TP53/p63+ GCB-DLBCL), antiapoptotic C9orf82 and BCOR (which encodes an interacting corepressor of BCL6 required for germinal center formation and may influence apoptosis) (in MUT-TP53/p63+ ABC-DLBCL), as well as upregulation of HIPK2 (which promotes apoptosis through the activation of p53/TP53) (in p63+ DLBCL) and WWOX (which functions synergistically with p53/TP53 to control genotoxic stress-induced cell death) (in MUT-TP53/p63+ ABC-DLBCL) (Supplemental Fig S3C-D).
On the other hand, some DEGs promoting tumor cell survival were also shown in the comparison between overall p63+ and p63− DLBCL patients, which may be due to the oncogenic function provided by MUT-p53 or p63 isoforms in the p63+ DLBCL subsets. For example, antiapoptotic BCL2L1, RFFL (which negatively regulates p53, CASP8 and CASP10 through proteasomal degradation), ATG4B (required for autophagy), and MKL1 (which suppresses TNF-induced cell death by inhibiting caspase activation) were up-regulated in p63+ DLBCL compared with p63− DLBCL, whereas C13orf15/RGCC (in response to DNA damage) was downregulated in p63+ DLBCL patients (Table 4). Cytokine/receptor genes IL17RC, IL4, IL4I1 and IL8RB/CXCR2 which have been associated with poorer prognosis in cancers, were upregulated in MUT-TP53/p63+ compared with MUT-TP53/p63− DLBCL (Supplemental Table S2); MLL2 was upregulated in p63+ patients with ABC-DLBCL and MUT-TP53 (Supplemental Fig S3D).
Discussion
Abnormal p63 expression patterns instead of TP63 mutations have been found to be important for tumorigenesis [5]. Little data are available with conflicting results regarding p63 expression and its prognostic role [27, 39, 43]. We found that p63 expression correlated with a superior survival in ABC-DLBCL with WT-TP53 and in high-risk (IPI >2) DLBCL (regardless GCB or ABC), which is consistent with a previous study in high-intermediate and high risk DLBCL [27]. The association of p63 expression with high-risk IPI in GCB-DLBCL, and thus affecting its apparent prognostic effects in GCB and overall DLBCL, may contribute to the inconsistent findings from previous studies.
The prognostic effect of p63 expression suggests that p63 has a tumor suppressor role for DLBCL, although its protective effect can be antagonized or abolished by TP53 mutations and high-risk DLBCL associated biology. In our cohort, p63 expression was associated with increased levels of IRF4/MUM-1, p21, MDM2, and p16-INK4a resembling that of WT-p53 yet independent of p53 mutation status. GEP analysis showed that compared to the prominent p63 GEP signature within the MUT-TP53 subset, the comparison between p63+ and p63− patients with WT-TP53 had much fewer DEGs; DEGs were shown within the WT-p53− but not WT-p53+ ABC-DLBCL subset. These results may suggest that the tumor suppressor function of p63 may overlap with (and is probably weaker than) that of WT-p53, and when TP53 was mutated, p63 functions as a supplemental tumor suppressor alternative to WT-p53. However, MUT-p53 function remained or dominated p63 function in certain MUT-TP53 cases (Table 5), likely due to the significantly higher levels of MUT-p53 than p63 [47]. In addition to the GEP results as above, p63 expression correlated with MDM2 upregulation and BCL2 and MDM4 downregulation (P=0.0174, P=0.0487 and P=0.090 respectively) resembling WT-p53 expression GEP signature (although the FDRs for the comparison between p63+ and p63− DLBCL were higher). In contrast, CDKN1A/p21, MCL1, B2M, and FYB showed great variation even opposite up/down regulation between the WT-p53+ and the p63+ GEP signature. These phenomena may be explained by the remained MUT-p53-like function in the MUT-TP53/p63+ cases, whereas TP63 mutations and expression of different p63 isoforms may not be significant factors as suggested by the previous studies [5, 25, 43] and our preliminary data of TP63 mutations in DLBCL (unpublished data).
These observations in DLBCL may support previous functional studies, which showed that TAp63α and TAp63γ (but not ΔNp63) could induce apoptosis at lesser levels than WT-p53 [48]; TAp63, and also TAp73, together with p53, may transactivate a group of common target genes in response to DNA damage, including damage resulting from exposure to doxorubicin, a component of R-CHOP;1 TAp63 and MUT-p53 antagonize each other mainly in the regulation of metastasis and tumor dissemination [5]; p53 mutants may bind directly to p63 and inhibit the p63-mediated transcription of p53 target genes [49, 50]. Strategies to overcome MUT-p53 interaction with p63, decrease MUT-p53 levels and enhance p63 levels may have therapeutic value [47]. On the other hand, in mouse embryonic fibroblasts, p63 and p73 are required for p53-dependent apoptosis in response to DNA damage [7]. This may explain why our GEP comparisons between p53+ and p53− DLBCL showed DEGs within the p63+ but not p63− subset. Moreover, our data suggested that p63 act together with p53 in some essential pathways yet also function independently in many processes such as development, immune response and chemokinesis. Large variations between p63 signatures in the overall DLBCL patient population and in the GCB and ABC subsets may also imply a wide range of p63 activities. These characteristics of p63 function compared with p53, as well as association with high Ki-67 (consistent with previous studies [21, 43]) and high IPI may explain the limitation of p63's apparent prognostic effect in DLBCL.
It is also possible that the correlation between p63 expression and better survival outcomes may be also influenced by the escape from MDM2-mediated degradation. In our cohort, the p63's protective effects on patient survival were independent of MDM2 expression, yet GEP signatures were only shown in MDM2low but not in MDM2high subsets (data not shown), suggesting that MDM2 may suppress p63 function but the suppression is not significant to the p63's protective effect. Conversely, p63 may have confounded the MDM2's prognostic effect in DLBCL just as that of WT-p53 [38], suggested by the common genes shared by the MDM2 and p63 GEP signatures (Table 5). Previous studies have suggested that p63 degradation is independent of MDM2 [24, 31] and that MDM2 increases the protein level and transcriptional activity of p63 [51]. The MDM2 inhibitor p14ARF directly interacts with and impairs p63 transcriptional activity [52]. On the other hand, it has also been shown that MDM2 transports p63 out of nucleus and inhibits its transcription function [53].
Yang et al. speculated that p63 expression in cancer cells was due to TP63 gene amplification by genomic instability [3], and other researches showed that p63 expression was regulated via mRNA stability [4, 19]. TP63 rearrangements have been reported in 1.2-5% of DLBCL (exclusive of GCB subtype) and also in 5.8% of peripheral T-cell lymphomas, which resulted in a truncated p63 protein lacking the TA domain [40, 41]. Our data showed the associations of p63 expression with BCL6 (mapped to 3q27) translocations, which appears to suggest the possibility of concurrent translocation of TP63 gene (mapped to 3q27-28) due to chromosomal proximity in p63+ DLBCL subsets. In these cases it is possible that expressed p63 had oncogenic function like ∆Np63, which may explain the oncogenic DEGs in the p63 GEP signatures, and the lack of p63's prognostic significance in GCB-DLBCL. In addition, genomic stress similar to that inducing p53 may also be the cause of p63 expression in subsets of p63+ DLBCL [54], since our data showed correlation between the WT-TP53 and TP63 mRNA levels, and both WT-p53 and p63 expression were associated with increased IRF4/MUM-1 and Ki-67 expression. Fig 7 illustrates these potential causes for p63 expression and possible relationships between p63 and WT-p53/MUT-p53 function. Understanding the mechanisms regulating TP63 may lead to therapeutic strategies. In DLBCL cell lines, FOXP1, directly represses TP63 and cooperate with NF-κB signaling to promote lymphoma cell survival [42]. Consistently, our GEP data also suggest that molecules related to B-cell receptor signaling may be potential targets which suppresses p63 expression, as in GCB-DLBCL and MUT-TP53/p63+ DLBCL, p63 expression was associated with downregulation of SYK and ELF1 respectively (suggesting decreased B-cell receptor signaling).
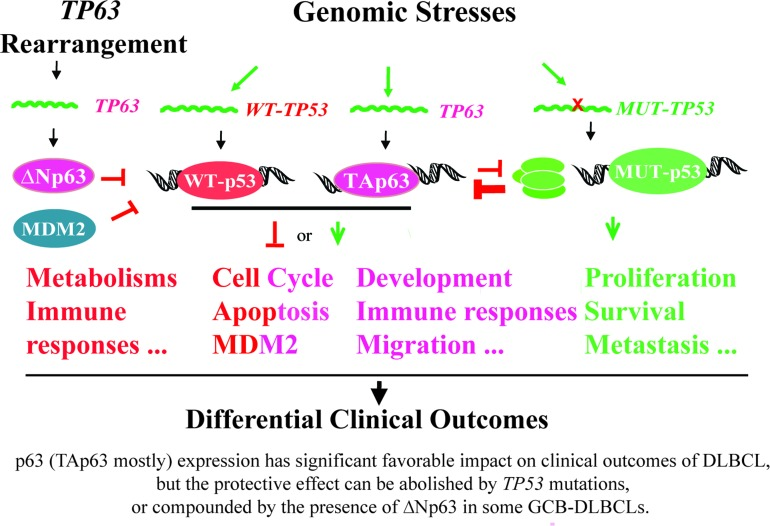
Figure 7. A hypothetical model illustrating the regulation and roles of p53 and p63 in DLBCL lymphomagenesis and clinical outcomes suggested by our clinical and biological data
In conclusion, we demonstrated the correlation of p63 expression and better survival outcomes in patients with high-risk DLBCL, ABC-DLBCL with WT-TP53, and biology associated with p63 expression supporting p63's tumor suppressor role in DLBCL. This study helps identify a subgroup of patients with better prognosis among patients who have ABC-DLBCL or high-risk DLBCL. Targeting p63 expression and function may be a novel therapeutic strategy for particular subgroups of DLBCL patients.
Materials and Methods
Patients
A total of 795 patients with de novo DLBCL from 20 medical centers treated with R-CHOP were studied, randomly divided into a training set (n=520) and a validation set (n=275). The diagnostic criteria, selection process, therapy, and treatment response have been described previously [37]. The study was approved as being of minimal or no risk or as exempt by the institution review boards of all participating medical centers.
Immunohistochemistry
Tissue microarrays prepared from the diagnostic formalin-fixed, paraffin-embedded (FFPE) tissue blocks of all patients studied were stained with an anti-p63 antibody (4A4, Santa Cruz Biotechnology, Santa Cruz, CA) which can detect all p63 isoforms. Expression levels of p63 were determined by estimating the percentage of p63-positive tumor cells in the tissue array cores. X-tile software and receiver operating characteristic curve analysis by GraphPad Prism 6 Software were used to determine the percentage of p63-positive cells with maximal discriminatory power for the separation of DLBCL patients into 2 different prognostic groups. Evaluation of other biomarkers by immunohistochemistry was also performed on tissue microarrays using corresponding antibodies: p53 (DO-7, Dako, Carpinteria, CA), MDM2 (IF2, Calbiochem, Billerica, MA), p21 (Dako), Bcl-2 (Clone-124, Dako, Carpinteria, CA), Ki-67 (Dako), CD30 (clone BerH2, Dako), Bcl-6 (Dako), FOXP1 (Abcam), IRF4/MUM1 (Dako), CD10 (56C6, Vantana), c-Rel (Dako), and CXCR4 (Abcam, San Francisco, CA). Details of immunohistochemistry procedures and scoring processes have been described previously [38, 44, 55–58].
TP53 and TP63 sequencing, fluorescence in situ hybridization
Genomic DNA samples were extracted from FFPE tissues, and the TP53 coding region and splice site sequence were determined for 460 patients in the training set using a p53 AmpliChip (Roche Molecular Systems, Pleasanton, CA) as described previously [37]. TP63 coding region sequence was analyzed by Sanger sequencing method. MYC, BCL2, BCL6, and REL gene arrangements and copy number aberrations were detected by fluorescence in situ hybridization [56, 59, 60].
Gene expression profiling
Gene expression profiling was performed on Affymetrix GeneChips HG-U133 Plus Version 2.0 (Affymetrix, Santa Clara, CA) using total RNAs as described previously [37, 55]. The CEL files are deposited in the National Center for Biotechnology Information Gene Expression Omnibus repository (GSE#31312). The microarray data were quantified and normalized by the frozen robust multiarray analysis (RMA) algorithm. The differentially expressed genes were identified by using multiple t-tests.
Statistical analysis
The clinical and pathologic features at the time of presentation were compared between various DLBCL subgroups by using the chi-square test and unpaired t test. Correlation between expression of different genes or proteins was evaluated by Spearman rank correlation. Overall survival (OS) was calculated from the date of diagnosis to the date of last follow-up or death. Progression-free survival (PFS) was calculated from the date of diagnosis to the date of disease progression or death. OS and PFS curves of the various groups were analyzed by GraphPad Prism 6 software using the Kaplan-Meier method, and differences were compared with use of the log-rank (Cox-Mantel) test. Multivariate analysis was conducted by using the Cox proportional hazards regression model with the SPSS software version 19.0 (IBM, Armonk, NY). Any difference with a P value of < 0.05 was considered statistically significant.
Supplementary Materials
Author Contributions
Contribution: Z.Y.X-M, S.Z., and K.H.Y designed and conducted the research and performed the statistical analysis; Z.Y.X-M, S.Z., X.L., G.C.M., X.W., Y.X., C.V., A.T., S.M.M., K.D., A.C., A.O., Y.Z., G.B., K.L.R., E.D.H., W.W.L.C., J.H.K., J.H., M.P., A.J.M.F., X.Z., M.B.M., F.B., B.M.P., M.A.P., J.N.W., L.J.M., and K.H.Y. contributed vital new reagents, resources, technology, and analytical tools; Z.Y.X-M, S.Z., C.V., A.T., S.M.M., K.D., A.C., A.O., Y.Z., G.B., K.L.R., E.D.H., W.W.L.C., J.H.K., J.H., M.P., A.J.M.F., X.Z., M.B.M., F.B., B.M.P., M.A.P., J.N.W., and K.H.Y. collected clinical and follow-up data under approval by the Institutional Review Boards and the material transfer agreement; Z.Y.X-M, S.Z., L.J.M., and K.H.Y. wrote and edited the manuscript; and all authors contributed vital strategies, participated in discussions, and provided scientific input.
Funding
This study was supported by the National Cancer Institute/National Institutes of Health (R01CA138688 and 1RC1CA146299 to K.H.Y). K.H.Y. is supported by The University of Texas MD Anderson Cancer Center Lymphoma Moonshot Program, Institutional Research and Development Fund, an Institutional Research Grant Award, an MD Anderson Cancer Center Lymphoma Specialized Programs on Research Excellence (SPORE) Research Development Program Award, an MD Anderson Cancer Center Myeloma SPORE Research Development Program Award, and partially supported by the National Cancer Institute/National Institutes of Health (P50CA136411 and P50CA142509). G.M. is supported by a grant from the Michael and Susan Dell Foundation. Z.Y.X-M is the recipient of the Shannon Timmins Leukemia Fellowship and the Harold C. and Mary L. Daily Endowment Fellowships Award at The University of Texas MD Anderson Cancer Center.
Conflicts of Interest
KHY receives research support from Roche Molecular System, Gilead Sciences Pharmaceutical, Seattle Genetics, Dai Sanyo Pharmaceutical, Adaptive Biotechnology, Incyte Pharmaceutical, and HTG Molecular Diagnostics.
References
- 1. Su X, Chakravarti D, Flores ER. p63 steps into the limelight: crucial roles in the suppression of tumorigenesis and metastasis. Nat Rev Cancer. 2013; 13: 136 -143. [PubMed] .
- 2. Yang A and McKeon F. P63 and P73: P53 mimics, menaces and more. Nat Rev Mol Cell Biol. 2000; 1: 199 -207. [PubMed] .
- 3. Yang A, Kaghad M, Wang Y, Gillett E, Fleming MD, Dotsch V, Andrews NC, Caput D, McKeon F. p63, a p53 homolog at 3q27-29, encodes multiple products with transactivating, death-inducing, and dominant-negative activities. Molecular cell. 1998; 2: 305 -316. [PubMed] .
- 4. Cho SJ, Jung YS, Chen X. Poly (C)-binding protein 1 regulates p63 expression through mRNA stability. PloS one. 2013; 8: e71724 [PubMed] .
- 5. Pflaum J, Schlosser S, Muller M. p53 Family and Cellular Stress Responses in Cancer. Front Oncol. 2014; 4: 285 [PubMed] .
- 6. Levine AJ, Tomasini R, McKeon FD, Mak TW, Melino G. The p53 family: guardians of maternal reproduction. Nat Rev Mol Cell Biol. 2011; 12: 259 -265. [PubMed] .
- 7. Flores ER, Tsai KY, Crowley D, Sengupta S, Yang A, McKeon F, Jacks T. p63 and p73 are required for p53-dependent apoptosis in response to DNA damage. Nature. 2002; 416: 560 -564. [PubMed] .
- 8. Venkatanarayan A, Raulji P, Norton W, Chakravarti D, Coarfa C, Su X, Sandur SK, Ramirez MS, Lee J, Kingsley CV, Sananikone EF, Rajapakshe K, Naff K, et al. IAPP-driven metabolic re rogramming induces regression of p53-deficient tumours in vivo. Nature. 2015; 517: 626 -630. [PubMed] .
- 9. Mills AA, Zheng B, Wang XJ, Vogel H, Roop DR, Bradley A. p63 is a p53 homologue required for limb and epidermal morphogenesis. Nature. 1999; 398: 708 -713. [PubMed] .
- 10. Suh EK, Yang A, Kettenbach A, Bamberger C, Michaelis AH, Zhu Z, Elvin JA, Bronson RT, Crum CP, McKeon F. p63 protects the female germ line during meiotic arrest. Nature. 2006; 444: 624 -628. [PubMed] .
- 11. Yang A, Schweitzer R, Sun D, Kaghad M, Walker N, Bronson RT, Tabin C, Sharpe A, Caput D, Crum C, McKeon F. p63 is essential for regenerative proliferation in limb, craniofacial and epithelial development. Nature. 1999; 398: 714 -718. [PubMed] .
- 12. Sun R, Zhang Y, Lv Q, Liu B, Jin M, Zhang W, He Q, Deng M, Liu X, Li G, Li Y, Zhou G, Xie P, et al. Toll-like receptor 3 (TLR3) induces apoptosis via death receptors and mitochondria by up-regulating the transactivating p63 isoform alpha (TAP63alpha). J Biol Chem. 2011; 286: 15918 -15928. [PubMed] .
- 13. Levrero M, De Laurenzi V, Costanzo A, Gong J, Wang JY, Melino G. The p53/p63/p73 family of transcription factors: overlapping and distinct functions. J Cell Sci. 2000; 113: 1661 -1670. [PubMed] .
- 14. Dohn M, Zhang S, Chen X. p63alpha and DeltaNp63alpha can induce cell cycle arrest and apoptosis and differentially regulate p53 target genes. Oncogene. 2001; 20: 3193 -3205. [PubMed] .
- 15. Perez-Losada J, Wu D, DelRosario R, Balmain A, Mao JH. p63 and p73 do not contribute to p53-mediated lymphoma suppressor activity in vivo. Oncogene. 2005; 24: 5521 -5524. [PubMed] .
- 16. Chakrabarti R, Wei Y, Hwang J, Hang X, Andres Blanco M, Choudhury A, Tiede B, Romano RA, DeCoste C, Mercatali L, Ibrahim T, Amadori D, Kannan N, et al. DeltaNp63 promotes stem cell activity in mammary gland development and basal-like breast cancer by enhancing Fzd7 expression and Wnt signalling. Nat Cell Biol. 2014; 16: 1004 -1015. 1001-1013 [PubMed] .
- 17. Su X, Chakravarti D, Cho MS, Liu L, Gi YJ, Lin YL, Leung ML, El-Naggar A, Creighton CJ, Suraokar MB, Wistuba I, Flores ER. TAp63 suppresses metastasis through coordinate regulation of Dicer and miRNAs. Nature. 2010; 467: 986 -990. [PubMed] .
- 18. Guo X, Keyes WM, Papazoglu C, Zuber J, Li W, Lowe SW, Vogel H, Mills AA. TAp63 induces senescence and suppresses tumorigenesis in vivo. Nat Cell Biol. 2009; 11: 1451 -1457. [PubMed] .
- 19. Xu E, Zhang J, Zhang M, Jiang Y, Cho SJ, Chen X. RNA-binding protein RBM24 regulates p63 expression via mRNA stability. Mol Cancer Res. 2014; 12: 359 -369. [PubMed] .
- 20. Truong AB, Kretz M, Ridky TW, Kimmel R, Khavari PA. p63 regulates proliferation and differentiation of developmentally mature keratinocytes. Genes Dev. 2006; 20: 3185 -3197. [PubMed] .
- 21. Hedvat CV, Teruya-Feldstein J, Puig P, Capodieci P, Dudas M, Pica N, Qin J, Cordon-Cardo C, Di Como CJ. Expression of p63 in diffuse large B-cell lymphoma. Appl Immunohistochem Mol Morphol. 2005; 13: 237 -242. https://doi.org/10.18632/oncotarget.3343 [PubMed] .
- 22. Danilova N, Sakamoto KM, Lin S. p53 family in development. Mech Dev. 2008; 125: 919 -931. [PubMed] .
- 23. Wolff S, Talos F, Palacios G, Beyer U, Dobbelstein M, Moll UM. The alpha/beta carboxy-terminal domains of p63 are required for skin and limb development. New insights from the Brdm2 mouse which is not a complete p63 knockout but expresses p63 gamma-like proteins. Cell Death Differ. 2009; 16: 1108 -1117. [PubMed] .
- 24. Okada Y, Osada M, Kurata S, Sato S, Aisaki K, Kageyama Y, Kihara K, Ikawa Y, Katoh I. p53 gene family p51(p63)-encoded, secondary transactivator p51B(TAp63alpha) occurs without forming an immunoprecipitable complex with MDM2, but responds to genotoxic stress by accumulation. Exp Cell Res. 2002; 276: 194 -200. [PubMed] .
- 25. Di Como CJ, Urist MJ, Babayan I, Drobnjak M, Hedvat CV, Teruya-Feldstein J, Pohar K, Hoos A, Cordon-Cardo C. p63 expression profiles in human normal and tumor tissues. Clin Cancer Res. 2002; 8: 494 -501. [PubMed] .
- 26. Nylander K, Vojtesek B, Nenutil R, Lindgren B, Roos G, Zhanxiang W, Sjostrom B, Dahlqvist A, Coates PJ. Differential expression of p63 isoforms in normal tissues and neoplastic cells. J Pathol. 2002; 198: 417 -427. [PubMed] .
- 27. Hallack Neto AE, Siqueira SA, Dulley FL, Ruiz MA, Chamone DA, Pereira J. p63 protein expression in high risk diffuse large B-cell lymphoma. J Clin Pathol. 2009; 62: 77 -79. [PubMed] .
- 28. Alexandrova EM and Moll UM. Role of p53 family members p73 and p63 in human hematological malignancies. Leuk Lymphoma. 2012; 53: 2116 -2129. [PubMed] .
- 29. Aubry MC, Roden A, Murphy SJ, Vasmatzis G, Johnson SH, Harris FR, Halling G, Knudson RA, Ketterling RP, Feldman AL. Chromosomal rearrangements and copy number abnormalities of TP63 correlate with p63 protein expression in lung adenocarcinoma. Mod Pathol. 2015; 28: 359 -366. [PubMed] .
- 30. Geddert H, Kiel S, Heep HJ, Gabbert HE, Sarbia M. The role of p63 and deltaNp63 (p40) protein expression and gene amplification in esophageal carcinogenesis. Hum Pathol. 2003; 34: 850 -856. [PubMed] .
- 31. Ying H, Chang DL, Zheng H, McKeon F, Xiao ZX. DNA-binding and transactivation activities are essential for TAp63 protein degradation. Mol Cell Biol. 2005; 25: 6154 -6164. [PubMed] .
- 32. Lo Muzio L, Santarelli A, Caltabiano R, Rubini C, Pieramici T, Trevisiol L, Carinci F, Leonardi R, De Lillo A, Lanzafame S, Bufo P, Piattelli A. p63 overexpression associates with poor prognosis in head and neck squamous cell carcinoma. Hum Pathol. 2005; 36: 187 -194. [PubMed] .
- 33. Stetsenko GY, Malekirad J, Paulson KG, Iyer JG, Thibodeau RM, Nagase K, Schmidt M, Storer BE, Argenyi ZB, Nghiem P. p63 expression in Merkel cell carcinoma predicts poorer survival yet may have limited clinical utility. Am J Clin Pathol. 2013; 140: 838 -844. [PubMed] .
- 34. Takahashi Y, Noguchi T, Takeno S, Kimura Y, Okubo M, Kawahara K. Reduced expression of p63 has prognostic implications for patients with esophageal squamous cell carcinoma. Oncol Rep. 2006; 15: 323 -328. [PubMed] .
- 35. Alizadeh AA, Eisen MB, Davis RE, Ma C, Lossos IS, Rosenwald A, Boldrick JC, Sabet H, Tran T, Yu X, Powell JI, Yang L, Marti GE, et al. Distinct types of diffuse large B-cell lymphoma identified by gene expression profiling. Nature. 2000; 403: 503 -511. [PubMed] .
- 36. Testoni M, Zucca E, Young KH, Bertoni F. Genetic lesions in diffuse large B-cell lymphomas. Ann Oncol. 2015; 26: 1069 -1080. [PubMed] .
- 37. Xu-Monette ZY, Wu L, Visco C, Tai YC, Tzankov A, Liu WM, Montes-Moreno S, Dybkaer K, Chiu A, Orazi A, Zu Y, Bhagat G, Richards KL, et al. Mutational profile and prognostic significance of TP53 in diffuse large B-cell lymphoma patients treated with R-CHOP: report from an International DLBCL Rituximab-CHOP Consortium Program Study. Blood. 2012; 120: 3986 -3996. [PubMed] .
- 38. Xu-Monette ZY, Moller MB, Tzankov A, Montes-Moreno S, Hu W, Manyam GC, Kristensen L, Fan L, Visco C, Dybkaer K, Chiu A, Tam W, Zu Y, et al. MDM2 phenotypic and genotypic profiling, respective to TP53 genetic status, in diffuse large B-cell lymphoma patients treated with rituximab-CHOP immunochemotherapy: a report from the International DLBCL Rituximab-CHOP Consortium Program. Blood. 2013; 122: 2630 -2640. [PubMed] .
- 39. Park CK and Oh YH. Expression of p63 in reactive hyperplasias and malignant lymphomas. J Korean Med Sci. 2005; 20: 752 -758. [PubMed] .
- 40. Vasmatzis G, Johnson SH, Knudson RA, Ketterling RP, Braggio E, Fonseca R, Viswanatha DS, Law ME, Kip NS, Ozsan N, Grebe SK, Frederick LA, Eckloff BW, et al. Genome-wide analysis reveals recurrent structural abnormalities of TP63 and other p53-related genes in peripheral T-cell lymphomas. Blood. 2012; 120: 2280 -2289. [PubMed] .
- 41. Scott DW, Mungall KL, Ben-Neriah S, Rogic S, Morin RD, Slack GW, Tan KL, Chan FC, Lim RS, Connors JM, Marra MA, Mungall AJ, Steidl C, et al. TBL1XR1/TP63: a novel recurrent gene fusion in B-cell non-Hodgkin lymphoma. Blood. 2012; 119: 4949 -4952. [PubMed] .
- 42. van Keimpema M, Gruneberg LJ, Mokry M, van Boxtel R, Koster J, Coffer PJ, Pals ST, Spaargaren M. FOXP1 directly represses transcription of proapoptotic genes and cooperates with NF-kappaB to promote survival of human B cells. Blood. 2014; 124: 3431 -3440. [PubMed] .
- 43. Fukushima N, Satoh T, Sueoka N, Sato A, Ide M, Hisatomi T, Kuwahara N, Tomimasu R, Tsuneyoshi N, Funai N, Sano M, Tokunaga O, Sueoka E. Clinico-pathological characteristics of p63 expression in B-cell lymphoma. Cancer Sci. 2006; 97: 1050 -1055. [PubMed] .
- 44. Hu S, Xu-Monette ZY, Tzankov A, Green T, Wu L, Balasubramanyam A, Liu WM, Visco C, Li Y, Miranda RN, Montes-Moreno S, Dybkaer K, Chiu A, et al. MYC/BCL2 protein coexpression contributes to the inferior survival of activated B-cell subtype of diffuse large B-cell lymphoma and demonstrates high-risk gene expression signatures: a report from The International DLBCL Rituximab-CHOP Consortium Program. Blood. 2013; 121: 4021 -4031. quiz 4250 [PubMed] .
- 45. Zhang Y, Liao JM, Zeng SX, Lu H. p53 downregulates Down syndrome-associated DYRK1A through miR-1246. EMBO reports. 2011; 12: 811 -817. [PubMed] .
- 46. Chen J, Xu-Monette ZY, Deng L, Shen Q, Manyam GC, Martinez-Lopez A, Zhang L, Montes-Moreno S, Visco C, Tzankov A, Yin L, Dybkaer K, Chiu A, et al. Dysregulated CXCR4 expression promotes lymphoma cell survival and independently predicts disease progression in germinal center B-cell-like diffuse large B-cell lymphoma. Oncotarget. 2015; 6: 5597 -5614. [PubMed] .
- 47. Li Y and Prives C. Are interactions with p63 and p73 involved in mutant p53 gain of oncogenic function? Oncogene. 2007; 26: 2220 -2225. [PubMed] .
- 48. Dietz S, Rother K, Bamberger C, Schmale H, Mossner J, Engeland K. Differential regulation of transcription and induction of programmed cell death by human p53-family members p63 and p73. FEBS Lett. 2002; 525: 93 -99. [PubMed] .
- 49. Gaiddon C, Lokshin M, Ahn J, Zhang T, Prives C. A subset of tumor-derived mutant forms of p53 down-regulate p63 and p73 through a direct interaction with the p53 core domain. Mol Cell Biol. 2001; 21: 1874 -1887. [PubMed] .
- 50. Strano S, Fontemaggi G, Costanzo A, Rizzo MG, Monti O, Baccarini A, Del Sal G, Levrero M, Sacchi A, Oren M, Blandino G. Physical interaction with human tumor-derived p53 mutants inhibits p63 activities. J Biol Chem. 2002; 277: 18817 -18826. [PubMed] .
- 51. Calabro V, Mansueto G, Parisi T, Vivo M, Calogero RA, La Mantia G. The human MDM2 oncoprotein increases the transcriptional activity and the protein level of the p53 homolog p63. J Biol Chem. 2002; 277: 2674 -2681. [PubMed] .
- 52. Calabro V, Mansueto G, Santoro R, Gentilella A, Pollice A, Ghioni P, Guerrini L, La Mantia G. Inhibition of p63 transcriptional activity by p14ARF: functional and physical link between human ARF tumor suppressor and a member of the p53 family. Mol Cell Bio. 2004; 24: 8529 -8540. [PubMed] .
- 53. Kadakia M, Slader C, Berberich SJ. Regulation of p63 function by Mdm2 and MdmX. DNA Cell Biol. 2001; 20: 321 -330. [PubMed] .
- 54. Gonfloni S, Di Tella L, Caldarola S, Cannata SM, Klinger FG, Di Bartolomeo C, Mattei M, Candi E, De Felici M, Melino G, Cesareni G. Inhibition of the c-Abl-TAp63 pathway protects mouse oocytes from chemotherapy-induced death. Nature medicine. 2009; 15: 1179 -1185. .
- 55. Visco C, Li Y, Xu-Monette ZY, Miranda RN, Green TM, Li Y, Tzankov A, Wen W, Liu WM, Kahl BS, d'Amore ES, Montes-Moreno S, Dybkaer K, et al. Comprehensive gene expression profiling and immunohistochemical studies support application of immunophenotypic algorithm for molecular subtype classification in diffuse large B-cell lymphoma: a report from the International DLBCL Rituximab-CHOP Consortium Program Study. Leukemia. 2012; 26: 2103 -2113. [PubMed] .
- 56. Tzankov A, Xu-Monette ZY, Gerhard M, Visco C, Dirnhofer S, Gisin N, Dybkaer K, Orazi A, Bhagat G, Richards KL, Hsi ED, Choi WW, van Krieken JH, et al. Rearrangements of MYC gene facilitate risk stratification in diffuse large B-cell lymphoma patients treated with rituximab-CHOP. Mod Pathol. 2014; 27: 958 -971. [PubMed] .
- 57. Ok CY, Chen J, Xu-Monette ZY, Tzankov A, Manyam GC, Li L, Visco C, Montes-Moreno S, Dybkaer K, Chiu A, Orazi A, Zu Y, Bhagat G, et al. Clinical Implications of Phosphorylated STAT3 Expression in De Novo Diffuse Large B-cell Lymphoma. Clin Cancer Res. 2014; 20: 5113 -5123. [PubMed] .
- 58. Hu S, Xu-Monette ZY, Balasubramanyam A, Manyam GC, Visco C, Tzankov A, Liu WM, Miranda RN, Zhang L, Montes-Moreno S, Dybkaer K, Chiu A, Orazi A, et al. CD30 expression defines a novel subgroup of diffuse large B-cell lymphoma with favorable prognosis and distinct gene expression signature: a report from the International DLBCL Rituximab-CHOP Consortium Program Study. Blood. 2013; 121: 2715 -2724. [PubMed] .
- 59. Visco C, Tzankov A, Xu-Monette ZY, Miranda RN, Tai YC, Li Y, Liu WM, d'Amore ES, Li Y, Montes-Moreno S, Dybkaer K, Chiu A, Orazi A, et al. Patients with diffuse large B-cell lymphoma of germinal center origin with BCL2 translocations have poor outcome, irrespective of MYC status: a report from an International DLBCL rituximab-CHOP Consortium Program Study. Haematologica. 2013; 98: 255 -263. [PubMed] .
- 60. Xu-Monette ZY, Dabaja BS, Wang X, Tu M, Manyam GC, Tzankov A, Xia Y, Zhang Li, Visco C, Dybkaer K, Yin L, Chiu A, Orazi A, et al. Clinical features, tumor biology and prognosis associated with MYC rearrangement and overexpression in diffuse large B-cell lymphoma patients treated with rituximab-CHOP. Modern Pathology. 2015; 28: 1555 -1573. [PubMed] .