


Introduction
DNA methylation-based biomarkers, often referred to as “epigenetic age” or "epigenetic clock", are robust estimators of chronological age of an individual [1–4]. For example, a measure of epigenetic age based on levels of methylation in 353 CpG dinucleotide markers (cytosine linked to guanine by a phosphate group) allow the estimation of the age of an individual. This estimate is consistent across most types of biological specimens, including whole blood, brain, breast, kidney, liver, lung, and saliva and cell types, including CD4+ T cells, monocytes, B cells, glial cells, and neurons [3].
Recent studies suggested that epigenetic age is associated with age-related health outcomes above and beyond chronological age. For example, we and others have shown that individuals whose epigenetic age was greater than their chronological age (i.e., individuals exhibiting epigenetic "age acceleration") were at an increased risk for death from all causes, even after accounting for known risk factors [5–7]. Further, we recently showed that the offspring of semi-supercentenarians (subjects who reached an age of 105-109 years) have a lower epigenetic age than age-matched controls [8]. Based on these findings, it has been hypothesized that epigenetic age captures some aspect of biological age and the resulting susceptibility to disease and multiple health outcomes. A first step in testing this hypothesis is to test whether epigenetic age predicts longevity in multiple populations and across ethnic groups.
In many studies epigenetic age is estimated from DNA derived from blood samples. It is well known that blood cell composition changes with age and some of these changes might be independent predictors of mortality [9–12]. Thus, it is of interest to understand whether considering information on blood cell composition in measures of epigenetic age improves their predictive power for mortality.
Here, we evaluated the ability to predict time to death for blood-based epigenetic age measures, both published and novel measures that incorporate information on blood cell composition. Due to the well documented age-related changes in blood cell composition, we distinguished epigenetic measures of age that were independent of changes in blood cell composition (cell-intrinsic measures), and measures that incorporated age-related changes in blood cell composition ("extrinsic" measures). By increasing the number of independent cohort studies, we more than doubled the number of mortality events available for analysis, which allowed for detailed subgroup analyses including those based on race/ethnicity.
Results
Cohort studies
Our meta-analysis included 13 population-based cohorts. An overview of the cohorts is provided in Table 1. Our study involved 3 racial/ethnic groups: non-Hispanic whites (n=9,215), Hispanics (n=431), and Blacks (n=3,443). Detailed descriptions of each cohort can be found in the Supplemental Materials.
Table 1. Baseline characteristics of participating cohorts.
| Cohorts | N | Ndeaths (%) | Follow-up duration (years), median (25th percentile, 75th percentile) | Age (years), median (25th percentile, 75th percentile) | rHorvath (p-value) † | rHannum (p-value) ‡ | |||||||||||||||||||||||||||||||||||||||||||||||||||||||||||||||||||||||||||||||||||||||||||||
| 1. WHI (White) | 995 | 309 (31%) | 15.4 (14.0-16.4) | 68 (65-72) | 0.67 (p=5.1x10-131) | 0.73 (p=8.0x10-167) | |||||||||||||||||||||||||||||||||||||||||||||||||||||||||||||||||||||||||||||||||||||||||||||
| 2. WHI (Black) | 675 | 176 (26%) | 15.4 (13.7-16.5) | 62 (57-67) | 0.70 (p=1.2x10-100) | 0.76 (p=3.0x10-128) | |||||||||||||||||||||||||||||||||||||||||||||||||||||||||||||||||||||||||||||||||||||||||||||
| 3. WHI (Hispanic) | 431 | 78 (18%) | 15.2 (14.1-16.3) | 61 (56-67) | 0.78 (p=8.9x10-90) | 0.79 (p=1.3x10-93) | |||||||||||||||||||||||||||||||||||||||||||||||||||||||||||||||||||||||||||||||||||||||||||||
| 4. LBC 1921 | 445 | 312 (70%) | 10.2 (6.2-12.9) | 79 (78-79) | 0.15 (p=1.5x10⁻³) | 0.13 (p=6.0x10⁻³) | |||||||||||||||||||||||||||||||||||||||||||||||||||||||||||||||||||||||||||||||||||||||||||||
| 5. LBC 1936 | 919 | 106 (12%) | 7.5 (6.9-8.4) | 69 (68-70) | 0.15 (p=4.9x10⁻⁶) | 0.16 (p=1.1x10⁻⁶) | |||||||||||||||||||||||||||||||||||||||||||||||||||||||||||||||||||||||||||||||||||||||||||||
| 6. NAS | 647 | 221 (34%) | 11.6 (8.6-12.9) | 72 (68-77) | 0.69 (p=1.3x10-92) | 0.76 (p=8.2x10-123) | |||||||||||||||||||||||||||||||||||||||||||||||||||||||||||||||||||||||||||||||||||||||||||||
| 7. ARIC (Black) | 2,768 | 1,075 (39%) | 20.3 (14.3-21.4) | 57 (52-62) | 0.65 (p<1x10-200) | 0.71 (p<1x10-200) | |||||||||||||||||||||||||||||||||||||||||||||||||||||||||||||||||||||||||||||||||||||||||||||
| 8. FHS | 2,614 | 236 (9%) | 6.2 (5.6-6.9) | 66 (60-73) | 0.84 (p<1x10-200) | 0.86 (p<1x10-200) | |||||||||||||||||||||||||||||||||||||||||||||||||||||||||||||||||||||||||||||||||||||||||||||
| 9. KORA | 1,257 | 42 (3%) | 4.4 (4.0-4.8) | 61 (54-68) | 0.84 (p<1x10-200) | 0.88 (p<1x10-200) | |||||||||||||||||||||||||||||||||||||||||||||||||||||||||||||||||||||||||||||||||||||||||||||
| 10. InCHIANTI | 506 | 91 (18%) | 15.0 (14.6-15.5) | 67 (57-73) | 0.82 (p=3.2x10-124) | 0.85 (p=2.1x10-142) | |||||||||||||||||||||||||||||||||||||||||||||||||||||||||||||||||||||||||||||||||||||||||||||
| 11. Rotterdam | 710 | 32 (5%) | 5.6 (5.3-5.8) | 58 (54-62) | 0.72 (p=1.9x10-114) | 0.76 (p=1.3x10-134) | |||||||||||||||||||||||||||||||||||||||||||||||||||||||||||||||||||||||||||||||||||||||||||||
| 12.Twins UK | 805 | 30 (4%) | 8.5 (7.5-8.5) | 58 (51-65) | 0.87 (p<1x10-200) | 0.89 (p<1x10-200) | |||||||||||||||||||||||||||||||||||||||||||||||||||||||||||||||||||||||||||||||||||||||||||||
| 13. BLSA (white) | 317 | 26 (8%) | 5.3 (4.0-6.6) | 66 (58-73) | 0.85 (p=1.1x10-89) | 0.88 (p=7.2x10-104) | |||||||||||||||||||||||||||||||||||||||||||||||||||||||||||||||||||||||||||||||||||||||||||||
| Total | 13,089 | 2734 (21%) | |||||||||||||||||||||||||||||||||||||||||||||||||||||||||||||||||||||||||||||||||||||||||||||||||
| The last 3 columns report robust correlation coefficients (biweight midcorrelation) between chronological age and two epigenetic age estimates (Horvath and Hannum). | |||||||||||||||||||||||||||||||||||||||||||||||||||||||||||||||||||||||||||||||||||||||||||||||||||
| † Biweight midcorrelation coefficient of chronological age with epigenetic age using the Horvath method. | |||||||||||||||||||||||||||||||||||||||||||||||||||||||||||||||||||||||||||||||||||||||||||||||||||
| ‡ Biweight midcorrelation coefficient of chronological age with epigenetic age using the Hannum method. | |||||||||||||||||||||||||||||||||||||||||||||||||||||||||||||||||||||||||||||||||||||||||||||||||||
Epigenetic age estimation
We used two methods for estimating the epigenetic age of each blood sample (Table 2). First, we used the approach by Horvath (2013) based on 353 CpGs, as described in [3] and Methods. Second, we used the approach by Hannum et al. (2013) based on 71 CpGs [2]. Both epigenetic age estimates were correlated with chronological age at the time of blood draw (Table 1) with biweight midcorrelation coefficients ranging from 0.65 to 0.89. But birth cohorts were excluded from this correlation analysis because it is not meaningful to calculate correlations with chronological age in this situation. The Horvath and Hannum estimates were also highly correlated with each other (r=0.76) even though the underlying sets of CpGs share only 6 CpGs in common. (Supplementary Table 1).
Table 2. Overview of various measures of epigenetic age acceleration.
| Measure of age acceleration | Short name of measure | Epigenetic age estimate | Uses blood counts | Correlation with blood counts | Conserved in breast tissue | ||||||||||||||||||||||||||||||||||||||||||||||||||||||||||||||||||||||||||||||||||||||||||||||
| (Universal) epigenetic age acceleration | AgeAccelHorvath (AgeAccel) | Horvath: 353 CpGs | no | weak | yes | ||||||||||||||||||||||||||||||||||||||||||||||||||||||||||||||||||||||||||||||||||||||||||||||
| Intrinsic epigenetic age acceleration (Horvath) | IEAA.Horvath (IEAA) | Horvath: 353 CpGs | yes | very weak | yes | ||||||||||||||||||||||||||||||||||||||||||||||||||||||||||||||||||||||||||||||||||||||||||||||
| Age acceleration based on Hannum | AgeAccelHannum | Hannum: 71 CpGs | no | moderate | no | ||||||||||||||||||||||||||||||||||||||||||||||||||||||||||||||||||||||||||||||||||||||||||||||
| Intrinsic epigenetic age acceleration (Hannum) | IEAA.Hannum | Hannum: 71 CpGs | yes | very weak | no | ||||||||||||||||||||||||||||||||||||||||||||||||||||||||||||||||||||||||||||||||||||||||||||||
| Extrinsic epigenetic age acceleration | EEAA | Enhanced Hannum | yes | strong | no | ||||||||||||||||||||||||||||||||||||||||||||||||||||||||||||||||||||||||||||||||||||||||||||||
| Description of the differences between epigenetic age and age acceleration measures. Column "Correlation with blood counts" relates to Supplementary Table 4. Column "Conserved in breast tissue" relates to Figure 1. | |||||||||||||||||||||||||||||||||||||||||||||||||||||||||||||||||||||||||||||||||||||||||||||||||||
Estimated blood cell counts that relate to chronological age
We estimated the abundance of ten blood cell types based on observed DNA methylation patterns (Methods) –exhausted/senescent CD8+ T cells (CD8+CD28-CD45RA-), CD8+ naïve, CD8+ total, CD4+ naïve, CD4+ total, natural killer cells, B cells, monocytes, granulocytes, and plasmablasts. To study age-related changes in blood cell composition, we correlated these estimated blood cell counts with chronological age in all of the cohort studies (Supplementary Table 2). Our results are congruent with findings from flow cytometric studies that demonstrate that the abundance of naïve CD8+ T cells decreases with age (reflecting thymic involution), whereas exhausted/senescent CD8+ T cells increase with age [9–12].
Measures of epigenetic age acceleration
Despite high correlations, epigenetic age can deviate substantially from chronological age at the individual level. The difference between epigenetic age and chronological age can be used to define "delta age" but the resulting measure exhibits a negative correlation with chronological age. By contrast, all of our measures of epigenetic age acceleration are defined such that they are uncorrelated with chronological age.
An overview of several measures of epigenetic age acceleration is presented in Table 2. One such measure (denoted as AgeAccel) is defined as the residual that results from regressing epigenetic age on chronological age. Thus, a positive value of AgeAccel indicates that the epigenetic age is higher than expected, based on chronological age. These Horvath and Hannum based measures of age acceleration are denoted by AgeAccelHorvath and AgeAccelHannum, respectively. For the sake of brevity and consistency with other publications from our group, we abbreviate AgeAccelHorvath as AgeAccel.
AgeAccelHannum and to a lesser extent AgeAccel were previously shown to correlate with blood cell counts [5]. Thus, we distinguished two broad categories of measures of epigenetic age acceleration when dealing with DNA methylation from blood or peripheral blood mononuclear cells (PBMCs): intrinsic and extrinsic epigenetic measures, which are independent of, or enhanced by blood cell count information, respectively. We define intrinsic epigenetic age acceleration (IEAA) as the residual resulting from regressing epigenetic age on chronological age and measures of blood cell counts (Methods). By definition, IEAA is not correlated with chronological age and is weakly correlated with estimated measures of blood cell counts (Supplementary Table 4). IEAA is meant to capture cell-intrinsic properties of the aging process that exhibit some preservation across various cell types and organs. Compared to our other measures of age acceleration, IEAA, adapted from the Horvath measure of epigenetic age, exhibited significant correlations with epigenetic age acceleration in breast tissue (r=0.48, p=0.0011, Figure 1B) and saliva (r=0.67, p=8.8x10⁻⁹, Figure 1F). By contrast, an analogous measure of IEAA based on the Hannum measure showed much weaker correlations (r=0.073 in breast and r=0.41 in saliva Figure 1D, 1H). For this reason, we focused on the Horvath measure of IEAA.
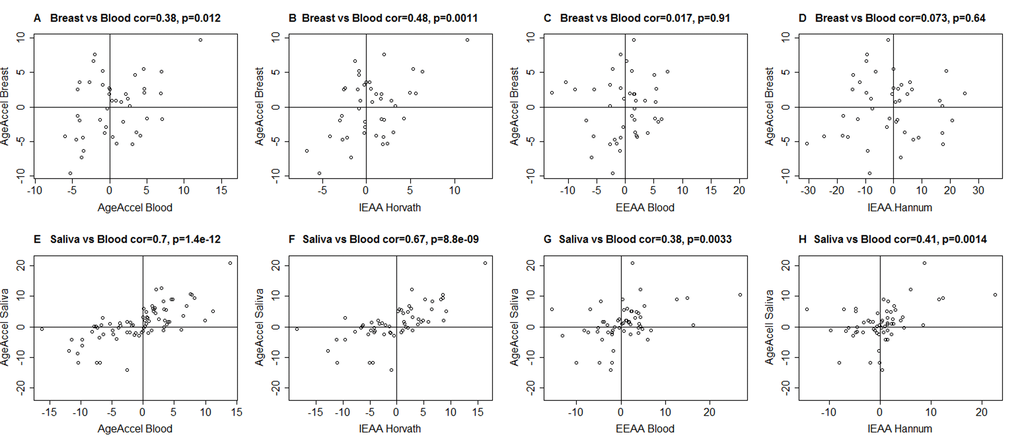
Figure 1. Epigenetic age acceleration in blood versus that in breast or saliva. A-D) Epigenetic age acceleration in healthy female breast tissue (y-axis) versus various measures of epigenetic age acceleration in blood: A) universal measure of age acceleration in blood, B) intrinsic epigenetic age acceleration based on the Horvath estimate of epigenetic age, C) extrinsic epigenetic age acceleration, D) intrinsic epigenetic age acceleration based on the Hannum estimate of epigenetic age. E-H) analogous plots for epigenetic age acceleration in saliva (y-axis) and E) AgeAccel, F) IEAA based on Horvath, G) EEAA, H) IEAA based on the Hannum estimate. The y-axis of each plot represents the universal measure of age acceleration defined as the raw residual resulting from regressing epigenetic age (based on Horvath) on chronological age.
The age-related changes to blood cell composition (Supplementary Table 4) can be leveraged to capture aspects of immunosenescence. Using these measures, we derived a novel extrinsic epigenetic age acceleration (EEAA) measure by up-weighting the blood cell count contributions of AgeAccelHannum (Methods and Supplementary Table 4).
Descriptive statistics (minimum, maximum, median) of the measures of epigenetic age acceleration can be found in Supplementary Table 3.
Cox regression models of all-cause mortality
We used Cox regression models to assess the predictive value of our measures of epigenetic age acceleration for all-cause mortality. All of our Cox models were adjusted for the age at baseline (blood draw). Additional multivariate models further adjusted for covariates assessed at baseline (chronological age, body mass index, educational level, alcohol intake, smoking pack-years, prior history of diabetes, prior history of cancer, hypertension status, self-reported recreational physical activity).
Our novel measure of extrinsic age acceleration EEAA led to smaller p-values for the associations with all-cause mortality than the original measure AgeAccelHannum in univariate Cox models (pEEAA=7.5x10-43, pAgeAccelHannum=1.4x10⁻³⁴, Supplementary Figure 1) and in multivariate Cox models (pEEAA=3.4x10⁻¹⁹, pAgeAccelHannum=6x10-15, Supplementary Figure 2). Further, when both EEAA and AgeAccelHannum were included in the same Cox model, only EEAA remained significant in the WHI data and FHS univariate models. Since these results indicate that EEAA outperforms the closely related measure AgeAccelHannum when it comes to mortality prediction, we removed the latter from subsequent analyses.
All considered measures of epigenetic age acceleration were predictive of time to death in univariate Cox models (pAgeAccel=1.9x10⁻¹¹, pIEAA=8.2x10⁻⁹, pEEAA=7.5x10-43, Figure 2) and multivariate Cox models adjusting for risk factors and pre-existing disease status (pAgeAccel=5.4x10⁻⁵, pIEAA=5.0x10⁻⁴, pEEAA=3.4x10⁻¹⁹, Figure 3).
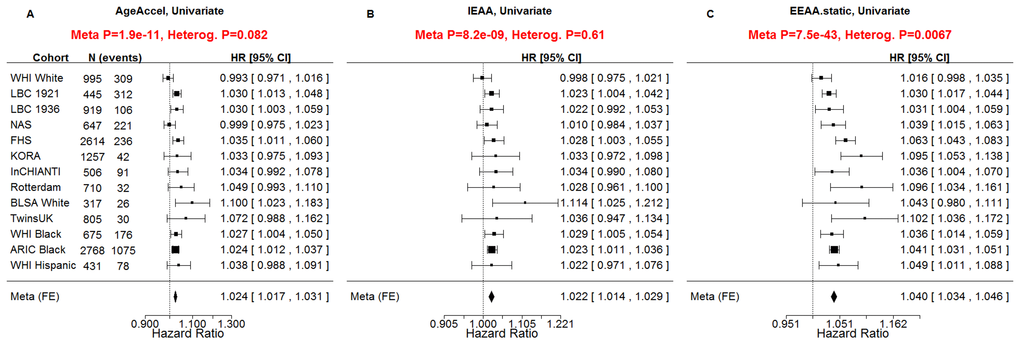
Figure 2. Univariate Cox regression meta-analysis of all-cause mortality. A univariate Cox regression model was used to relate the censored survival time (time to all-cause mortality) to A) the universal measure of age acceleration (AgeAccel), B) intrinsic epigenetic age acceleration (IEAA), C) extrinsic epigenetic age acceleration (EEAA). The rows correspond to the different cohorts. Each row depicts the hazard ratio and a 95% confidence interval. The coefficient estimates from the respective studies were meta-analyzed using a fixed-effect model weighted by inverse variance (implemented in the metafor R package [34]). It is not appropriate to compare the hazard ratios and confidence intervals of the different measures directly because the measures have different scales/distributions. However, it is appropriate to compare the meta analysis p values (red sub-title of each plot). The p-value of the heterogeneity test (Cochran's Q-test) is significant if the cohort-specific estimates differed substantially.
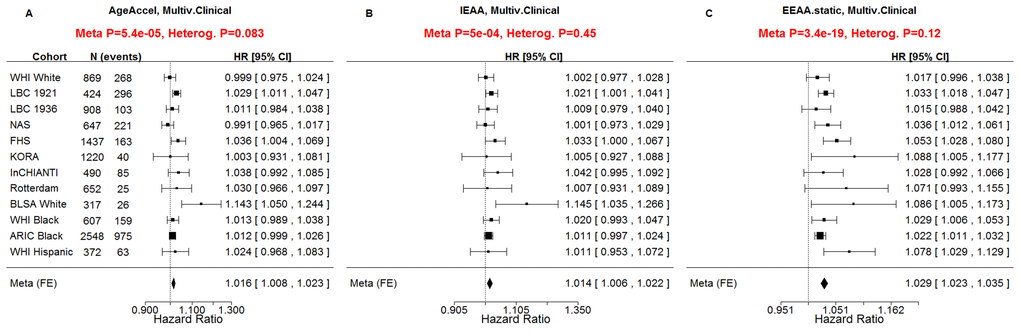
Figure 3. Multivariate Cox regression meta-analysis adjusted for clinical covariates. A multivariate Cox regression model was used to relate the censored survival time (time to all-cause mortality) to A) the universal measure of age acceleration (AgeAccel), B) intrinsic epigenetic age acceleration (IEAA), C) extrinsic epigenetic age acceleration (EEAA). The multivariate Cox regression model included the following additional covariates: chronological age, body mass index (category), educational level (category), alcohol intake, smoking pack years, prior history of diabetes, prior history of cancer, hypertension status, recreational physical activity (category). The rows correspond to the different cohorts. Each row depicts the hazard ratio and a 95% confidence interval. The coefficient estimates from the respective studies were meta-analyzed using a fixed-effect model weighted by inverse variance (implemented in the metafor R package [34]). The sub-title of each plot reports the meta-analysis p-value and a heterogeneity test p-value (Cochran's Q-test).
Interpreting effect sizes and variance of epigenetic age acceleration
Subjects differed substantially in terms of their measures of epigenetic age acceleration, e.g. EEAA ranged from -28 to 28 years in the WHI (standard deviation =6.4 years, Supplementary Table 3).
About five percent of the participants of the WHI exhibited an EEAA value larger than 10, which is associated with a 48% increased hazard of death as can be seen from the following calculation. The HR of EEAA is 1.040 if EEAA=1 (Figure 2c) but it is HR=1.48=(1.040)10 if EEAA=10. Negative values of age acceleration were associated with a lower hazard of mortality. For example, 20% of subjects had an EEAA value less than -5, which is associated with an 18% decrease in the hazard of death (HR=0.82=1.04-5).
Subgroup analysis
With few exceptions, we found that the associations between EEAA and time to death remained highly significant in subgroups stratified by race, sex, follow-up duration, body mass index, smoking status, physical activity (Table 3) and in subgroups stratified by prevalent disease at baseline such as cancer, coronary artery disease, hypertension and type 2 diabetes (Table 4). Only one subgroup led to an insignificant finding (p>0.05) in our univariate model analysis: namely subjects with less than 5 years of follow up (Table 3). For multivariate models, we failed to observe significant associations for the following subgroups: i) less than 5 years of follow up, ii) between 5 and 10 years of follow up, iii) current smokers, iv) obese individuals, v) Hispanics, vi) individuals with cancer, and vii) subjects with coronary artery disease. The insignificant results in multivariate models in cancer patients or CAD patients might reflect the relatively low sample sizes or that epigenetic age acceleration is dwarfed by other predictors of mortality in subjects with severe diseases. Hazard ratio estimates remained highly consistent across all subgroups examined.
Table 3. Subgroup analysis by demographic factors.
| Age-adjusted | Full model | ||||||||||||||||||||||||||||||||||||||||||||||||||||||||||||||||||||||||||||||||||||||||||||||||||
| Subgroup | HR | p-value | HR | p-value | |||||||||||||||||||||||||||||||||||||||||||||||||||||||||||||||||||||||||||||||||||||||||||||||
| Race | |||||||||||||||||||||||||||||||||||||||||||||||||||||||||||||||||||||||||||||||||||||||||||||||||||
| White | 1.05 | 3.0x10⁻²⁶ | 1.03 | 1.3x10⁻⁵ | |||||||||||||||||||||||||||||||||||||||||||||||||||||||||||||||||||||||||||||||||||||||||||||||
| Black | 1.04 | 7.8x10⁻²⁰ | 1.02 | 7.6x10⁻³ | |||||||||||||||||||||||||||||||||||||||||||||||||||||||||||||||||||||||||||||||||||||||||||||||
| Hispanic | 1.05 | 1.1x10⁻² | 1.06 | 5.3x10⁻² | |||||||||||||||||||||||||||||||||||||||||||||||||||||||||||||||||||||||||||||||||||||||||||||||
| pinteraction | 0.62 | 0.14 | |||||||||||||||||||||||||||||||||||||||||||||||||||||||||||||||||||||||||||||||||||||||||||||||||
| Sex | |||||||||||||||||||||||||||||||||||||||||||||||||||||||||||||||||||||||||||||||||||||||||||||||||||
| Men | 1.04 | 7.1x10⁻¹⁵ | 1.03 | 1.9x10⁻² | |||||||||||||||||||||||||||||||||||||||||||||||||||||||||||||||||||||||||||||||||||||||||||||||
| Women | 1.04 | 3.7x10⁻¹⁰ | 1.03 | 1.9x10⁻⁵ | |||||||||||||||||||||||||||||||||||||||||||||||||||||||||||||||||||||||||||||||||||||||||||||||
| pinteraction | 0.63 | 0.95 | |||||||||||||||||||||||||||||||||||||||||||||||||||||||||||||||||||||||||||||||||||||||||||||||||
| Follow-up duration | |||||||||||||||||||||||||||||||||||||||||||||||||||||||||||||||||||||||||||||||||||||||||||||||||||
| <5 years | 1.02 | 0.20 | 0.98 | 0.79 | |||||||||||||||||||||||||||||||||||||||||||||||||||||||||||||||||||||||||||||||||||||||||||||||
| 5-10 years | 1.02 | 1.8x10⁻³ | 1.02 | 0.17 | |||||||||||||||||||||||||||||||||||||||||||||||||||||||||||||||||||||||||||||||||||||||||||||||
| >10 years | 1.03 | 4.5x10⁻⁹ | 1.02 | 4.1x10⁻² | |||||||||||||||||||||||||||||||||||||||||||||||||||||||||||||||||||||||||||||||||||||||||||||||
| pinteraction | 0.67 | 0.84 | |||||||||||||||||||||||||||||||||||||||||||||||||||||||||||||||||||||||||||||||||||||||||||||||||
| BMI categories | |||||||||||||||||||||||||||||||||||||||||||||||||||||||||||||||||||||||||||||||||||||||||||||||||||
| Underweight | 1.11 | 9.4x10⁻³ | 1.04 | 8.9x10⁻³ | |||||||||||||||||||||||||||||||||||||||||||||||||||||||||||||||||||||||||||||||||||||||||||||||
| Normal | 1.06 | 6.1x10⁻¹⁹ | 1.04 | 2.3x10⁻² | |||||||||||||||||||||||||||||||||||||||||||||||||||||||||||||||||||||||||||||||||||||||||||||||
| Overweight | 1.04 | 1.46x10⁻⁸ | 1.03 | 5.0x10⁻² | |||||||||||||||||||||||||||||||||||||||||||||||||||||||||||||||||||||||||||||||||||||||||||||||
| Obese | 1.04 | 2.2x10⁻¹¹ | 1.02 | 7.1x10⁻² | |||||||||||||||||||||||||||||||||||||||||||||||||||||||||||||||||||||||||||||||||||||||||||||||
| pinteraction | 0.05 | 0.75 | |||||||||||||||||||||||||||||||||||||||||||||||||||||||||||||||||||||||||||||||||||||||||||||||||
| Smoking status | |||||||||||||||||||||||||||||||||||||||||||||||||||||||||||||||||||||||||||||||||||||||||||||||||||
| Never | 1.03 | 6.9x10⁻⁶ | 1.04 | 4.8x10⁻³ | |||||||||||||||||||||||||||||||||||||||||||||||||||||||||||||||||||||||||||||||||||||||||||||||
| Former | 1.05 | 4.2x10⁻²² | 1.03 | 6.3x10⁻⁴ | |||||||||||||||||||||||||||||||||||||||||||||||||||||||||||||||||||||||||||||||||||||||||||||||
| Current | 1.06 | 2.1x10⁻⁴ | 1.01 | 0.47 | |||||||||||||||||||||||||||||||||||||||||||||||||||||||||||||||||||||||||||||||||||||||||||||||
| pinteraction | 0.05 | 0.20 | |||||||||||||||||||||||||||||||||||||||||||||||||||||||||||||||||||||||||||||||||||||||||||||||||
| Physical activity status | |||||||||||||||||||||||||||||||||||||||||||||||||||||||||||||||||||||||||||||||||||||||||||||||||||
| Yes | 1.05 | 3.8x10⁻⁶ | 1.02 | 1.9x10⁻³ | |||||||||||||||||||||||||||||||||||||||||||||||||||||||||||||||||||||||||||||||||||||||||||||||
| No | 1.03 | 2.5x10⁻² | 1.03 | 2.2x10⁻² | |||||||||||||||||||||||||||||||||||||||||||||||||||||||||||||||||||||||||||||||||||||||||||||||
| pinteraction | 0.23 | 0.65 | |||||||||||||||||||||||||||||||||||||||||||||||||||||||||||||||||||||||||||||||||||||||||||||||||
| Age-adjusted and fully adjusted associations for EEAA to all-cause mortality by subgroup (rows). The fully adjusted model includes the following covariates: body mass index, educational level, alcohol intake, smoking pack-years, prior history of diabetes, prior history of cancer, hypertension status, self-reported recreational physical activity. | |||||||||||||||||||||||||||||||||||||||||||||||||||||||||||||||||||||||||||||||||||||||||||||||||||
Table 4. Subgroup analysis by prevalent disease status.
| Age-adjusted | Full model | ||||||||||||||||||||||||||||||||||||||||||||||||||||||||||||||||||||||||||||||||||||||||||||||||||
| Subgroup | HR | p-value | HR | p-value | |||||||||||||||||||||||||||||||||||||||||||||||||||||||||||||||||||||||||||||||||||||||||||||||
|---|---|---|---|---|---|---|---|---|---|---|---|---|---|---|---|---|---|---|---|---|---|---|---|---|---|---|---|---|---|---|---|---|---|---|---|---|---|---|---|---|---|---|---|---|---|---|---|---|---|---|---|---|---|---|---|---|---|---|---|---|---|---|---|---|---|---|---|---|---|---|---|---|---|---|---|---|---|---|---|---|---|---|---|---|---|---|---|---|---|---|---|---|---|---|---|---|---|---|---|
| Cancer status | |||||||||||||||||||||||||||||||||||||||||||||||||||||||||||||||||||||||||||||||||||||||||||||||||||
| Yes | 1.05 | 2.5x10⁻¹⁰ | 1.02 | 0.18 | |||||||||||||||||||||||||||||||||||||||||||||||||||||||||||||||||||||||||||||||||||||||||||||||
| No | 1.05 | 2.3x10⁻¹³ | 1.03 | 1.7x10⁻⁴ | |||||||||||||||||||||||||||||||||||||||||||||||||||||||||||||||||||||||||||||||||||||||||||||||
| pinteraction | 0.92 | 0.73 | |||||||||||||||||||||||||||||||||||||||||||||||||||||||||||||||||||||||||||||||||||||||||||||||||
| Coronary artery disease status | |||||||||||||||||||||||||||||||||||||||||||||||||||||||||||||||||||||||||||||||||||||||||||||||||||
| Yes | 1.04 | 2.4x10⁻⁵ | 1.01 | 0.60 | |||||||||||||||||||||||||||||||||||||||||||||||||||||||||||||||||||||||||||||||||||||||||||||||
| No | 1.04 | 1.5x10⁻¹² | 1.02 | 1.5x10⁻⁴ | |||||||||||||||||||||||||||||||||||||||||||||||||||||||||||||||||||||||||||||||||||||||||||||||
| pinteraction | 0.43 | 0.99 | |||||||||||||||||||||||||||||||||||||||||||||||||||||||||||||||||||||||||||||||||||||||||||||||||
| Hypertension status | |||||||||||||||||||||||||||||||||||||||||||||||||||||||||||||||||||||||||||||||||||||||||||||||||||
| Yes | 1.04 | 7.4x10⁻¹⁷ | 1.03 | 2.9x10⁻³ | |||||||||||||||||||||||||||||||||||||||||||||||||||||||||||||||||||||||||||||||||||||||||||||||
| No | 1.05 | 7.1x10⁻⁶ | 1.02 | 8.6x10⁻³ | |||||||||||||||||||||||||||||||||||||||||||||||||||||||||||||||||||||||||||||||||||||||||||||||
| pinteraction | 0.41 | 0.45 | |||||||||||||||||||||||||||||||||||||||||||||||||||||||||||||||||||||||||||||||||||||||||||||||||
| Type 2 diabetes status | |||||||||||||||||||||||||||||||||||||||||||||||||||||||||||||||||||||||||||||||||||||||||||||||||||
| Yes | 1.04 | 8.6x10⁻¹³ | 1.03 | 1.7x10⁻³ | |||||||||||||||||||||||||||||||||||||||||||||||||||||||||||||||||||||||||||||||||||||||||||||||
| No | 1.04 | 1.2x10⁻¹⁰ | 1.02 | 9.3x10⁻³ | |||||||||||||||||||||||||||||||||||||||||||||||||||||||||||||||||||||||||||||||||||||||||||||||
| pinteraction | 0.70 | 0.25 | |||||||||||||||||||||||||||||||||||||||||||||||||||||||||||||||||||||||||||||||||||||||||||||||||
| Age-adjusted and fully adjusted associations for EEAA to all-cause mortality in different subgroups (rows). The fully adjusted model includes the following covariates: body mass index, educational level, alcohol intake, smoking pack-years, prior history of diabetes, prior history of cancer, hypertension status, self-reported recreational physical activity. | |||||||||||||||||||||||||||||||||||||||||||||||||||||||||||||||||||||||||||||||||||||||||||||||||||
We did not observe significant differences in the estimated hazard ratios across any subgroup (Tables 3 and 4). Specifically, racial/ethnic differences in HR were not observed (interaction p=0.62 in age-adjustment models and p=0.14 in full models). Overall, these subgroup analysis results confirm that epigenetic age acceleration is an independent predictor of earlier mortality even after adjusting for possible confounders and within major subgroups of the population.
Hazard ratio of death versus follow up time and median age
The large number of cohorts allowed us to relate cohort characteristics (such as median age or median follow up time) to strength of association with mortality. We did not find a statistically significant relationship between the hazard ratio of death for the median age of the cohort or the follow up time (Figure 4).
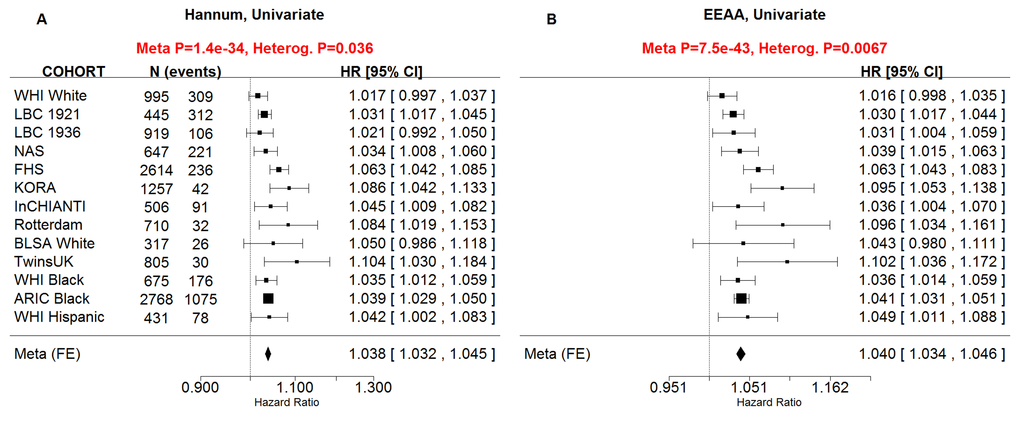
Figure 4. Hazard ratio of death versus cohort characteristics. Each circle corresponds to a cohort (data set). Circle sizes correspond to the square root of the number of observed deaths, because the statistical power of a Cox model is determined by the number of observed deaths. A-C) The y-axis of each panel corresponds to the natural log of the hazard ratio (ln HR) of a univariate Cox regression model for all-cause mortality. Each panel corresponds to a different measure of epigenetic age acceleration A) universal age acceleration, B) intrinsic age acceleration, C) extrinsic age acceleration. Panels D-F are analogous to those in A-C but the x-axis corresponds to the median age of the subjects at baseline (Table 1). The title of each panel reports the Wald test statistic (T) and corresponding p-value resulting from a weighted linear regression model (y regressed on x) where each point (data set) is weighted by the square root of the number of observed deaths. The dotted red line represents the regression line. The black solid line represents the line of identify (i.e., no association).
Robustness analysis
To assess the robustness of our findings, we also carried out a leave-one-out analysis by re-running the meta-analysis after removing data from individual cohorts. The resulting p-values are highly robust with respect to removing a single data set from the analysis (Supplementary Table 5). In our study, we used a fixed effects meta-analysis method for the sake of consistency with previous analyses [5]. However, our results remain qualitatively the same after using a random effects meta-analysis method (Supplementary Figure 4).
Discussion
The current study corroborates previous findings regarding the predictive power of DNA methylation-based biomarkers of age for mortality [5,6,8]. We further examined novel variants of these measures that are either independent of blood cell counts or are enhanced by changes in blood cell sub-populations. We showed that the extrinsic measure EEAA out-performs previous measures of age acceleration when it comes to predicting all-cause mortality. Furthermore, the associations between epigenetic age acceleration and mortality did not differ significantly across subgroups of race/ethnicity, sex, BMI, smoking status, physical activity status, or major chronic diseases. The consistency of the associations across multiple subgroups lends support to the notion that epigenetic age acceleration captures some aspect of biological aging over and above chronological age and other risk factors.
The development of suitable measures of biological age has been a key goal in the field of aging research [13]. Many biomarkers of age have been posited including epigenetic alterations of the DNA (e.g., DNA methylation), transcriptomic changes in blood [14], telomere length [15], whole-body function such as gait speed (reviewed in [16]). The current study does not aim to replace existing blood based biomarkers, but rather, we aimed to demonstrate that it complements existing markers. Above all, this study shows that epigenetic age captures an aspect of biological age, as assessed through lifespan, above and beyond chronological age, blood cell composition, and a host of traditional risk factors of mortality.
The measures of epigenetic age acceleration are attractive because they are highly robust and because their measurement only involve DNA methylation data. While actual flow cytometry data will always be preferable to imputed blood cell count data (based on DNA methylation data), the measures of age acceleration do not require the measurement of flow data. Rather, measures of intrinsic and extrinsic epigenetic age used blood cell count estimates resulting from DNA methylation data. The measure of extrinsic age acceleration EEAA reflects aspects of immunosenescence because, by construction, it correlates with age-related changes in blood cell composition, such as T lymphocyte populations, which underlie much of the age-related decline in the protective immune response [9–12]. Thus, the high predictive significance of EEAA for all-cause mortality probably reflects the fact that it assesses multiple aspects of the biological age of the immune system including both changes in blood cell composition and cell-intrinsic epigenetic changes. It has been known for decades that poor T cell functioning is predictive of mortality [17].
The findings surrounding the predictive utility of intrinsic epigenetic age acceleration are biologically compelling and point to a new frontier in aging research. Our study strongly suggests IEAA is reflective of an intrinsic epigenetic clock that is associated with mortality independent of chronological age, changes in blood cell composition, and traditional risk factors of mortality. IEAA probably captures a cell-type independent component of the aging process for the following reasons. First, IEAA is moderately preserved across different tissues and cell types collected from the same subject (Figure 1). Second, IEAA but not EEAA is predictive of lung cancer [18]. Third, only IEAA and AgeAccel relate to centenarian status [8].
Overall, our results inform the ongoing debate about whether epigenetic biomarkers of age capture an aspect of biological age. While epigenetic processes are unlikely to be the only mediators of chronological age on mortality—in fact, multiple risk factors have stronger effects on mortality—our results suggest that at least one of the mediating processes relates to the epigenetic age of blood tissue and that this process is independent of age-dependent changes in blood cell composition. Future studies will be useful for gaining a mechanistic understanding of this intrinsic epigenetic aging process.
Methods
Measures of epigenetic age
We used an epigenetic biomarker of age based on 353 CpG markers as one measure of epigenetic age because: a) it is an accurate measurement of age across multiple tissues [3]; b) we previously showed that it is predictive of all-cause mortality [5]; c) it correlated with measures of cognitive/physical fitness and neuro-pathology in the elderly [19,20]; and d) it was associated with conditions that are of interest in aging research including Down's syndrome [21], Huntington's disease [22], Parkinson's disease [23], obesity [24], HIV infection [25], menopause [26], centenarian status [27], ethnicity and sex [28], and cellular senescence [3,29]. This epigenetic age estimator not only lends itself to measuring aging effects in elderly subjects; but also applies to prenatal brain samples [30] and blood samples from minors [31]. Epigenetic age is defined as the predicted value of age based on the DNA methylation levels of 353 CpGs. Mathematical details and software tutorials for estimating epigenetic age can be found in the additional files of [3]. All of the described epigenetic measures of aging and age acceleration are implemented in our freely available software (https://dnamage.genetics.ucla.edu) [3].
DNA methylation age estimate by Hannum et al (2013)
We also used an alternative measure of epigenetic age developed by Hannum et al (2013) [2]. The resulting age estimate is based on the 71 CpGs and coefficient values from the Supplementary Table 3 [2]. The authors developed this age prediction method by using an elastic net regression model for predicting chronological age based on DNA methylation levels from whole blood.
Measures of epigenetic age acceleration
Table 2 provides an overview of our measures of epigenetic age acceleration. The universal measure of age acceleration (AgeAccel), which is valid for a wide range of tissue types, is defined as the residual resulting from a linear regression model that regresses the Horvath estimate of epigenetic age on chronological age. Thus, a positive value for AgeAccel indicates that the observed epigenetic age is higher than that predicted, based on chronological age. AgeAccel has a relatively weak correlation with blood cell counts [25], but it still relates to estimated blood cell counts, as seen in Supplementary Table 4.
To estimate "pure" epigenetic aging effects that are not influenced by differences in blood cell counts ("intrinsic" epigenetic age acceleration, IEAA), we obtained the residual resulting from a multivariate regression model of epigenetic age on chronological age and various blood immune cell counts (naive CD8+ T cells, exhausted CD8+ T cells, plasmablasts, CD4+ T cells, natural killer cells, monocytes, and granulocytes) imputed from methylation data.
Extrinsic epigenetic age acceleration measures capture both cell intrinsic methylation changes and extracellular changes in blood cell composition. Our measure of EEAA is defined using the following three steps. First, we calculated the epigenetic age measure from Hannum et al [2], which already correlated with certain blood cell types [5]. Second, we increased the contribution of immune blood cell types to the age estimate by forming a weighted average of Hannum’s estimate with 3 cell types that are known to change with age: naïve (CD45RA+CCR7+) cytotoxic T cells, exhausted (CD28-CD45RA-) cytotoxic T cells, and plasmablasts using the Klemera-Doubal approach [32]. The weights used in the weighted average are determined by the correlation between the respective variable and chronological age [32]. The weights were chosen on the basis of the WHI data. Thus, the same (static) weights were used for all data sets. EEAA was defined as the residual variation resulting from a univariate model regressing the resulting age estimate on chronological age. By construction, EEAA is positively correlated with the estimated abundance of exhausted CD8+ T cells, plasmablast cells, and a negative correlated with naive CD8+ T cells. Blood cell counts were estimated based on DNA methylation data as described in the next section. By construction, the measures of EEAA track both age related changes in blood cell composition and intrinsic epigenetic changes. None of our four measures of epigenetic age acceleration are correlated with chronological age.
Estimating blood cell counts based on DNA methylation levels
We estimate blood cell proportions using two different software tools. Houseman's estimation method [33], which is based on DNA methylation signatures from purified leukocyte samples, was used to estimate the proportions of cytotoxic (CD8+) T cells, helper (CD4+) T, natural killer, B cells, and granulocytes. The software does not allow us to identify the type of granulocytes in blood (neutrophil, eosinophil, or basophil) but we note that neutrophils tend to be the most abundant granulocyte (~60% of all blood cells compared with 0.5-2.5% for eosinophils and basophils). To estimate the percentage of exhausted CD8+ T cells (defined as CD28-CD45RA-), plasmablasts, and the number (count) of naïve CD8+ T cells (defined as CD45RA+CCR7+), we used the "Horvath method" [25], which is implemented in the advanced analysis option of the epigenetic age calculator software [3]. We and others have shown that imputed blood cell counts have moderately high correlations with corresponding flow cytometric data, e.g. r=0.86 for naïve CD4+ T cells, r=0.68 for naïve CD8+T, and r=0.49 for exhausted CD8+ T cells [28].
Cox regression models and meta-analysis
Here, we used Cox models for analyzing the censored survival time data (from the age at blood draw until age at death or last follow-up). We regressed the censored survival times on covariates using Cox regression models implemented in the R function coxph in the survival package. The resulting coefficient values (interpreted as log hazard ratios) and standard errors were combined using the R software package metafor [34]. The meta-analysis was carried out with the R command rma (with arguments method="FE" to get fixed effects estimates). The forest plots were created using the R function forest (with argument atransf=exp to exponentiate the estimate of the log hazard ratios).
Sample exclusions
In addition to cohort-specific quality checks, we further excluded individuals who had ever been diagnosed with leukemia (ICD-9: 203-208), reported receiving chemotherapy, and whose methylation beta value distributions deviated substantially from a gold standard (according to the quality statistic corSampleVSgoldstandard<0.80 from the online age calculator [35–37]).
Supplementary Materials
Author Contributions
All co-authors contributed data or analyzed the data or helped interpret the findings or helped write the article. BHC coordinated the analysis of the cohort studies and created the software code. SH, D. Levy, A. Baccarelli, J van Meurs, J. Bell, A. Peters, I. Deary, J. Pankow, L. Ferrucci, led cohort studies of this effort. SH developed and implemented the novel measures of epigenetic age acceleration and wrote the first draft of the article.
Acknowledgements
Acknowledgement ARIC
The Atherosclerosis Risk in Communities Study is carried out as a collaborative study supported by National Heart, Lung, and Blood Institute contracts (HHSN268201100005C, HHSN268201100006C, HHSN268201100007C, HHSN268201100008C, HHSN268201100009C, HHSN268201100010C, HHSN268201100011C, and HHSN268201100012C). The authors thank the staff and participants of the ARIC study for their important contributions. Methylation profiling of the ARIC samples was also supported by the National Institutes of Health (NIH) American Recovery and Reinvestment Act of 2009 (ARRA) Building on GWAS for NHLBI-diseases: the U.S. CHARGE consortium (5RC2HL102419) (PI: E. Boerwinkle).
Acknowledgement Rotterdam
This study was funded by The Netherlands Society for Scientific Research (NWO) VIDI Grant 917103521. The Rotterdam Study is funded by Erasmus Medical Center and Erasmus University, Rotterdam, Netherlands Organization for the Health Research and Development (ZonMw), the Netherlands Organization of Scientific Research NWO Investments (nr. 175.010.2005.011, 911-03-012), the Research Institute for Diseases in the Elderly (014-93-015; RIDE2), the Ministry of Education, Culture and Science, the Ministry for Health, Welfare and Sports, the European Commission (DG XII), and the Municipality of Rotterdam.
The generation and management of the Illumina 450K methylation array data for the Rotterdam Study were executed by the Human Genotyping Facility of the Genetic Laboratory of the Department of Internal Medicine, Erasmus MC, the Netherlands. The methylation data was funded by the Genetic Laboratory of the Department of Internal Medicine, Erasmus MC, and by the Netherlands Organization for Scientific Research (NWO; project number 184021007) and made available as a Rainbow Project (RP3; BIOS) of the Biobanking and Biomolecular Research Infrastructure Netherlands (BBMRI-NL).
The authors are grateful to the study participants, the staff from the Rotterdam Study and the participating general practitioners and pharmacists. We thank Mr. Michael Verbiest, Ms. Mila Jhamai, Ms. Sarah Higgins, Mr. Marijn Verkerk, for their help in creating the methylation database.
Acknowledgement KORA
The KORA study was initiated and financed by the Helmholtz Zentrum München – German Research Center for Environmental Health, Neuherberg, Germany and supported by grants from the German Federal Ministry of Education and Research (BMBF), by the State of Bavaria, the Federal Ministry of Health (Berlin, Germany), the Ministry of Innovation, Science, Research and Technology of the state North Rhine-Westphalia (Düsseldorf, Germany), and the Munich Center of Health Sciences (MC Health) as part of LMUinnovativ. The work is partly supported by grants from the European Union’s Seventh Framework Program (FP7-Health) under grant agreement no. 305280 (MIMOmics) and by the BMBF: e:Med project: e:AtheroSysMed - Systems medicine of myocardial infarction and stroke, as well as a Grant from the GIF, the German-Israeli Foundation for Scientific Research and Development.
Acknowledgements Lothian Birth Cohorts
We thank the cohort participants and team members who contributed to these studies. This work was supported by multiple sources. Phenotype collection in the Lothian Birth Cohort 1921 was supported by the UK’s Biotechnology and Biological Sciences Research Council (BBSRC), The Royal Society and The Chief Scientist Office of the Scottish Government. Phenotype collection in the Lothian Birth Cohort 1936 was supported by Age UK (The Disconnected Mind project). Methylation typing was supported by Centre for Cognitive Ageing and Cognitive Epidemiology (Pilot Fund award), Age UK, The Wellcome Trust Institutional Strategic Support Fund, The University of Edinburgh, and The University of Queensland. REM, IJD and PMV are members of the University of Edinburgh Centre for Cognitive Ageing and Cognitive Epidemiology (CCACE). CCACE is supported by funding from the BBSRC, the Medical Research Council (MRC), and the University of Edinburgh as part of the cross-council Lifelong Health and Wellbeing initiative (MR/K026992/1).
Acknowledgement Framingham Heart Study
The Framingham Heart Study is funded by National Institutes of Health contract N01-HC-25195 and HHSN268201500001I. The laboratory work for this investigation was funded by the Division of Intramural Research, National Heart, Lung, and Blood Institute, National Institutes of Health. The analytical component of this project was funded by the Division of Intramural Research, National Heart, Lung, and Blood Institute, and the Center for Information Technology, National Institutes of Health, Bethesda, MD. JMM and KLL were supported by R01AG029451. This work utilized the computational resources of the NIH HPC Biowulf cluster. (http://hpc.nih.gov). The views expressed in this manuscript are those of the authors and do not necessarily represent the views of the National Heart, Lung, and Blood Institute; the National Institutes of Health; or the U.S. Department of Health and Human Services.
Acknowledgement WHI
The generation of the WHI was supported by NIH/NHLBI 60442456 BAA23 (Assimes, Absher, Horvath). SH, ML, ATL were supported by NIH/NIA 5R01AG042511-02 (Horvath, Levine) and NIH/NIA 1U34AG051425-01 (Horvath). The WHI program is funded by the National Heart, Lung, and Blood Institute, National Institutes of Health, U.S. Department of Health and Human Services through contracts HHSN268201100046C, HHSN268201100001C, HHSN268201100002C, HHSN268201100003C, HHSN268201100004C, and HHSN271201100004C.
We would like to acknowledge the following WHI investigators. Program Office: (National Heart, Lung, and Blood Institute, Bethesda, Maryland) Jacques Rossouw, Shari Ludlam, Dale Burwen, Joan McGowan, Leslie Ford, and Nancy Geller. Clinical Coordinating Center: Clinical Coordinating Center: (Fred Hutchinson Cancer Research Center, Seattle, WA) Garnet Anderson, Ross Prentice, Andrea LaCroix, and Charles Kooperberg Investigators and Academic Centers: (Brigham and Women's Hospital, Harvard Medical School, Boston, MA) Barbara V. Howard; (Stanford Prevention Research Center, Stanford, CA) Marcia L. Stefanick; (The Ohio State University, Columbus, OH) Rebecca Jackson; (University of Arizona, Tucson/Phoenix, AZ) Cynthia A. Thomson; (University at Buffalo, Buffalo, NY) Jean Wactawski-Wende; (University of Florida, Gainesville/Jacksonville, FL) Marian Limacher; (University of Iowa, Iowa City/Davenport, IA) Robert Wallace; (University of Pittsburgh, Pittsburgh, PA) Lewis Kuller; (Wake Forest University School of Medicine, Winston-Salem, NC) Sally Shumaker. Women’s Health Initiative Memory Study: (Wake Forest University School of Medicine, Winston-Salem, NC) Sally Shumaker.
Acknowledgement TwinsUK
We would like to thank all the twins and family members in the TwinsUK cohort. Support for this work was obtained from the European Research Council (ERC 250157) and in part from the TwinsUK resource, which is funded by the Wellcome Trust; the European Community’s Seventh Framework Programme (FP7/2007–2013); and the National Institute for Health Research (NIHR) BioResource, Clinical Research Facility and Biomedical Research Centre based at Guy’s and St Thomas’ NHS Foundation Trust and King’s College London.
Funding
This work was supported by the National Institute of Environmental Health Sciences (R01ES021733; R01ES015172, R01ES025225). The United States Department of Veterans Affairs (VA) Normative Aging Study (NAS) is supported by the Cooperative Studies Program/ERIC and is a research component of the Massachusetts Veterans Epidemiology Research and Information Center (MAVERIC), Boston Massachusetts.
Conflicts of Interest
The Regents of the University of California is the sole owner of a provisional patent application directed at the invention of measures of epigenetic age acceleration for which SH is a named inventor. The other authors declare no conflict of interest.
References
- 1. Bocklandt S, Lin W, Sehl ME, Sánchez FJ, Sinsheimer JS, Horvath S, Vilain E. Epigenetic predictor of age. PLoS One. 2011; 6:e14821. https://doi.org/10.1371/journal.pone.0014821 [PubMed]
- 2. Hannum G, Guinney J, Zhao L, Zhang L, Hughes G, Sadda S, Klotzle B, Bibikova M, Fan JB, Gao Y, Deconde R, Chen M, Rajapakse I, et al. Genome-wide methylation profiles reveal quantitative views of human aging rates. Mol Cell. 2013; 49:359–67. https://doi.org/10.1016/j.molcel.2012.10.016 [PubMed]
- 3. Horvath S. DNA methylation age of human tissues and cell types. Genome Biol. 2013; 14:R115. https://doi.org/10.1186/gb-2013-14-10-r115 [PubMed]
- 4. Lin Q, Weidner CI, Costa IG, Marioni RE, Ferreira MR, Deary IJ, Wagner W. DNA methylation levels at individual age-associated CpG sites can be indicative for life expectancy. Aging (Albany NY). 2016; 8:394–401. https://doi.org/10.18632/aging.100908 [PubMed]
- 5. Marioni RE, Shah S, McRae AF, Chen BH, Colicino E, Harris SE, Gibson J, Henders AK, Redmond P, Cox SR, Pattie A, Corley J, Murphy L, et al. DNA methylation age of blood predicts all-cause mortality in later life. Genome Biol. 2015; 16:25. https://doi.org/10.1186/s13059-015-0584-6 [PubMed]
- 6. Christiansen L, Lenart A, Tan Q, Vaupel JW, Aviv A, McGue M, Christensen K. DNA methylation age is associated with mortality in a longitudinal Danish twin study. Aging Cell. 2016; 15:149–54. https://doi.org/10.1111/acel.12421 [PubMed]
- 7. Perna L, Zhang Y, Mons U, Holleczek B, Saum K-U, Brenner H. Epigenetic age acceleration predicts cancer, cardiovascular, and all-cause mortality in a German case cohort. Clin Epigenetics. 2016; 8:64. https://doi.org/10.1186/s13148-016-0228-z [PubMed]
- 8. Horvath S, Pirazzini C, Bacalini MG, Gentilini D, Di Blasio AM, Delledonne M, Mari D, Arosio B, Monti D, Passarino G, De Rango F, D’Aquila P, Giuliani C, et al. Decreased epigenetic age of PBMCs from Italian semi-supercentenarians and their offspring. Aging (Albany NY). 2015; 7:1159–70. https://doi.org/10.18632/aging.100861 [PubMed]
- 9. Fagnoni FF, Vescovini R, Passeri G, Bologna G, Pedrazzoni M, Lavagetto G, Casti A, Franceschi C, Passeri M, Sansoni P. Shortage of circulating naive CD8(+) T cells provides new insights on immunodeficiency in aging. Blood. 2000; 95:2860–68. [PubMed]
- 10. Franceschi C. Inflammaging as a major characteristic of old people: can it be prevented or cured? Nutr Rev. 2007; 65:S173–76. https://doi.org/10.1301/nr.2007.dec.S173-S176 [PubMed]
- 11. Franceschi C, Bonafè M, Valensin S, Olivieri F, De Luca M, Ottaviani E, De Benedictis G. Inflamm-aging. An evolutionary perspective on immunosenescence. Ann N Y Acad Sci. 2000; 908:244–54. https://doi.org/10.1111/j.1749-6632.2000.tb06651.x [PubMed]
- 12. Miller RA. The aging immune system: primer and prospectus. Science. 1996; 273:70–74. https://doi.org/10.1126/science.273.5271.70 [PubMed]
- 13. Baker GT 3rd and Sprott RL. Biomarkers of aging. Exp Gerontol. 1988; 23:223–39. https://doi.org/10.1016/0531-5565(88)90025-3 [PubMed]
- 14. Peters MJ, Joehanes R, Pilling LC, Schurmann C, Conneely KN, Powell J, Reinmaa E, Sutphin GL, Zhernakova A, Schramm K, Wilson YA, Kobes S, Tukiainen T, NABEC/UKBEC Consortium, et al. The transcriptional landscape of age in human peripheral blood. Nat Commun. 2015; 6:8570. https://doi.org/10.1038/ncomms9570 [PubMed]
- 15. Sanders JL and Newman AB. Telomere length in epidemiology: a biomarker of aging, age-related disease, both, or neither? Epidemiol Rev. 2013; 35:112–31. https://doi.org/10.1093/epirev/mxs008 [PubMed]
- 16. Sanders J, Boudreau R, Newman A. (2012). Understanding the Aging Process Using Epidemiologic Approaches. (Dordrecht Heidelberg New York: Springer).
- 17. Roberts-Thomson IC, Whittingham S, Youngchaiyud U, Mackay IR. Ageing, immune response, and mortality. Lancet. 1974; 2:368–70. https://doi.org/10.1016/S0140-6736(74)91755-3 [PubMed]
- 18. Levine ME, Hosgood HD, Chen B, Absher D, Assimes T, Horvath S. DNA methylation age of blood predicts future onset of lung cancer in the women’s health initiative. Aging (Albany NY). 2015; 7:690–700. https://doi.org/10.18632/aging.100809 [PubMed]
- 19. Marioni RE, Shah S, McRae AF, Ritchie SJ, Muniz-Terrera G, Harris SE, Gibson J, Redmond P, Cox SR, Pattie A, Corley J, Taylor A, Murphy L, et al. The epigenetic clock is correlated with physical and cognitive fitness in the Lothian Birth Cohort 1936. Int J Epidemiol. 2015; 44:1388–96. https://doi.org/10.1093/ije/dyu277 [PubMed]
- 20. Levine ME, Lu AT, Bennett DA, Horvath S. Epigenetic age of the pre-frontal cortex is associated with neuritic plaques, amyloid load, and Alzheimer’s disease related cognitive functioning. Aging (Albany NY). 2015; 7:1198–211. https://doi.org/10.18632/aging.100864 [PubMed]
- 21. Horvath S, Garagnani P, Bacalini MG, Pirazzini C, Salvioli S, Gentilini D, Di Blasio AM, Giuliani C, Tung S, Vinters HV, Franceschi C. Accelerated epigenetic aging in Down syndrome. Aging Cell. 2015; 14:491–95. https://doi.org/10.1111/acel.12325 [PubMed]
- 22. Horvath S, Langfelder P, Kwak S, Aaronson J, Rosinski J, Vogt TF, Eszes M, Faull RL, Curtis MA, Waldvogel HJ, Choi OW, Tung S, Vinters HV, et al. Huntington’s disease accelerates epigenetic aging of human brain and disrupts DNA methylation levels. Aging (Albany NY). 2016; 8:1485–512. https://doi.org/10.18632/aging.101005 [PubMed]
- 23. Horvath S and Ritz BR. Increased epigenetic age and granulocyte counts in the blood of Parkinson’s disease patients. Aging (Albany NY). 2015; 7:1130–42. https://doi.org/10.18632/aging.100859 [PubMed]
- 24. Horvath S, Erhart W, Brosch M, Ammerpohl O, von Schönfels W, Ahrens M, Heits N, Bell JT, Tsai P-C, Spector TD, Deloukas P, Siebert R, Sipos B, et al. Obesity accelerates epigenetic aging of human liver. Proc Natl Acad Sci USA. 2014; 111:15538–43. https://doi.org/10.1073/pnas.1412759111 [PubMed]
- 25. Horvath S and Levine AJ. HIV-1 infection accelerates age according to the epigenetic clock. J Infect Dis. 2015; 212:1563–73. https://doi.org/10.1093/infdis/jiv277 [PubMed]
- 26. Levine ME, Lu AT, Chen BH, Hernandez DG, Singleton AB, Ferrucci L, Bandinelli S, Salfati E, Manson JE, Quach A, Kusters CD, Kuh D, Wong A, et al. Menopause accelerates biological aging. Proc Natl Acad Sci USA. 2016; 113:9327–32. https://doi.org/10.1073/pnas.1604558113 [PubMed]
- 27. Horvath S, Mah V, Lu AT, Woo JS, Choi OW, Jasinska AJ, Riancho JA, Tung S, Coles NS, Braun J, Vinters HV, Coles LS. The cerebellum ages slowly according to the epigenetic clock. Aging (Albany NY). 2015; 7:294–306. https://doi.org/10.18632/aging.100742 [PubMed]
- 28. Horvath S, Gurven M, Levine ME, Trumble BC, Kaplan H, Allayee H, Ritz BR, Chen B, Lu AT, Rickabaugh TM, Jamieson BD, Sun D, Li S, et al. An epigenetic clock analysis of race/ethnicity, sex, and coronary heart disease. Genome Biol. 2016; 17:171. https://doi.org/10.1186/s13059-016-1030-0 [PubMed]
- 29. Lowe D, Horvath S, Raj K. Epigenetic clock analyses of cellular senescence and ageing. Oncotarget. 2016; 7:8524–31. [PubMed]
- 30. Spiers H, Hannon E, Schalkwyk LC, Smith R, Wong CC, O’Donovan MC, Bray NJ, Mill J. Methylomic trajectories across human fetal brain development. Genome Res. 2015; 25:338–52. https://doi.org/10.1101/gr.180273.114 [PubMed]
- 31. Walker RF, Liu JS, Peters BA, Ritz BR, Wu T, Ophoff RA, Horvath S. Epigenetic age analysis of children who seem to evade aging. Aging (Albany NY). 2015; 7:334–39. https://doi.org/10.18632/aging.100744 [PubMed]
- 32. Klemera P and Doubal S. A new approach to the concept and computation of biological age. Mech Ageing Dev. 2006; 127:240–48. https://doi.org/10.1016/j.mad.2005.10.004 [PubMed]
- 33. Houseman EA, Accomando WP, Koestler DC, Christensen BC, Marsit CJ, Nelson HH, Wiencke JK, Kelsey KT. DNA methylation arrays as surrogate measures of cell mixture distribution. BMC Bioinformatics. 2012; 13:86. https://doi.org/10.1186/1471-2105-13-86 [PubMed]
- 34. Viechtbauer W. Conducting Meta-Analyses in R with the metafor Package. J Stat Softw. 2010; 36:1–48. https://doi.org/10.18637/jss.v036.i03
- 35. Curb JD, McTiernan A, Heckbert SR, Kooperberg C, Stanford J, Nevitt M, Johnson KC, Proulx-Burns L, Pastore L, Criqui M, Daugherty S, WHI Morbidity and Mortality Committee. Outcomes ascertainment and adjudication methods in the Women’s Health Initiative. Ann Epidemiol. 2003 (Suppl ); 13:S122–28. https://doi.org/10.1016/S1047-2797(03)00048-6 [PubMed]
- 36. Deary IJ, Gow AJ, Pattie A, Starr JM. Cohort profile: the Lothian Birth Cohorts of 1921 and 1936. Int J Epidemiol. 2012; 41:1576–84. https://doi.org/10.1093/ije/dyr197 [PubMed]
- 37. Ferrucci L, Bandinelli S, Benvenuti E, Di Iorio A, Macchi C, Harris TB, Guralnik JM. Subsystems contributing to the decline in ability to walk: bridging the gap between epidemiology and geriatric practice in the InCHIANTI study. J Am Geriatr Soc. 2000; 48:1618–25. https://doi.org/10.1111/j.1532-5415.2000.tb03873.x [PubMed]