Search strategy and included studies
In our work we analysed human intervention studies and evaluated the impact of DR regimens on adipose mass and some biomarkers of healthy aging (Geromarkers). The Geromarkers included in our meta-analysis were described in Table 1. Two investigators, E.G. and D.L.B., independently carried out study selection and included both studies with an experimental design (EXP) and quasi-experimental design (Q-EXP). EXP studies were randomized with a control group and a parallel or crossover design; whereas Q-EXP included observational studies (pre- and post-intervention or pre- and post-data), non-randomized or uncontrolled studies [36]. Q-EXP studies were pooled together with EXP studies only after assessing whether they were in agreement with EXP studies [37]. Candidate studies were searched in PubMed (finalized February 30, 2016) using the terms ‘calorie or caloric or dietary restriction’, ‘fasting or intermittent fasting or alternate day fasting and ‘adipose tissue or fat mass or fat tissue’’. Inclusion criteria were as follows: human intervention studies with long-term study design (> 3 months); healthy and unhealthy (e.g. dyslipidaemia, obesity, metabolic syndrome) subjects; numerically analysable information about results, study duration and calories reduced in the study. Studies were excluded when: only abstracts were available; duration time of the study was lesser than 3 months; data presentation was incomplete; information about the DR was incomplete. When necessary, efforts were made to contact investigators for clarification or additional data. This research strategy produced a total of 201 studies. Furthermore, a manual research of references from clinical studies and reviews identified 42 additional studies, for a total of 243 studies to be evaluated, 9 of which are reviews [38-46]. A first screening allowed discarding 147 articles whose titles or abstracts were evidently irrelevant to our aim. Of the remaining 96 studies, 53 were rejected whenever: they presented incomplete data; DR was coupled with physical exercise; there were no reported data on adipose mass; they only presented data on weight and fat mass without other parameters (Fig. 10). Therefore, from 243 initial candidates, the 43 studies available for a formal meta-analysis had the following characteristics: they were written in English; they had a period of intervention of at least two weeks; they were carried out exclusively on human subjects. Among the considered studies, 12 were on females [32,34,35,47-55], 4 on males [56-59], and the rest mixed [60-62,33,63-85]. Moreover, 30 studies were intervention studies evaluating the efficacy of calorie restriction [33-35,47-49,51-53,56,58-60,63-67,69,71-73,75,76,79-82,84,85]; 4 were intervention studies evaluating the efficacy of intermittent fasting [50,57,61,70]; 9 were intervention studies evaluating the efficacy of low or very low calorie diets [32,54,55,62,68,74,77,78,83]. The selected studies included human groups with different BMI. In particular, 10 were studies on obese [34,35,48,50,53,54,58,61,64,68], 16 on overweight [51,52,57,59,62,63,65,69,71-73,77-79,82,85], 12 on both obese and overweight [32,47,49,55,60,62,74,75,80,81,83,84], 5 on both normal weight and overweight [33,66,67,70,76]. Finally, the studies were on healthy subjects, with the exception of few articles in which subjects were affected by the following pathologies: chronic osteoarthritis [64]; metabolic syndrome [59]; hyperinsulinemia [58,72], polycystic ovary syndrome [49], type 2 diabetes [84]. Hence, the meta-analysis was based on 43 studies and analysed a total of 2094 subjects. Before analyses, all studies were stratified for gender, healthy status, time of treatment and percentage of calorie reduction and the main characteristics of the included studies were reported in Table 2. Calorie restriction, intermittent or alternate-day-fasting and low calorie diet interventions were overall grouped in dietary restriction (DR) category.
Table 1. Selected biomarkers and number of the studies included in meta-analysis.
| Biomarkers | n. of the studies |
| Fat Mass (total and visceral) | 38 |
| Adipokines (adiponectin and leptin) | 22 |
| IGFBPs (IGFBP-1, -2, -3) | 6 |
| IGF-1 | 4 |
| HOMA-Index | 17 |
| Insulin | 34 |
| Inflammation (TNFa, IL-1, IL-6, CRP) | 17 |
| DHEA | 5 |
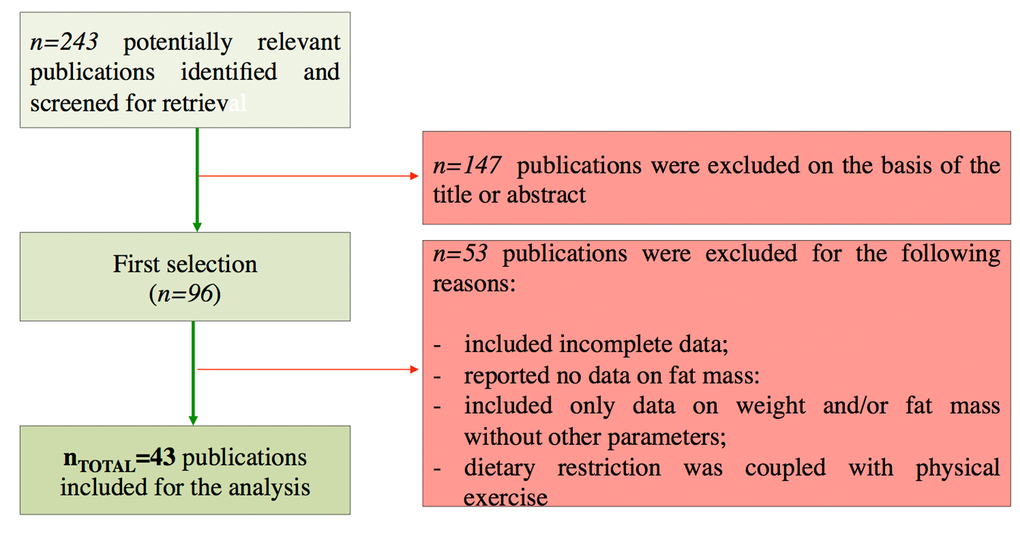
Figure 10. Flow chart of the study identification and selection.
Table 2. Characteristics of the included studies for the meta-analyses.
| Study Design | Gender Stratification | Healthy Status Stratification | Time of Treatment |
| Unrandomized | Randomized or Controlled | Randomized and Controlled | Cross-Sectional | Yes | No | Yes | No | Brief
(<3 months) | Long-Term
(>3 months) |
| | | | | | | | | |
| 4 | 14 | 23 | 2 | 16 | 27 | 36 | 2 | 26 | 16 |
Data analysis
Relevant data of the 43 studies available were entered for formal meta-analytic evaluation into the Comprehensive Meta-Analysis software (Biostat) [86]. Data analysis was performed as previously described [87]. In particular, for the results showed as post-data only, we selected mean, standard deviation and sample size in each group, or difference in means, sample size and p value between groups. When results were reported as pre- and post-data, we used mean, standard deviation, sample size in each group and correlation between baseline and end-point intervention period, or mean change, standard deviation difference, sample size in each group, correlation between baseline and end-point intervention period. For observational studies considering only one group (pre–post-intervention data), we used mean difference, standard deviation of difference and sample size. In all studies, we assumed the correlation between baseline and end-point study period to be 0.5 to produce the most conservative estimate [37,88], To enable a joint comparison, the standardized difference in mean (SDM) was calculated for each outcome. In our analysis, positive SDM indicates increased effect size of calorie restriction on outcome considered. The effect sizes of the included studies were pooled both under a ‘fixed effects model’ or ‘random effect model’. Under fixed effects model we assumed that the true effect is the same in all studies. By contrast, under the random-effects model we allowed that the true effect may vary from one study to the next [37]. Fixed or random effect model was selected following evaluation of heterogeneity between studies based on the I2 test for heterogeneity. When I2 values were low, we selected a fixed effects model, whereas random effects model was selected for I2 values higher than 75%.