Study characteristics
According to our inclusion criteria, 18 studies from 15 articles containing 13,716 cancer patients and 15,590 cancer-free controls were finally included. The detail screening process was exhibited in Figure 1. It contained four separate studies in Song’s articles focusing on breast cancer and ovarian cancer.
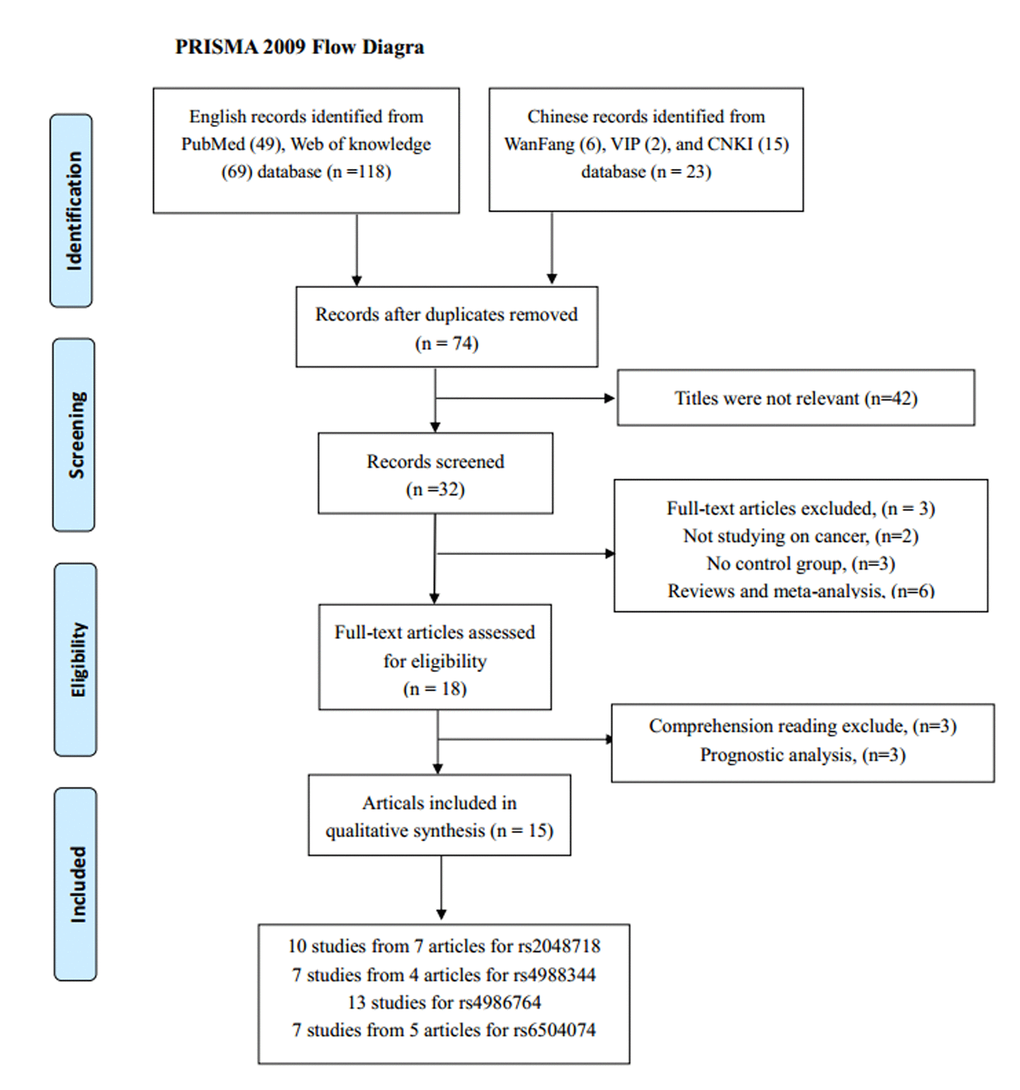
Figure 1. The flow diagram of the meta-analysis. CNKI: China National Knowledge Infrastructure.
Among the 18 eligible studies, 11 were conducted in Caucasian populations from the UK, Italy, Germany, USA, Canada, Denmark, Cyprus, and Finland. Five studies were on Asian background and all samples were Chinese. And one study was performed on mixed population. All the studies were case-control design, studying on various cancer types including breast, ovarian, cervical, gastric and prostate cancer. Table 1 listed the main characteristics of all included studies.
Table 1. Characteristics of the studies included in the meta-analysis.
| Study | Year | Country | Ethnicity | Cancer type | Genotyping medthod | Source of
control | Case/Control | SNP No. |
| Carrera-Lasfuentes [20] | 2017 | Spain | Mixed | GC | QIAamp | Population | 598/601 | 3 |
| Zhou [21] | 2014 | China | Asian | CC | MassARRAY | Population | 309/315 | 1, 3 |
| Ren [14] | 2013 | China | Asian | BC | Mass ARRAY | Hospital | 319/306 | 1,2,3,4 |
| Ma 1 [6] | 2013 | China | Asian | CC | Mass ARRAY | Population | 454/562 | 1,2,3,4 |
| Ma 2 [5] | 2013 | China | Asian | CC | Mass ARRAY | Hospital | 298/286 | 1,2,3,4 |
| Silvestri [22] | 2011 | Italy | Caucasian | BC | PCR-SSCP | Hospital | 97/203 | 3 |
| Loizidou [23] | 2010 | Cyprus | Caucasian | BC | MassArray | Population | 1108/1170 | 3 |
| Huo [24] | 2009 | China | Asian | BC | PCR-PIRA | Population | 568/624 | 3 |
| Kote-Jarai [9] | 2009 | UK | Caucasian | PC | TaqMan | Population | 1841/1880 | 4 |
| Guénard [25] | 2008 | Canada | Caucasian | BC | PCR-RFLP | Hospital | 96/70 | 1,3 |
| Song 1 [4] | 2007 | UK | Caucasian | BC | TaqMan | Population | 2270/2280 | 1,2 |
| Song 2 [4] | 2007 | UK | Caucasian | OC | TaqMan | Population | 730/855 | 1,2,4 |
| Song 3 [4] | 2007 | USA | Caucasian | OC | TaqMan | Population | 327/429 | 1,2,4 |
| Song 4 [4] | 2007 | Denmark | Caucasian | OC | TaqMan | Population | 456/1231 | 1,2,4 |
| Frank [26] | 2007 | Germany | Caucasian | BC | TaqMan | Population | 571/712 | 1,3 |
| Garcia-Closas [20] | 2006 | Mixed | Caucasian | BC | qPCR | Population | 1596/1254 | 3 |
| Vahteristo [27] | 2006 | Finland | Caucasian | BC | TaqMan | Population | 866/731 | 3 |
| Seal [28] | 2006 | UK | Caucasian | BC | Pyrosequencing | Population | 1212/2081 | 3 |
| Abbreviations BC: breast cancer; CC: cervical cancer; PC: Prostate cancer; OC: ovarian cancer; PCR: polymerase chain reaction; RFLP: restriction fragment length polymorphism. PIRA: PCR-primer introduced restriction analysis; DHPLC, denaturing high -performance liquid chromatography; SSCP: single strand conformation polymorphism; SNP: single-nucleotide polymorphisms; SNP No.1: rs2048718; 2: rs4988344; 3: rs4986764; 4.rs6504074 |
Quantitative synthesis of the four polymorphisms
As Table 2 showed, the frequencies of the minor allele (MAF) in the cancer-free controls varied widely across included studies, ranging from 0.23 to 0.62 for rs2048718, 0.14 to 0.62 for rs4988344, 0.26 to 0.60 for rs4986764, and 0.24 to 0.28 for rs6504074. The average frequencies of the minor allele for the four abovementioned polymorphisms were 0.39, 0.35, 0.40, and 0.26, respectively.
Table 2. BRIP1 polymorphisms Genotype Distribution and Allele Frequency in this meta-analysis.
| Study | Genotype (N) | Allele frequency (N) | MAF | |
| Case | Control | Case | Control | HWE |
| total | AA | AB | BB | total | AA | AB | BB | A | B | A | B | |
| rs2048718 | |
| Zhou 2014 | 309 | 196 | 94 | 19 | 314 | 183 | 118 | 13 | 486 | 132 | 484 | 144 | 0.23 | 0.26 |
| Ren 2013 | 319 | 201 | 98 | 20 | 305 | 177 | 115 | 13 | 500 | 138 | 469 | 141 | 0.23 | 0.29 |
| Ma 1 2013 | 454 | 285 | 141 | 28 | 560 | 326 | 208 | 26 | 711 | 197 | 860 | 260 | 0.25 | 0.32 |
| Ma 2 2013 | 298 | 188 | 92 | 18 | 285 | 166 | 106 | 13 | 468 | 128 | 438 | 132 | 0.23 | 0.45 |
| Guénard 2008 | 96 | 38 | 41 | 17 | 70 | 23 | 32 | 15 | 117 | 75 | 78 | 62 | 0.41 | 0.54 |
| Song 1 2007 | 2170 | 655 | 1063 | 452 | 2264 | 655 | 1151 | 458 | 2373 | 1967 | 2461 | 2067 | 0.47 | 0.24 |
| Song 2 2007 | 722 | 236 | 341 | 145 | 847 | 246 | 425 | 176 | 813 | 631 | 917 | 777 | 0.50 | 0.76 |
| Song 3 2007 | 322 | 91 | 157 | 74 | 421 | 131 | 195 | 95 | 339 | 305 | 457 | 385 | 0.51 | 0.17 |
| Song 4 2007 | 429 | 118 | 215 | 96 | 1209 | 352 | 632 | 225 | 451 | 407 | 1336 | 1082 | 0.62 | 0.05 |
| Frank 2007 | 571 | 181 | 283 | 107 | 712 | 228 | 340 | 144 | 645 | 497 | 796 | 628 | 0.49 | 0.40 |
| rs4988344 |
| Ren 2013 | 319 | 65 | 145 | 109 | 306 | 43 | 148 | 115 | 275 | 363 | 234 | 378 | 0.62 | 0.67 |
| Ma 1 2013 | 454 | 92 | 207 | 155 | 562 | 84 | 270 | 208 | 391 | 517 | 438 | 686 | 0.61 | 0.81 |
| Ma 2 2013 | 297 | 60 | 136 | 101 | 286 | 42 | 138 | 106 | 256 | 338 | 222 | 350 | 0.61 | 0.79 |
| Song 1 2007 | 2189 | 1552 | 585 | 52 | 2278 | 1609 | 616 | 53 | 3689 | 689 | 3834 | 722 | 0.16 | 0.51 |
| Song 2 2007 | 729 | 498 | 203 | 28 | 848 | 589 | 239 | 20 | 1199 | 259 | 1417 | 279 | 0.16 | 0.46 |
| Song 3 2007 | 323 | 228 | 86 | 9 | 427 | 309 | 103 | 15 | 542 | 104 | 721 | 133 | 0.16 | 0.09 |
| Song 4 2007 | 278 | 188 | 82 | 8 | 712 | 526 | 174 | 12 | 458 | 98 | 1226 | 198 | 0.14 | 0.58 |
| rs4986764 |
| Carrera-Lasfuentes 2017 | 598 | 232 | 297 | 69 | 601 | 224 | 270 | 107 | 761 | 435 | 718 | 484 | 0.40 | 0.11 |
| Zhou 2014 | 309 | 164 | 116 | 29 | 315 | 136 | 146 | 33 | 444 | 174 | 418 | 212 | 0.34 | 0.50 |
| Ren 2013 | 319 | 168 | 120 | 31 | 306 | 132 | 141 | 33 | 456 | 182 | 405 | 207 | 0.34 | 0.61 |
| Ma 1 2013 | 454 | 247 | 165 | 42 | 562 | 240 | 258 | 64 | 659 | 249 | 738 | 386 | 0.34 | 0.67 |
| Ma 2 2013 | 298 | 160 | 110 | 28 | 286 | 122 | 132 | 32 | 430 | 166 | 376 | 196 | 0.34 | 0.68 |
| Silvestri 2011 | 97 | 37 | 49 | 11 | 203 | 82 | 95 | 26 | 123 | 71 | 259 | 147 | 0.36 | 0.85 |
| Loizidou 2010 | 1108 | 465 | 502 | 141 | 1170 | 475 | 534 | 161 | 1432 | 784 | 1484 | 856 | 0.37 | 0.58 |
| Huo 2009 | 568 | 308 | 227 | 33 | 624 | 345 | 232 | 47 | 843 | 293 | 922 | 326 | 0.26 | 0.36 |
| Guénard 2008 | 96 | 18 | 48 | 30 | 70 | 12 | 32 | 26 | 84 | 108 | 56 | 84 | 0.60 | 0.69 |
| Frank 2007 | 571 | 181 | 295 | 95 | 712 | 226 | 365 | 121 | 657 | 485 | 817 | 607 | 0.43 | 0.20 |
| Garcia-Closas 2006 | 1596 | 529 | 761 | 306 | 1254 | 406 | 612 | 236 | 1819 | 1373 | 1424 | 1084 | 0.43 | 0.84 |
| Vahteristo 2006 | 866 | 184 | 428 | 254 | 731 | 148 | 382 | 201 | 796 | 936 | 678 | 784 | 0.54 | 0.17 |
| Seal 2006 | 1212 | 462 | 549 | 201 | 2081 | 783 | 970 | 328 | 1473 | 951 | 2536 | 1626 | 0.39 | 0.34 |
| rs6504074 |
| Ren 2013 | 319 | 203 | 95 | 21 | 304 | 176 | 110 | 18 | 501 | 137 | 462 | 146 | 0.24 | 0.88 |
| Ma 1 2013 | 454 | 288 | 137 | 29 | 558 | 317 | 205 | 36 | 713 | 195 | 839 | 277 | 0.25 | 0.71 |
| Ma 2 2013 | 298 | 188 | 92 | 18 | 284 | 162 | 104 | 18 | 468 | 128 | 428 | 140 | 0.25 | 0.81 |
| Kote-Jarai 2009 | 1841 | 963 | 727 | 151 | 1880 | 1031 | 727 | 122 | 2653 | 1029 | 2789 | 971 | 0.26 | 0.68 |
| Song 2 2007 | 725 | 417 | 270 | 38 | 847 | 457 | 325 | 65 | 1104 | 346 | 1239 | 455 | 0.27 | 0.50 |
| Song 3 2007 | 324 | 170 | 117 | 37 | 421 | 225 | 156 | 40 | 457 | 191 | 606 | 236 | 0.28 | 0.09 |
| Song 4 2007 | 260 | 137 | 104 | 19 | 650 | 340 | 258 | 52 | 378 | 142 | 938 | 362 | 0.28 | 0.76 |
| Abbreviations A: the major allele, B: the minor allele. MAF: minor allele frequencies. |
Table 3 listed the results of this meta-analysis. There were 10 studies with 5,690 cancer patients and 6,087 healthy individuals for rs2048718. As displayed in Table 3 and Figure 2, rs2048718 polymorphism had a decrease risk of overall cancer based on the heterozygous and dominant models (AB vs. AA: OR = 0.90, 95% CI = 0.83–0.97, P = 0.008; AB+BB vs. AA: OR = 0.92, 95%CI = 0.86–0.99, P = 0.037). In the stratified analysis by ethnicity, the results showed significant associations between rs2048718 and cancer risk in the Asian population by heterozygous and dominant comparison (AB vs. AA: OR = 0.76, 95% CI = 0.65–0.89, P = 0.001; AB+BB vs. AA: OR = 0.82, 95%CI = 0.70–0.95, P = 0.008), while no association was found among Caucasians. However, in the stratified analysis by cancer types, we found a decrease risk between rs2048718 and cervical cancer under heterozygous and dominant model (AB vs. AA: OR = 0.76, 95% CI = 0.64–0.91, P = 0.003; AB+BB vs. AA: OR = 0.82, 95%CI = 0.69–0.97, P = 0.021), and the results showed no significant difference between rs2048718 polymorphism and gynecologic (breast and ovarian) cancer susceptibility.
Table 3. Meta-analysis results.
| Comparisons | B vs A | BB vs AA | AB vs AA | BB vs AA+AB | AB+BB vs AA |
| OR (95%CI) | P | OR (95%CI) | P | OR (95%CI) | P | OR (95%CI) | P | OR (95%CI) | P |
| rs2048718 | 0.98(0.93–1.03) | 0.408 | 1.02(0.92–1.14) | 0.704 | 0.90(0.83–0.97) | 0.008 | 1.05 (0.96–1.16) | 0.269 | 0.92(0.86–0.99) | 0.037 |
| Caucasian | 0.99(0.89–1.12) | 0.921 | 0.99(0.89–1.12) | 0.921 | 0.95(0.86–1.04) | 0.274 | 1.03 (0.93–1.14) | 0.595 | 0.96(0.88–1.05) | 0.381 |
| Asian | 0.91(0.81–1.04) | 0.160 | 1.28(0.92–1.80) | 0.147 | 0.76(0.65–0.89) | 0.001 | 1.42 (1.02–1.97) | 0.040 | 0.82(0.70–0.95) | 0.008 |
| CC | 0.91(0.79–1.05) | 0.209 | 1.26(0.86-1.85) | 0.228 | 0.76(0.64-0.91) | 0.003 | 1.39(0.96–2.03) | 0.084 | 0.82(0.69-0.97) | 0.021 |
| BC | 0.98(0.91–1.05) | 0.479 | 0.98(0.85–1.13) | 0.771 | 0.92(0.82-1.03) | 0.151 | 1.02 (0.90–1.15) | 0.820 | 0.94(0.84–1.04) | 0.21 |
| OC | 1.01(0.92-1.11) | 0.772 | 1.04(0.86–1.26) | 0.665 | 0.96(0.82-1.11) | 0.563 | 1.07(0.91-1.26) | 0.410 | 0.98(0.85-1.13) | 0.775 |
| rs4988344 | 0.97(0.87–1.09) | 0.620 | 0.89(0.67–1.18) | 0.418 | 0.94(0.80–1.10) | 0.441 | 0.95(0.82-1.10) | 0.468 | 0.93(0.79–1.11) | 0.430 |
| Caucasian | 1.03(0.93-1.14) | 0.533 | 1.18(0.89–1.57) | 0.260 | 1.03(0.93–1.14) | 0.533 | 1.17(0.88–1.55) | 0.282 | 1.44 (0.99–2.08) | 0.38 |
| Asian | 0.68(0.54-0.86) | 0.001 | 0.66(0.52–0.85) | 0.001 | 0.68 (0.54–0.86) | 0.001 | 0.88 (0.74–1.04) | 0.132 | 0.78 (0.62–0.97) | <0.001 |
| BC | 0.92(0.77-1.11) | 0.395 | 0.81(0.51-1.30) | 0.391 | 0.85(0.57-1.25) | 0.405 | 0.93(0.72-1.19) | 0.542 | 0.87(0.56-1.34) | 0.519 |
| OC | 1.14(0.99-1.30) | 0.063 | 1.41(0.92-2.14) | 0.114 | 1.11(0.94-1.30) | 0.211 | 1.37(0.90-2.09) | 0.139 | 1.63(0.98-2.72) | 0.059 |
| rs4986764 | 0.94(0.90-0.98) | 0.001 | 0.90(0.82–0.99) | 0.024 | 0.89 (0.80–0.99) | 0.025 | 0.95 (0.87–1.03 | 0.203 | 0.88(0.80–0.97) | 0.009 |
| Caucasian | 0.99(0.94–1.04) | 0.700 | 0.98(0.88–1.10) | 0.779 | 0.96 (0.89–1.05) | 0.361 | 1.01 (0.92–1.12) | 0.781 | 0.97 (0.90–1.05) | 0.426 |
| Chinese | 0.81(0.73–0.89) | 0.004 | 0.71 (0.56-0.88) | 0.002 | 0.73 (0.57–0.93) | 0.011 | 0.82(0.66–1.02) | 0.072 | 0.72(0,59-0.90) | 0.004 |
| CC | 0.74(0.65-0.84) | <0.001 | 0.67(0.50-0.89) | 0.006 | 0.64 (0.53-076) | <0.001 | 0.83(0.63-1.09) | 0.175 | 0.64 (0.54–0.77) | <0.001 |
| BC | 0.98(0.93–1.03) | 0.406 | 0.96(0.87–1.07) | 0.481 | 0.96 (0.89–1.03) | 0.253 | 1.00 (0.91–1.09) | 0.958 | 0.96(0.89–1.03) | 0.244 |
| rs6504074 | 0.96(0.85–1.09) | 0.556 | 1.04(0.89–1.23) | 0.614 | 0.94 (0.87–1.03) | 0.197 | 1.06 (0.91–1.25) | 0.457 | 0.92(0.79–1.08) | 0.298 |
| Caucasian | 1.09 (1.00-1.21) | 0.059 | 1.01(0.70–1.44) | 0.978 | 1.02 (0.92–1.12) | 0.766 | 1.01 (0.73–1.40) | 0.953 | 1.08(0.97–1.20) | 0.171 |
| Chinese | 0.84(0.73–0.97) | 0.016 | 0.91(0.64–1.30) | 0.610 | 0.75(0.62–0.89) | 0.002 | 1.01(0.71-1.43) | 0.939 | 0.77(0.65–0.91) | 0.003 |
| OC | 1.02(0.87–1.20) | 0.787 | 0.86(0.65–1.13) | 0.269 | 0.95 (0.82–1.11) | 0.513 | 0.87(0.67–1.14) | 0.325 | 1.01 (0.83–1.24) | 0.911 |
| GC | 0.90(0.82-0.98) | 0.015 | 0.88(0.71-1.09) | 0.236 | 0.86(0.77-0.97) | 0.011 | 0.92(0.75-1.14) | 0.463 | 0.86(0.77-0.96) | 0.008 |
| Abbreviations A: the major allele; B: the minor allele; CI: confidence interval; OR: odds ratio; GC: gynecologic cancer; BC: breast cancer;OC: ovarian cancer. |
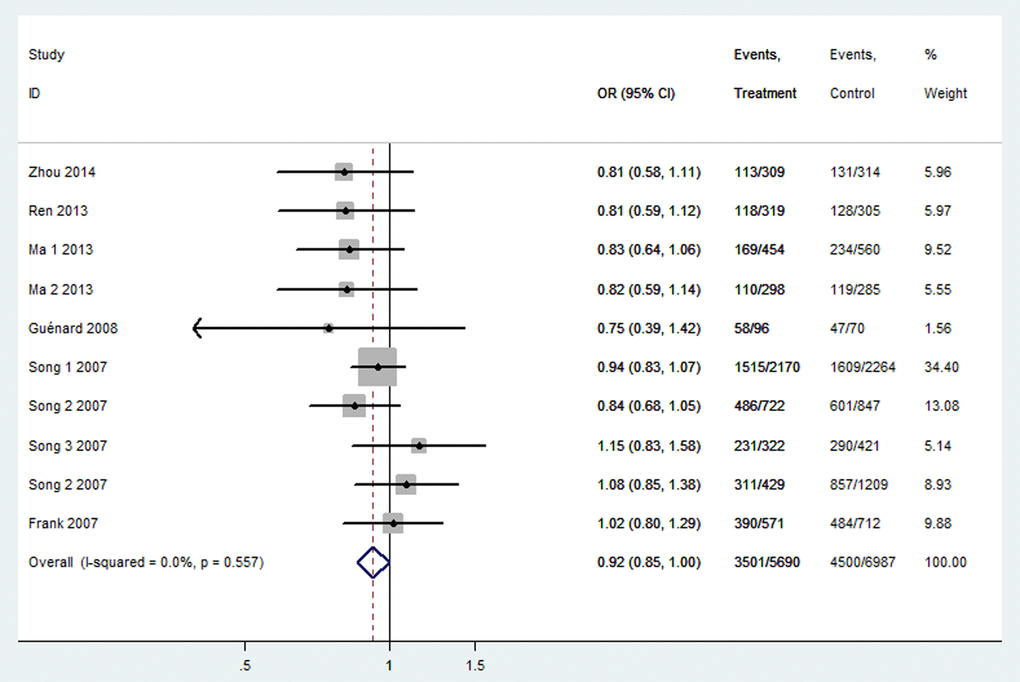
Figure 2. Forest plot of OR with 95%CI for the BRIP1 polymorphisms with cancer risk under dominant model rs2048718. CI: confidence interval, OR: odds ratio.
There were 7 studies containing 4,589 cancer cases and 5,419 cancer-free controls for rs4988344. As shown in Table 3, The pooled analysis displayed no association of any genetic models and overall cancer risk (All P > 0.05). In subgroup analysis by ethnicity, we detected a significant association among Chinese people in four genetic models (B vs. A: OR = 0.68, 95% CI = 0.54–0.86, P = 0.001; BB vs. AA: OR = 0.66, 95% CI = 0.54–0.86, P = 0.001; AB vs. AA: OR = 0.88, 95% CI = 0.54–0.86, P = 0.001; AB+BB vs. AA: OR = 0.78, 95% CI = 0.63–0.97, P < 0.001).
Thirteen studies covering 8,092 cases and 8,915 controls were pooled to evaluate the correlation of rs4986764 and cancer risk. Showing in Table 3 and Figure 3, rs4986764 was associated to reduce cancer risk among the overall population by allele comparison (OR = 0.94, 95% CI = 0.90–0.98, P = 0.001), heterozygous comparison (OR = 0.89, 95% CI = 0.80–0.99, P = 0.025), and dominant comparison (OR = 0.88, 95% CI = 0.80–0.97, P = 0.009). Stratified analysis by ethnicity also displayed significant differences in Chinese population (B vs. A: OR = 0.81, 95% CI = 0.73–0.89, P = 0.004; BB vs. AA: OR = 0.71, 95% CI = 0.56–0.88, P = 0.005; AB vs. AA: OR = 0.77, 95% CI = 0.57–0.93, P = 0.011; AB+BB vs. AA: OR = 0.72, 95% CI = 0.59–0.90, P = 0.004). However, there was no significant correlation found in Caucasians for all genetic models (all P > 0.05). In the stratified analysis by cancer types, all genetic models failed to detect significant correlations in breast cancer. However, a statistical significance suggested that rs4986764 polymorphism may decrease cervical cancer risk (B vs. A: OR = 0.74, 95% CI = 0.65–0.84, P < 0.001; BB vs. AA: OR = 0.67, 95% CI = 0.50–0.89, P = 0.006; AB vs. AA: OR = 0.64, 95% CI = 0.53–0.76, P < 0.001; AB+BB vs. AA: OR = 0.64, 95% CI = 0.54–0.77, P = 0.0001).
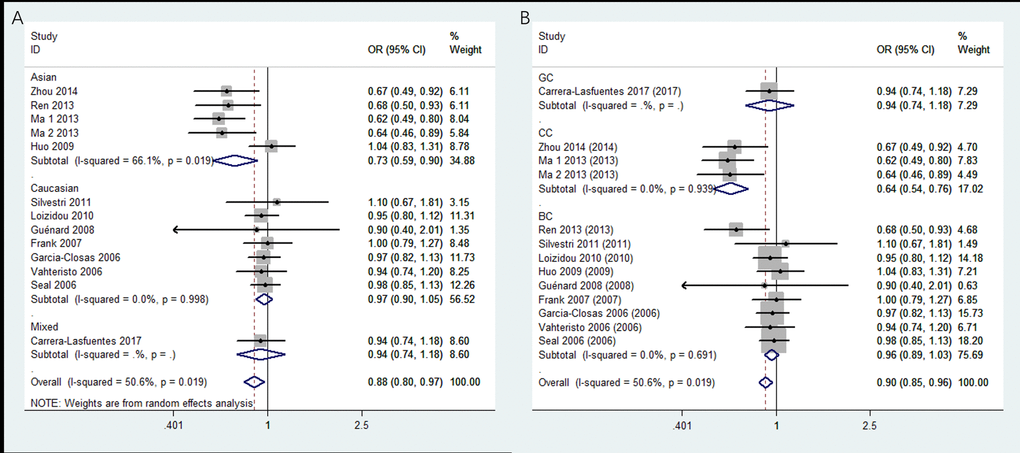
Figure 3. Stratified analysis based on ethnicity for the association between BRIP1 rs4986764 polymorphism and cancer risk using dominant model. (A) based on ethnicity; (B) based on cancer type. CI: confidence interval, OR: odds ratio.
A total of 7 studies for rs6504074 included 4,221 cases and 4,944 controls. As shown in Table 3, the overall analysis showed no association between rs6504074 between cancer risk in any genetic models (All P﹥0.05). But, further stratification analysis by ethnicity indicated that rs6504074 was significantly associated with a lower cancer risk among Chinese population by three models (B vs. A: OR = 0.84, 95% CI = 0.73–0.97, P = 0.016; AB vs. AA: OR = 0.75, 95% CI = 0.62–0.89, P = 0.002; BB + AB vs. AA: OR = 0.77, 95% CI = 0.65–0.91, P = 0.003). The subgroup analysis by cancer type of rs6504074 also showed a reduced risk for gynecologic cancers in allele model (OR = 0.90, 95% CI = 0.82–0.98, P = 0.015), heterozygous model (OR = 0.88, 95% CI = 0.77–0.97, P = 0.011), and dominant model (OR = 0.86, 95% CI = 0.77–0.96, P = 0.008).