


Introduction
Epigenetics refers to the molecular mechanisms regulating gene expression without changing the DNA sequence [1]. The mostly studied epigenetic marker is DNA methylation, the presence of methyl groups at CpG dinucleotides [2]. Previous evidence suggested that global levels of DNA methylation increased over the first few years of life [3] and then decreased in late adulthood [4,5], suggesting that epigenetic modifications might play a vital role in the human’s aging process [6,7].
A growing body of evidence confirmed the presence of age-related epigenome-wide DNA methylation patterns [8,9]. It has been shown that the methylation levels at specific age-related CpG sites represent stable and reproducible biomarkers of age. Several studies have identified age-related CpG sites in blood, but the results are inconsistent [9–16]. The age prediction model using a group of age-specific CpG sites has been widely used in adults and newborns for age prediction [14,17]. However, the age prediction model for children and adolescents using DNA methylation biomarkers was scarce [9].
It has been revealed that age-related DNA methylation changed more rapidly during childhood and adolescence. DNA methylation studies should be matched carefully to age [3,18]. It is unknown whether the accuracy and precision of age prediction model in adults would be affected when used among children and adolescents. The DNA methylation age (DNAm age) has been proved to be associated with cancer and mortality [19,20]. The accurate age prediction among children could potentially be applied to understand the development mechanism of children and to predict the risk of age-related phenotypes and diseases in adulthood. Therefore, in the present study, we aimed to develop an age prediction model for children and adolescents using DNA methylation data of over 850,000 CpG sites from the Chinese National Twin Registry.
Results
The basic characteristics of the participants are shown in Table 1. In the present study, 179 samples and 817,471 CpG sites passed quality control (QC) in the training and testing dataset (N=90 and N=89 respectively). In total, the study consisted of 101 male and 78 female singletons with an age range from 6 to 17 years (mean 10.7). The quality control results are provided in Figure S1 and Table S2 in supplements.
Table 1. The number, gender and zygosity distribution of subjects by age.
| Age, y | No. of all | Boys, No. (%) | MZ, No. (%) | ||||||||||||||||||||||||||||||||||||||||||||||||||||||||||||||||||||||||||||||||||||||||||||||||
| 6 | 3 | 0 (0) | 3 (100) | ||||||||||||||||||||||||||||||||||||||||||||||||||||||||||||||||||||||||||||||||||||||||||||||||
| 7 | 20 | 13 (65) | 8 (40) | ||||||||||||||||||||||||||||||||||||||||||||||||||||||||||||||||||||||||||||||||||||||||||||||||
| 8 | 14 | 8 (57) | 8 (57) | ||||||||||||||||||||||||||||||||||||||||||||||||||||||||||||||||||||||||||||||||||||||||||||||||
| 9 | 24 | 12 (50) | 16 (67) | ||||||||||||||||||||||||||||||||||||||||||||||||||||||||||||||||||||||||||||||||||||||||||||||||
| 10 | 30 | 16 (53) | 14 (47) | ||||||||||||||||||||||||||||||||||||||||||||||||||||||||||||||||||||||||||||||||||||||||||||||||
| 11 | 20 | 16 (80) | 10 (50) | ||||||||||||||||||||||||||||||||||||||||||||||||||||||||||||||||||||||||||||||||||||||||||||||||
| 12 | 28 | 14 (50) | 12 (43) | ||||||||||||||||||||||||||||||||||||||||||||||||||||||||||||||||||||||||||||||||||||||||||||||||
| 13 | 10 | 4 (40) | 6 (60) | ||||||||||||||||||||||||||||||||||||||||||||||||||||||||||||||||||||||||||||||||||||||||||||||||
| 14 | 20 | 14 (70) | 8 (40) | ||||||||||||||||||||||||||||||||||||||||||||||||||||||||||||||||||||||||||||||||||||||||||||||||
| 15 | 2 | 1 (50) | 0 (0) | ||||||||||||||||||||||||||||||||||||||||||||||||||||||||||||||||||||||||||||||||||||||||||||||||
| 16 | 6 | 3 (50) | 4 (67) | ||||||||||||||||||||||||||||||||||||||||||||||||||||||||||||||||||||||||||||||||||||||||||||||||
| 17 | 2 | 0 (0) | 2 (100) | ||||||||||||||||||||||||||||||||||||||||||||||||||||||||||||||||||||||||||||||||||||||||||||||||
| Total | 179 | 101 (56) | 91 (51) | ||||||||||||||||||||||||||||||||||||||||||||||||||||||||||||||||||||||||||||||||||||||||||||||||
| a. Age and sex were self-reported by subjects and their parents; | |||||||||||||||||||||||||||||||||||||||||||||||||||||||||||||||||||||||||||||||||||||||||||||||||||
| b. The zygosity was determined from gene detection; | |||||||||||||||||||||||||||||||||||||||||||||||||||||||||||||||||||||||||||||||||||||||||||||||||||
| c. The mean ± SD of age:10.7±2.5 years; MZ: monozygotic twin. | |||||||||||||||||||||||||||||||||||||||||||||||||||||||||||||||||||||||||||||||||||||||||||||||||||
Identification of age-related DNAm sites by EWAS
To determine the age-related DNA methylation sites, we conducted an epigenome-wide association study (EWAS) and fitted a linear mixed-effects regression model, adjusting for sex and surrogate variables as fixed effects and family ID as a random effect. Overall, 6,350 sites of them (0.78%) were significantly related with chronological age in the EWAS (FDR < 0.05, Figure 1) and they were then selected for the subsequent prediction modeling. 116 out of the 6,350 CpG sites were confirmed given the public accessible dataset "GSE27097". It can be downloaded from the PubMed (https://www.ncbi.nlm.nih.gov/geo/query/acc.cgi?acc=GSE27097), which have focused on the age-related DNA methylation sites by Illumina 27K Beadchip among children aged 3 to 17 years old. Detailed accounts of the individual aging markers and their genomic features are presented in the Table S1 and Table S2.
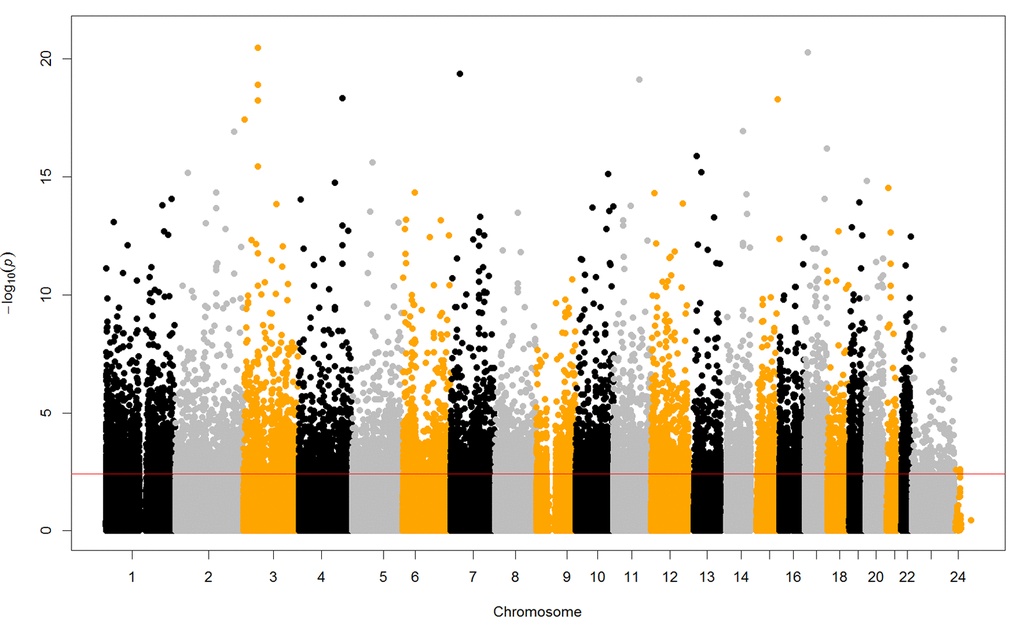
Figure 1. Manhattan plot of epigenome-wide DNA methylation analysis and chronological age. The red horizontal line indicating the P values reached the significant level of FDR < 0.05. The epigenome-wide analysis identified 6,350 CpG sites related with age.
Predicting DNA methylation age in training data
In the training dataset, elastic net regression was performed, and it finally screened a set of 83 CpG sites (Table S3) predictive of age from the 6,350 age-related CpG sites. The correlation between the resulting predictor (DNAm age) and chronological age was 0.99 (P<2.20E-16; Figure 2a). The error (median absolute difference) of chronological age was only 0.23 years. In the sensitive analysis, we further added sex as covariate in elastic net regression model. The variable of sex was excluded from the model automatically, and the final predictive model was stable with 83 CpG sites above.
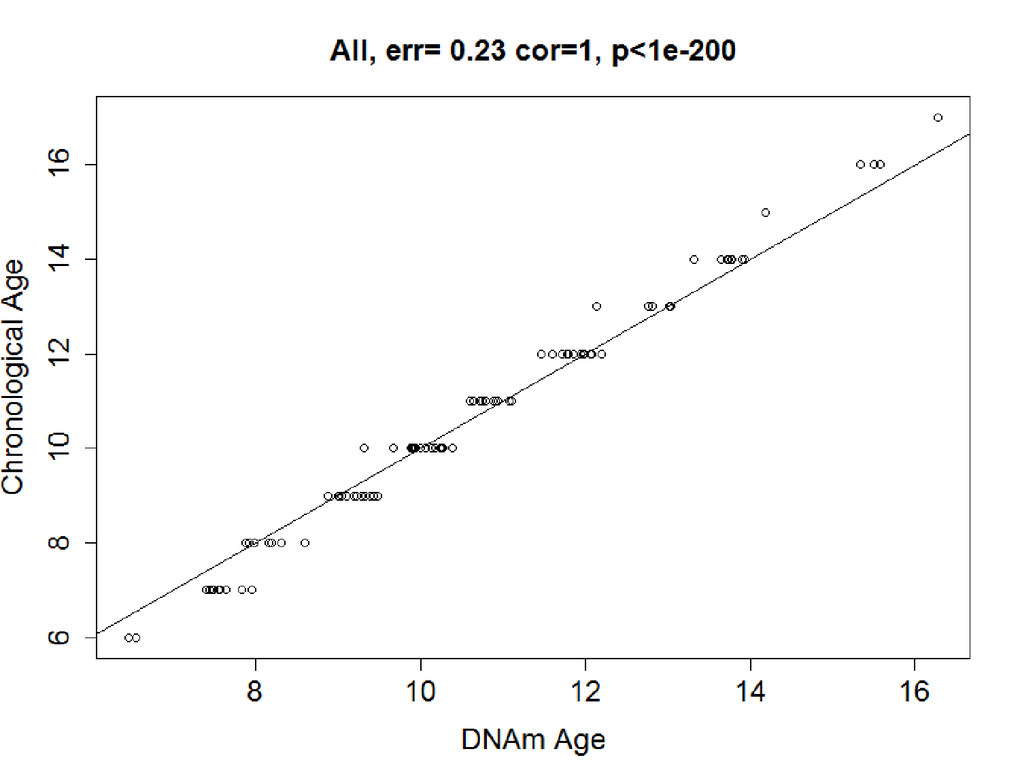
Figure 2a. Correlation between Chronological age and DNAm age. In the training data, chronological age and DNAm age were highly correlated in the training dataset: r = 0.99, median error = 0.23 years.
Among the age predictive features, 21 CpG sites were positively correlated with age while 62 CpG sites were negatively correlated with age (Table S 3). Nearly half markers in the model lay within or near genes with known functions, such as diabetes, cancer, neurons function, oxidative stress, DNA damage, and other age-related conditions. 49 of the 83 age-predictive CpG sites were newly identified probes not existing on the 450K BeadChip array. The top 20 CpG sites with the largest predicted effect values were presented in Table 2. All the absolute coefficient values of the upper most 20 sites were over two, and all of them located on autosomal chromosomes. The largest coefficient effect was observed for cg00497086 (coefficient value=10.0) located in the body of the PRKCB (protein kinase C beta) gene on chromosome 16 and in the open sea. It was a new probe on the 850K Beadchip and related to familial Meniere's disease and diabetes.
Table 2. The top 20 chronological age predictive CpGs in the model.
| Probename | CHR | Gene Name | Gene Group | Relation to CpG Island | Coefficient Values | Methylation β Values, means (SD) | |||||||||||||||||||||||||||||||||||||||||||||||||||||||||||||||||||||||||||||||||||||||||||||
| cg00497086 | 16 | PRKCB | Body | Open Sea | 10.0 | 0.79 (0.02) | |||||||||||||||||||||||||||||||||||||||||||||||||||||||||||||||||||||||||||||||||||||||||||||
| cg01231611 | 1 | REG4 | TSS200 | Open Sea | -9.7 | 0.86 (0.02) | |||||||||||||||||||||||||||||||||||||||||||||||||||||||||||||||||||||||||||||||||||||||||||||
| cg06072257 | 1 | - | Other | Open Sea | -8.6 | 0.68 (0.02) | |||||||||||||||||||||||||||||||||||||||||||||||||||||||||||||||||||||||||||||||||||||||||||||
| cg21242642 | 1 | - | Other | Open Sea | 6.2 | 0.16 (0.02) | |||||||||||||||||||||||||||||||||||||||||||||||||||||||||||||||||||||||||||||||||||||||||||||
| cg06711259* | 22 | JOSD1 | 1stExon | N_Shore | -4.0 | 0.80 (0.02) | |||||||||||||||||||||||||||||||||||||||||||||||||||||||||||||||||||||||||||||||||||||||||||||
| cg00303541* | 3 | GRM2 | 5'UTR | Island | 3.9 | 0.26 (0.04) | |||||||||||||||||||||||||||||||||||||||||||||||||||||||||||||||||||||||||||||||||||||||||||||
| cg03579624* | 3 | - | Other | N_Shore | 3.6 | 0.28 (0.05) | |||||||||||||||||||||||||||||||||||||||||||||||||||||||||||||||||||||||||||||||||||||||||||||
| cg04955914* | 2 | CNPPD1 | Body | N_Shore | -3.5 | 0.58 (0.02) | |||||||||||||||||||||||||||||||||||||||||||||||||||||||||||||||||||||||||||||||||||||||||||||
| cg27406001 | 10 | - | Other | Open Sea | -3.5 | 0.57 (0.05) | |||||||||||||||||||||||||||||||||||||||||||||||||||||||||||||||||||||||||||||||||||||||||||||
| cg10816468 | 6 | - | Other | Open Sea | -3.1 | 0.64 (0.04) | |||||||||||||||||||||||||||||||||||||||||||||||||||||||||||||||||||||||||||||||||||||||||||||
| cg13993467 | 3 | CNTN4 | Body | Open Sea | -2.9 | 0.64 (0.04) | |||||||||||||||||||||||||||||||||||||||||||||||||||||||||||||||||||||||||||||||||||||||||||||
| cg24388008 | 12 | - | Other | Open Sea | -2.7 | 0.10 (0.02) | |||||||||||||||||||||||||||||||||||||||||||||||||||||||||||||||||||||||||||||||||||||||||||||
| cg02772754 | 22 | MED15 | Body | Open Sea | 2.6 | 0.51 (0.04) | |||||||||||||||||||||||||||||||||||||||||||||||||||||||||||||||||||||||||||||||||||||||||||||
| cg07219494* | 5 | - | Other | S_Shelf | -2.5 | 0.71 (0.06) | |||||||||||||||||||||||||||||||||||||||||||||||||||||||||||||||||||||||||||||||||||||||||||||
| cg13274149* | 9 | TOR4A | 3'UTR | Island | 2.4 | 0.35 (0.05) | |||||||||||||||||||||||||||||||||||||||||||||||||||||||||||||||||||||||||||||||||||||||||||||
| cg12642568 | 1 | CALML6 | 5'UTR | N_Shelf | -2.4 | 0.69 (0.02) | |||||||||||||||||||||||||||||||||||||||||||||||||||||||||||||||||||||||||||||||||||||||||||||
| cg13612317* | 10 | KIF5B | TSS1500 | S_Shore | -2.1 | 0.60 (0.04) | |||||||||||||||||||||||||||||||||||||||||||||||||||||||||||||||||||||||||||||||||||||||||||||
| cg07465899* | 4 | - | Other | N_Shore | -2.1 | 0.60 (0.02) | |||||||||||||||||||||||||||||||||||||||||||||||||||||||||||||||||||||||||||||||||||||||||||||
| cg02478540 | 4 | - | Other | Open Sea | -2.0 | 0.20 (0.02) | |||||||||||||||||||||||||||||||||||||||||||||||||||||||||||||||||||||||||||||||||||||||||||||
| cg16119613* | 12 | - | Other | N_Shelf | -2.0 | 0.40 (0.03) | |||||||||||||||||||||||||||||||||||||||||||||||||||||||||||||||||||||||||||||||||||||||||||||
| “-” means not on the known gene. | |||||||||||||||||||||||||||||||||||||||||||||||||||||||||||||||||||||||||||||||||||||||||||||||||||
| “*” means also on the Illumina 450K Beadchip. | |||||||||||||||||||||||||||||||||||||||||||||||||||||||||||||||||||||||||||||||||||||||||||||||||||
The predictive accuracy and validation of the model
The predictive accuracy of the model was tested in 89 co-twin singletons. In the testing dataset, we calculated the DNAm age using the 83 CpGs from the discovery stage, and found that the DNAm age was highly consistent with chronological age, with a correlation of 0.93 and an error of 0.62 years (P< 2.20E-16; Figure 2b).
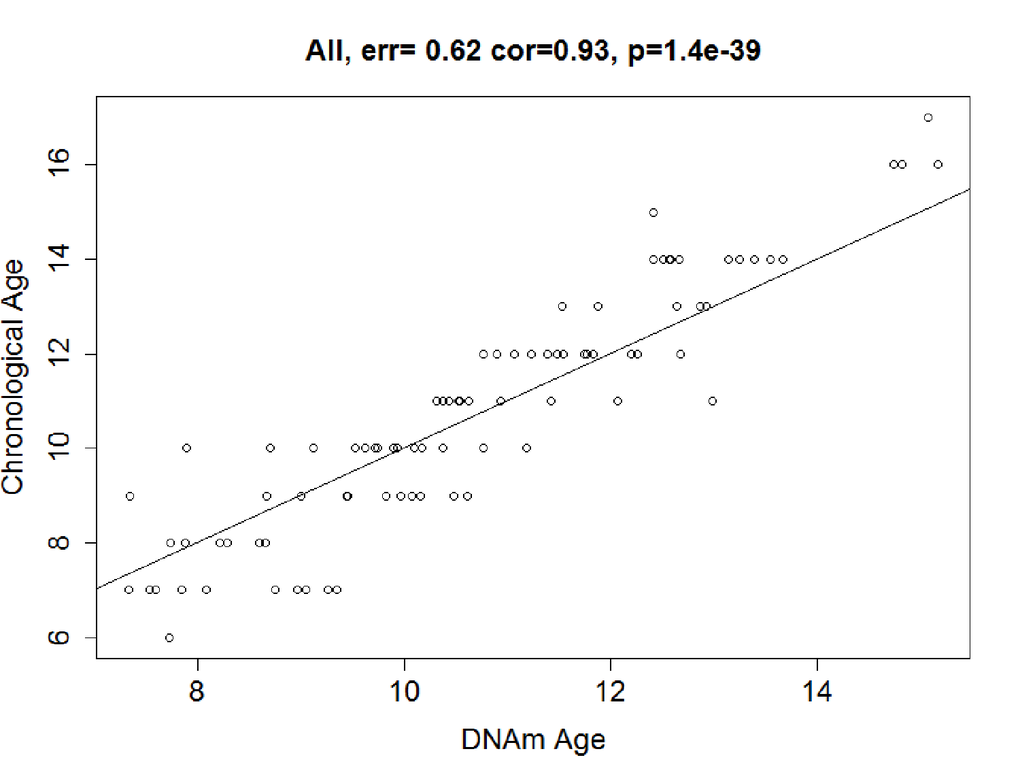
Figure 2b. Correlation between Chronological age and DNAm age. DNAm age were also highly correlated with chronological age in the testing dataset: r = 0.93, median error = 0.64 years. Solid line = regression line.
We further replicated the 110 CpG sites observed in the shrunken age prediction model of Horvath [15,21]. None of them intersected with our 83 DNAm age predictors. Besides, there were only 106 predictors still remaining on the 850K Beadchip. It was unable to achieve similar predictive power using those probes which had a moderate correlation but quite high error with chronological age (correlation = 0.66, error=11.44 years, P<2.2E-16). We did not evaluate the Hannum predictor because some studies suggested it was less accurate than the Horvath age predictor among children [17].
The genomic distribution of age-related CpG sites
The comparison of genomic distribution among the 83 age-predictive features, chronological age-related CpG sites, and all the probes passed QC located on the 850K BeadChip array was shown in Figure 3. With regard to gene structure, we found both the 83 and the 6,350 sites were enriched in gene body regions as all Illumina QC probes (all over 30%), but they accounted for a smaller proportion than all QC probes (P1 =0.23, P2=0.12, Pearson’s Chi-squared test) (Figure 3a). In addition, both the age-predictive CpG sites and the chronological age-related CpG sites spread over the CpG island shores. Although CpG islands were enriched on the 850K array (18.8% of all probes are in CpG islands); only 9.2% of our 6,350 age-related CpGs and 8.4% of the 83 DNAm age predictors were located in CpG islands (both with P <0.05 in Pearson’s Chi-squared test) (Figure 3b). The enrichment GO terms were shown in Table S4. The biological progress included axon guidance, neuron projection guidance and neuron cell-cell adhesion (FDR>0.05).
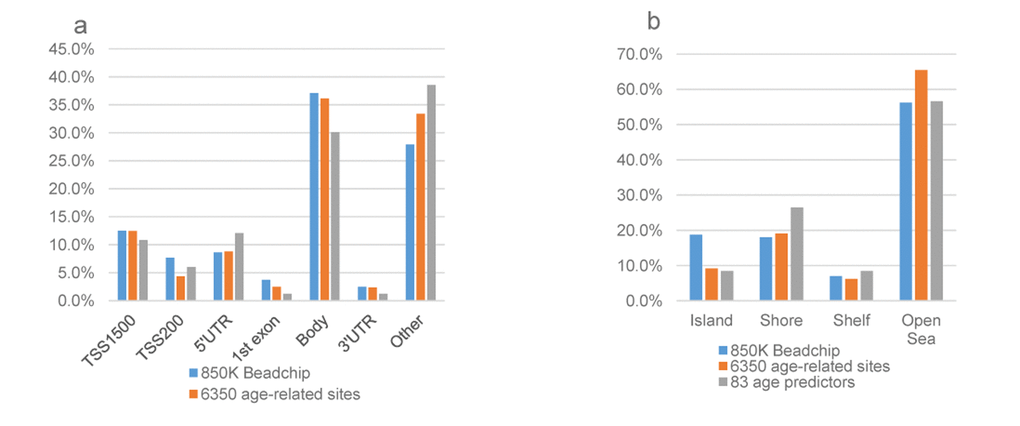
Figure 3. The genomic distribution of age-associated sites compared with all 850K probes passed QC. (a)The gene region distribution: frequency of age-related CpG sites according to the gene location; (b) The CpG islands distribution: frequency of age-related CpG sites according to the proximity to a CpG island. The ordinate represents the % CpG sites. The genomic distributions among the 83 age predictive sites, 6,350 chronological age-related CpG sites, and all the probes passed QC located on the 850 K BeadChip array were different. The annotation to be inside a CpG island was significantly over-represented on the 850k array (18.8%) compared to the 6,350 age-related CpGs and the 83 DNAm age predictors (9.2%, 8.4%), both with P <0.05. There was no differences in the distribution of the CpG sites with regard to other types of genomic distribution. The blue bar represents the all the probes passed QC located on the 850 K BeadChip array; the orange bar represents the 6,350 age-related CpGs; and the grey bar represents the 83 DNAm age predictors.
Discussion
In this study, we identified 6,350 age-related CpG sites from the EWAS among 817,471 QC probes in 179 children (aged 6 to 17 years). In the training dataset, we finally selected 83 novel CpG sites predictive of age from all those age-related CpG sites by elastic net regression. Chronological age of the pediatric population could be accurately predicted by the DNA methylation values of the 83 CpG sites, which provided an accurate prediction of age with a correlation of 0.99 and an error of 0.23 years for the training dataset, with a robust correlation of 0.93 and an error of 0.62 years in the testing dataset.
We retrieved little literature describing the age-related DNA methylation CpG sites in children, and a proper model for pediatric age prediction was lacked [9]. Alisch et al. [18] found significant age-associated changes in DNAm at 2078 loci from 398 boys, aged 3-17 years in peripheral blood DNA, accounting for only 1/3 of our findings. 116 CpG sites were confirmed, and 83 DNAm age predictors were newly identified in the present study. However, our study did not confirm the 110 CpG sites observed in the shrunken prediction model of Horvath [15,21], suggesting that the CpG sites predictive of age in children are different from those age predictors aimed at adults since their correlations are particular to the unique developmental changes of childhood and adolescence [9].
The results represented the highest-resolution collection of DNA methylation data produced for the study of aging in children and adolescents, providing an unprecedented chance to understand the role of DNA methylation in the aging process. The accuracy of this model was similar to a study about the epigenetic clock of gestational age, in which correlations of 0.99 for the training dataset (error=0.35 weeks) and 0.91 for the testing dataset (error=1.24 weeks) were reported for 148 CpG predictors. Moreover, it seemed that the predictive power of DNA methylation was larger at younger ages. Since the prediction errors were less than three years among Horvath's subjects aged from 0 to 100 years and even much larger (error=3.88 years) among Hannum’s study participants aged from 19 to 101 years [14,15].
The age-predicted CpG sites located in genes were related to biological adhesion and cellular progress according to the gene ontology enrichment analysis, but none of them reached the significant level. The top two predictors of age (cg00497086 and cg01231611) belonged to PRKCB and REG4 genes. These two genes are associated with diabetes and cancer, respectively. In fact, many studies have confirmed the correlation between DNA methylation and cancer or chronic diseases, and some of the disease-related methylation sites were associated with age [22–25]. It suggested that the DNA methylation level of critical sites might be a potential mechanism for aging and disease. However, the mechanism of association between age and methylation needs further investigations.
The mechanisms that drive DNA methylation to change with age are not well understood. Previous evidence suggests that both environmental and stochastic factors are associated with aging methylome. It is possible that environmental factors may activate cellular programs associated with changes in the epigenome over time, which at least are partly heritable through cell divisions [26,27]. The accumulation of these external exposures may contribute to DNAm change with age. It is worth noting that spontaneous changes may occur ascribe to disruption of DNA methyl groups or errors during DNA replication, leading to fundamentally unpredictable differences in the methylome [28]. These mechanisms suggest that quantitative measurements of DNAm may identify factors involved in changed rates of aging.
Several strengths of the present study merit consideration. Firstly, the identified age predictive CpG sites were specially performed from pediatric populations aged from 6 to 17 years old. Children and adolescents suffer from less confounding factors in the aspect of medication or smoking, which are more common for adults. To date, the age prediction model for children was sparse [9], and it was inappropriate to directly use the adult DNAm age predictors in childhood. To the best of our knowledge, this was the first study that uncovered new specific age-related DNA methylation sites for age prediction. Our findings improved the accuracy of the model among children whose age-related DNA methylation in blood changed more rapidly. Secondly, the present study used the Illumina 850K Beadchip which covers more DNA metylation sites than the Illumina 27K or 450K Beadchip used in previous studies. With the advance of microarray and next-generation sequencing technologies, the 850K Beadchip has the entire benefits of its predecessor (450K Beadchip) and double the amount of probes [29,30]. Thus, it provides us a more useful method to discover novel age-related DNA methylation patterns. In this study, apart from 2,686 age-related CpG sites that existed on 450K Beadchip, we newly identified over 3,000 novel loci using the 850K Beadchip. Finally yet importantly, we did this research using our first-hand data in Chinese children, instead of datasets on the open database. It was convenient for us to carry out stringent quality control for both samples and probes. Moreover, it added our information and achievement to the global DNA methylation studies and age prediction exploration.
However, there were still some limitations. Firstly, we derived DNA from blood tissues. Even though DNA methylation was known to be tissue and cell specific, it has been revealed that aging was associated with similar methylation pattern across multiple human tissues since aging was a general process affecting all cells [15]. Blood would be a more available tissue in large epidemiological researches. Several studies showed that DNA methylation measured in whole blood could be a marker for less accessible tissues that were directly involved in disease [31–33]. The second limitation was that external replication was unable to perform. Although methylation studies have increased gradually with many open data on GEO database, methylation data in children remain relatively scarce. What’s more, the data available currently was mainly based on the 27K or 450K Beadchip. Most of our identified probes via 850K Beadchip did not exist on those arrays. However, we randomly selected one singleton of a twin pair for training model and his co-twin for validation. As twins share 50%-100% of the genetic background, they can be considered replicates of similar developmental and aging trial [10]. Nevertheless, the generalizability of the results still need to be validated in more study populations with different characteristics.
In summary, our results suggest that the chronological age can be accurately predicted between 6 and 17 years old using the 83 CpG sites. As a biomarker, DNA methylation age has potential applications in research studies of development mechanism, clinical estimation, disease prediction and medicolegal expertise among pediatric population. Further studies with the 850K methylation array are required to test the generalization of this model and help deeply understand the mechanisms of human aging.
Methods
Study participants and design
The data in this study were derived from the Chinese National Twin Registry (CNTR) [34]. We used whole blood samples to assess for epigenome-wide methylation from 180 school age twin individuals (44 monozygotic and 46 dizygotic twin pairs) aged from 6 to 17 years. They were recruited from Beijing, China in 2016, based on the Primary and Secondary School Health Care Center and Disease Control and Prevention Center. The chronological age was measured using the date of birth provided by the parents. In total, 179 of 180 blood samples passed the quality control and retained for the following model training and testing. Written informed consent has been obtained from all participants. The study has been conducted according to principles expressed in the Declaration of Helsinki. Biomedical Ethics Committee at Peking University, Beijing, China approved the study protocol (IRB00001052-15029).
The data were divided into two sets: one of the twins were randomly selected to the discovery group for model training, and the other one of the twins were used for replication. It could help to grasp the characteristics of the model with independent samples and to minimize the effects of data discrepancies by ensuring the similarity between the training and the testing datasets.
Infinium MethylationEPIC BeadChip data
The DNA was extracted from fasting venous blood samples drawn by nurses in the morning (8:00 to 10:30 am). In both the discovery and replication groups, genomic DNA from whole blood was bisulfite treated using the ZYMO EZ DNA Methylation-Gold kit (ZYMO Research Corp, Irvine, CA, USA). Then DNA methylation fraction values were measured with the Illumina Infinium MethylationEPIC BeadChip (Illumina, San Diego, USA) at the EMTD Institute of Biotechnology. This procedure used bisulfate-treated DNA and two site-specific probes for each marker, which bound to the associated methylated and unmethylated sequences.
DNA methylation quality control and processing
The raw intensity files (idat) were imported into the R software and were transformed into β values (range from 0 to 1) using R package minfi [35]. The β values were calculated from the intensity ratio of the methylated signals over the total (methylated and unmethylated) signals for each site, representing the percentage of methylation at a given cytosine for an individual across his blood cells.
Then we performed sample-level and probe-level quality control for filtering as follows. All samples passed the Illumina quality control (Figure S1 QC plot in supplements), and one sample was deleted according to the Multiple Dimension Scale (Figure S2 MDS plot in supplements). Then samples having 1% of sites with a detection p-value greater than 0.01 were removed (zero sample). Sites having 1% of samples with a detection p-value greater than 0.01 (4019 sites) or sites with beadcounts < 3 in 5% of samples (1499 sites) were removed. Additionally, since probe binding might be affected by SNPs in the binding area, sites containing SNPs or with a minor allele frequency (MAF) of at least 5% were also excluded from the data set [36]. At last, 817,471 probes passing quality control in all datasets were included.
In a further step, DASEN was applied to normalize the distribution of InflI and InfII probes together, using R package wateRmelon [37].
Statistical analyses
Elastic net regression and data training
Then the chosen sites were kept as features for the subsequent model training of age prediction, based on the elastic net algorithm implemented in the glmnet package in R [43,44] in the training dataset (N=90). The elastic net regression is a penalized regression model that could explore a large number of CpG sites to keep the best variable set in predicting of age. In epigenetic applications, there are a lot of correlations among the CpG sites. The ridge regression can limit the coefficient size, but it usually encourages coefficients of highly correlated variables to be averaged. The lasso can make the model more interpretable but it is usually indifferent to the choice among the correlated variable sets. The elastic net regression is a combination of traditional lasso and ridge regression methods that could avoid too complex models and thus prevent over-fitting. It is ideal for building this model under conditions where the number of features greatly outweighs the number of samples, particularly for genetic data. The coefficients are also as interpretable as those in the general linear regression model [45].
In this study, the elastic net mixing parameter alpha was set to 0.5 allowing for the equal contribution of the lasso and ridge methods. The parameter lambda was chosen by a 10-fold cross-validation.We did not include extra covariates other than the methylation of age-related CpG sites in the analysis, consistent with the development of the DNAm age predictor by Horvath and Hannum [14,15].
Age prediction and validation
The CpG sites selected from the regression and their training coefficient values were used to fit a linear model to calculate predicted values of age, marked as DNAm age. The prediction accuracy of this model was assessed by the correlation coefficients of linear association between DNAm age and chronological age. This prediction model was subsequently validated in the test dataset of 89 samples.
Sensitive analysis
As epigenetic aging rates have been suggested to be associated with sex [46], we conducted sensitive analysis by adding gender to the elastic net regression model.
To correct for multiple comparisons, a epigenome-wide significance level of the false discovery rate (FDR) < 0.05 was used and determined according to the Benjamini & Hochberg method [47].
Author Contributions
Conceived and designed the experiments: WHC and WJG. Performed the experiments: CXL, WJG and YG. Analyzed the data: CXL, YG and CQY. Contributed reagents/materials/analysis tools: WHC, WJG, JL and LML. Contributed to the data collection and data quality control: YG, CXL, RRL, JLD, and XHG. Wrote the paper: CXL. All authors contributed towards revising the paper.
Acknowledgements
The authors appreciate all participants and their parents for their time. We wish to thank Ningxiang Lin in Primary and Secondary School Health Care Center of Fangshan District, Qingjun Meng in Primary and Secondary School Health Care Center of Yanqing District, Shaohua Wangin Disease Control and Prevention Center of Yanqing District, and other people participated in the field survey in Beijing, China. We are also grateful to Dr. Tao Huang in Peking University Health Science Center for his advice in this study.
Conflicts of Interest
All authors declare that they have no conflicts of interest.
Funding
National Natural Science Foundation of China (81473041) and Special Fund for Health Scientific Research in the Public Welfare (201502006, 201002007).
References
- 1. Bird A. Perceptions of epigenetics. Nature. 2007; 447:396–98. https://doi.org/10.1038/nature05913 [PubMed]
- 2. Jones PA, Takai D. The role of DNA methylation in mammalian epigenetics. Science. 2001; 293:1068–70. https://doi.org/10.1126/science.1063852 [PubMed]
- 3. Lister R, Mukamel EA, Nery JR, Urich M, Puddifoot CA, Johnson ND, Lucero J, Huang Y, Dwork AJ, Schultz MD, Yu M, Tonti-Filippini J, Heyn H, et al. Global epigenomic reconfiguration during mammalian brain development. Science. 2013; 341:1237905. https://doi.org/10.1126/science.1237905 [PubMed]
- 4. Issa JP. Aging and epigenetic drift: a vicious cycle. J Clin Invest. 2014; 124:24–29. https://doi.org/10.1172/JCI69735 [PubMed]
- 5. Johansson A, Enroth S, Gyllensten U. Continuous aging of the human DNA methylome throughout the human lifespan. PLoS One. 2013; 8:e67378. https://doi.org/10.1371/journal.pone.0067378 [PubMed]
- 6. Huidobro C, Fernandez AF, Fraga MF. Aging epigenetics: causes and consequences. Mol Aspects Med. 2013; 34:765–81. https://doi.org/10.1016/j.mam.2012.06.006 [PubMed]
- 7. Benayoun BA, Pollina EA, Brunet A. Epigenetic regulation of ageing: linking environmental inputs to genomic stability. Nat Rev Mol Cell Biol. 2015; 16:593–610. https://doi.org/10.1038/nrm4048 [PubMed]
- 8. Jung M, Pfeifer GP. Aging and DNA methylation. BMC Biol. 2015; 13:7. https://doi.org/10.1186/s12915-015-0118-4 [PubMed]
- 9. Jones MJ, Goodman SJ, Kobor MS. DNA methylation and healthy human aging. Aging Cell. 2015; 14:924–32. https://doi.org/10.1111/acel.12349 [PubMed]
- 10. Bocklandt S, Lin W, Sehl ME, Sánchez FJ, Sinsheimer JS, Horvath S, Vilain E. Epigenetic predictor of age. PLoS One. 2011; 6:e14821. https://doi.org/10.1371/journal.pone.0014821 [PubMed]
- 11. Rakyan VK, Down TA, Balding DJ, Beck S. Epigenome-wide association studies for common human diseases. Nat Rev Genet. 2011; 12:529–41. https://doi.org/10.1038/nrg3000 [PubMed]
- 12. Bell JT, Tsai PC, Yang TP, Pidsley R, Nisbet J, Glass D, Mangino M, Zhai G, Zhang F, Valdes A, Shin SY, Dempster EL, Murray RM, et al, and MuTHER Consortium. Epigenome-wide scans identify differentially methylated regions for age and age-related phenotypes in a healthy ageing population. PLoS Genet. 2012; 8:e1002629. https://doi.org/10.1371/journal.pgen.1002629 [PubMed]
- 13. Numata S, Ye T, Hyde TM, Guitart-Navarro X, Tao R, Wininger M, Colantuoni C, Weinberger DR, Kleinman JE, Lipska BK. DNA methylation signatures in development and aging of the human prefrontal cortex. Am J Hum Genet. 2012; 90:260–72. https://doi.org/10.1016/j.ajhg.2011.12.020 [PubMed]
- 14. Hannum G, Guinney J, Zhao L, Zhang L, Hughes G, Sadda S, Klotzle B, Bibikova M, Fan JB, Gao Y, Deconde R, Chen M, Rajapakse I, et al. Genome-wide methylation profiles reveal quantitative views of human aging rates. Mol Cell. 2013; 49:359–67. https://doi.org/10.1016/j.molcel.2012.10.016 [PubMed]
- 15. Horvath S. DNA methylation age of human tissues and cell types. Genome Biol. 2013; 14:R115. https://doi.org/10.1186/gb-2013-14-10-r115 [PubMed]
- 16. Weidner CI, Lin Q, Koch CM, Eisele L, Beier F, Ziegler P, Bauerschlag DO, Jöckel KH, Erbel R, Mühleisen TW, Zenke M, Brümmendorf TH, Wagner W. Aging of blood can be tracked by DNA methylation changes at just three CpG sites. Genome Biol. 2014; 15:R24. https://doi.org/10.1186/gb-2014-15-2-r24 [PubMed]
- 17. Knight AK, Craig JM, Theda C, Bækvad-Hansen M, Bybjerg-Grauholm J, Hansen CS, Hollegaard MV, Hougaard DM, Mortensen PB, Weinsheimer SM, Werge TM, Brennan PA, Cubells JF, et al. An epigenetic clock for gestational age at birth based on blood methylation data. Genome Biol. 2016; 17:206. https://doi.org/10.1186/s13059-016-1068-z [PubMed]
- 18. Alisch RS, Barwick BG, Chopra P, Myrick LK, Satten GA, Conneely KN, Warren ST. Age-associated DNA methylation in pediatric populations. Genome Res. 2012; 22:623–32. https://doi.org/10.1101/gr.125187.111 [PubMed]
- 19. Dugué PA, Bassett JK, Joo JE, Jung CH, Ming Wong E, Moreno-Betancur M, Schmidt D, Makalic E, Li S, Severi G, Hodge AM, Buchanan DD, English DR, et al. DNA methylation-based biological aging and cancer risk and survival: pooled analysis of seven prospective studies. Int J Cancer. 2018; 142:1611–19. https://doi.org/10.1002/ijc.31189 [PubMed]
- 20. Chen BH, Marioni RE, Colicino E, Peters MJ, Ward-Caviness CK, Tsai PC, Roetker NS, Just AC, Demerath EW, Guan W, Bressler J, Fornage M, Studenski S, et al. DNA methylation-based measures of biological age: meta-analysis predicting time to death. Aging (Albany NY). 2016; 8:1844–65. https://doi.org/10.18632/aging.101020 [PubMed]
- 21. Horvath S, Zhang Y, Langfelder P, Kahn RS, Boks MP, van Eijk K, van den Berg LH, Ophoff RA. Aging effects on DNA methylation modules in human brain and blood tissue. Genome Biol. 2012; 13:R97. https://doi.org/10.1186/gb-2012-13-10-r97 [PubMed]
- 22. Klutstein M, Nejman D, Greenfield R, Cedar H. DNA methylation in cancer and aging. Cancer Res. 2016; 76:3446–50. https://doi.org/10.1158/0008-5472.CAN-15-3278 [PubMed]
- 23. Gao T, Joyce BT, Liu L, Zheng Y, Dai Q, Zhang Z, Zhang W, Shrubsole MJ, Tao MH, Schwartz J, Baccarelli A, Hou L. DNA methylation of oxidative stress genes and cancer risk in the Normative Aging Study. Am J Cancer Res. 2016; 6:553–61. [PubMed]
- 24. Galamb O, Kalmár A, Barták BK, Patai AV, Leiszter K, Péterfia B, Wichmann B, Valcz G, Veres G, Tulassay Z, Molnár B. Aging related methylation influences the gene expression of key control genes in colorectal cancer and adenoma. World J Gastroenterol. 2016; 22:10325–40. https://doi.org/10.3748/wjg.v22.i47.10325 [PubMed]
- 25. Meissner C, Ritz-Timme S. Molecular pathology and age estimation. Forensic Sci Int. 2010; 203:34–43. https://doi.org/10.1016/j.forsciint.2010.07.010 [PubMed]
- 26. Cortessis VK, Thomas DC, Levine AJ, Breton CV, Mack TM, Siegmund KD, Haile RW, Laird PW. Environmental epigenetics: prospects for studying epigenetic mediation of exposure-response relationships. Hum Genet. 2012; 131:1565–89. https://doi.org/10.1007/s00439-012-1189-8 [PubMed]
- 27. Feil R, Fraga MF. Epigenetics and the environment: emerging patterns and implications. Nat Rev Genet. 2012; 13:97–109. https://doi.org/10.1038/nrg3142 [PubMed]
- 28. Martin GM. Epigenetic drift in aging identical twins. Proc Natl Acad Sci USA. 2005; 102:10413–14. https://doi.org/10.1073/pnas.0504743102 [PubMed]
- 29. Pidsley R, Zotenko E, Peters TJ, Lawrence MG, Risbridger GP, Molloy P, Van Djik S, Muhlhausler B, Stirzaker C, Clark SJ. Critical evaluation of the Illumina MethylationEPIC BeadChip microarray for whole-genome DNA methylation profiling. Genome Biol. 2016; 17:208. https://doi.org/10.1186/s13059-016-1066-1 [PubMed]
- 30. Moran S, Arribas C, Esteller M. Validation of a DNA methylation microarray for 850,000 CpG sites of the human genome enriched in enhancer sequences. Epigenomics. 2016; 8:389–99. https://doi.org/10.2217/epi.15.114 [PubMed]
- 31. Talens RP, Boomsma DI, Tobi EW, Kremer D, Jukema JW, Willemsen G, Putter H, Slagboom PE, Heijmans BT. Variation, patterns, and temporal stability of DNA methylation: considerations for epigenetic epidemiology. FASEB J. 2010; 24:3135–44. https://doi.org/10.1096/fj.09-150490 [PubMed]
- 32. Dick KJ, Nelson CP, Tsaprouni L, Sandling JK, Aïssi D, Wahl S, Meduri E, Morange PE, Gagnon F, Grallert H, Waldenberger M, Peters A, Erdmann J, et al. DNA methylation and body-mass index: a genome-wide analysis. Lancet. 2014; 383:1990–98. https://doi.org/10.1016/S0140-6736(13)62674-4 [PubMed]
- 33. Houseman EA, Kim S, Kelsey KT, Wiencke JK. DNA methylation in whole blood: uses and challenges. Curr Environ Health Rep. 2015; 2:145–54. https://doi.org/10.1007/s40572-015-0050-3 [PubMed]
- 34. Li L, Gao W, Yu C, Lv J, Cao W, Zhan S, Wang S, Wu C, Hu Y. The chinese national twin registry: an update. Twin Res Hum Genet. 2013; 16:86–90. https://doi.org/10.1017/thg.2012.148 [PubMed]
- 35. Aryee MJ, Jaffe AE, Corrada-Bravo H, Ladd-Acosta C, Feinberg AP, Hansen KD, Irizarry RA. Minfi: a flexible and comprehensive Bioconductor package for the analysis of Infinium DNA methylation microarrays. Bioinformatics. 2014; 30:1363–69. https://doi.org/10.1093/bioinformatics/btu049 [PubMed]
- 36. McCartney DL, Walker RM, Morris SW, McIntosh AM, Porteous DJ, Evans KL. Identification of polymorphic and off-target probe binding sites on the Illumina Infinium MethylationEPIC BeadChip. Genom Data. 2016; 9:22–24. https://doi.org/10.1016/j.gdata.2016.05.012 [PubMed]
- 37. Pidsley R, Y Wong CC, Volta M, Lunnon K, Mill J, Schalkwyk LC. A data-driven approach to preprocessing Illumina 450K methylation array data. BMC Genomics. 2013; 14:293. https://doi.org/10.1186/1471-2164-14-293 [PubMed]
- 38. Carlin JB, Gurrin LC, Sterne JA, Morley R, Dwyer T. Regression models for twin studies: a critical review. Int J Epidemiol. 2005; 34:1089–99. https://doi.org/10.1093/ije/dyi153 [PubMed]
- 39. Leek JT, Johnson WE, Parker HS, Jaffe AE, Storey JD. The sva package for removing batch effects and other unwanted variation in high-throughput experiments. Bioinformatics. 2012; 28:882–83. https://doi.org/10.1093/bioinformatics/bts034 [PubMed]
- 40. Kaushal A, Zhang H, Karmaus WJ, Ray M, Torres MA, Smith AK, Wang SL. Comparison of different cell type correction methods for genome-scale epigenetics studies. BMC Bioinformatics. 2017; 18:216. https://doi.org/10.1186/s12859-017-1611-2 [PubMed]
- 41. McGregor K, Bernatsky S, Colmegna I, Hudson M, Pastinen T, Labbe A, Greenwood CM. An evaluation of methods correcting for cell-type heterogeneity in DNA methylation studies. Genome Biol. 2016; 17:84. https://doi.org/10.1186/s13059-016-0935-y [PubMed]
- 42. Leek JT, Storey JD. Capturing heterogeneity in gene expression studies by surrogate variable analysis. PLoS Genet. 2007; 3:1724–35. https://doi.org/10.1371/journal.pgen.0030161 [PubMed]
- 43. Tibshirani R, Bien J, Friedman J, Hastie T, Simon N, Taylor J, Tibshirani RJ. Strong rules for discarding predictors in lasso-type problems. J R Stat Soc Series B Stat Methodol. 2012; 74:245–66. https://doi.org/10.1111/j.1467-9868.2011.01004.x [PubMed]
- 44. Friedman J, Hastie T, Tibshirani R. Regularization paths for generalized linear models via coordinate descent. J Stat Softw. 2010; 33:1–22. https://doi.org/10.18637/jss.v033.i01 [PubMed]
- 45. Zou H, Hastie T. Regularization and variable selection via the elastic net (vol b 67, pg 301, 2005). J R Stat Soc Series B Stat Methodol. 2005; 67:768–768. https://doi.org/10.1111/j.1467-9868.2005.00527.x
- 46. Horvath S, Gurven M, Levine ME, Trumble BC, Kaplan H, Allayee H, Ritz BR, Chen B, Lu AT, Rickabaugh TM, Jamieson BD, Sun D, Li S, et al. An epigenetic clock analysis of race/ethnicity, sex, and coronary heart disease. Genome Biol. 2016; 17:171. https://doi.org/10.1186/s13059-016-1030-0 [PubMed]
- 47. Benjamini Y, Hochberg Y. Controlling the false discovery rate- a practial and powerful approach to mutiple testing. J R Stat Soc B. 1995; 57:289–300.