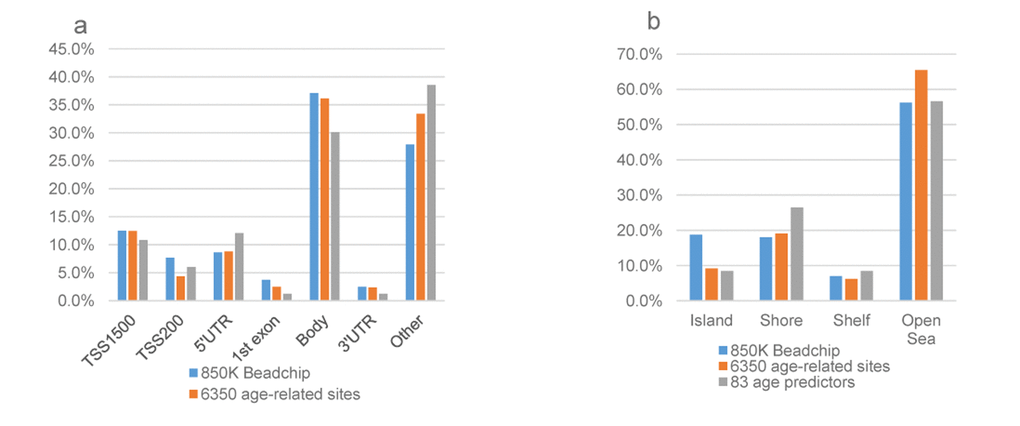
Figure 3.The genomic distribution of age-associated sites compared with all 850K probes passed QC. (a)The gene region distribution: frequency of age-related CpG sites according to the gene location; (b) The CpG islands distribution: frequency of age-related CpG sites according to the proximity to a CpG island. The ordinate represents the % CpG sites. The genomic distributions among the 83 age predictive sites, 6,350 chronological age-related CpG sites, and all the probes passed QC located on the 850 K BeadChip array were different. The annotation to be inside a CpG island was significantly over-represented on the 850k array (18.8%) compared to the 6,350 age-related CpGs and the 83 DNAm age predictors (9.2%, 8.4%), both with P <0.05. There was no differences in the distribution of the CpG sites with regard to other types of genomic distribution. The blue bar represents the all the probes passed QC located on the 850 K BeadChip array; the orange bar represents the 6,350 age-related CpGs; and the grey bar represents the 83 DNAm age predictors.