


Introduction
DNA methylation, a major form of epigenetic modification, is known to play an important role in aging and the development of age-related health outcomes [1,2]. Recently, a DNA methylation-based biological age predictor, “DNA methylation age (DNAmAge)”, has been established and found to be highly associated with chronological age [3]. The discrepancy between this epigenetic-based indicator and the chronological age has been termed age acceleration (AA), which was found to be heritable and has been used as an index of accelerated biological aging. Follow-up investigations have linked AA to lifestyle factors, environmental hazards, stressful life events, as well as all-cause mortality [4–13].
Several aging-related factors, including inflammation, neurohormonal disorder and endothelial dysfunction, have been found to play key mechanistic roles in the development of hypertension [14–16], the most common long-term medical condition among older adults that could lead to various forms of age-related health outcomes, such as cardiovascular diseases (CVD), kidney failure and dementia [17]. Relationships of hypertension and blood pressure with biological aging have also been studied since the introduction of DNAmAge. In 2016, Horvath et al. found that people with hypertension had a higher AA (0.5 – 1.2 years) in comparison to controls in the Bogalusa Heart study [7] and a more recent study from Quach et al. showed that elevated blood pressure was also correlated with higher extrinsic and intrinsic DNAmAge [10].
The use of antihypertension medication (AHM) reduces the risk of adverse age-related health outcomes caused by hypertension. Specifically, observational studies, clinical trials, and systematic reviews mostly suggested that effective antihypertensive therapy greatly reduces the risk of CVD in patients with hypertension [18,19], and may also be associated with a decreased risk of cognitive decline and incident dementia [20]. As DNA methylation is a durable and reversible modification, we hypothesized that the use of AHMs might also be able to influence the biological aging reflected by the epigenetic AA. Therefore, we assessed the associations of AHM use with AA and further determined whether the change of AHM use could modify the change rate of AA (ΔAA) during a median follow-up of 3.86 years. This investigation was carried out in the Normative Aging Study (NAS), which is an all-male longitudinal study of a cohort of older veterans living in the Greater Boston area.
Results
Participant characteristics
Characteristics of the 546 participants at each visit are shown in Table 1. Overall, the average age at first and second visits was 72 and 75 years, respectively. More than 60% of the participants were former smokers and less than 5% were current smokers, and the majority of participants were overweight or obese, consumed no or low amounts of alcohol, reported low physical activity and had less than 16 years of education. During a median follow-up of 3.86 years, the prevalence of hypertension increased from about 68% to 75%, stroke from nearly 6.0% to 8.6%, coronary heart disease (CHD) from 26% to 34%, diabetes from 12% to 16% and cancer from 50% to 59%. In particular, 313/374 and 383/411 participants with hypertension took the medication for elevated blood pressure at each visit, respectively. ACE inhibitors and beta blockers were the two most widely used medications. According to our definition of hypertension, the participants using AHM were considered to be have hypertension. Among the 546 participants, after the first visit, 13 stopped using any AHM and 83 started to use.
Table 1. Characteristics of participants from the Normative Aging Study (NAS), 1999–2013 (N = 546) a.
| Characteristics | First visit | Second visit | |||||||||||||||||||||||||||||||||||||||||||||||||||||||||||||||||||||||||||||||||||||||||||||||||
| Age (years) | 71.6 (6.5) | 75.4 (6.5) | |||||||||||||||||||||||||||||||||||||||||||||||||||||||||||||||||||||||||||||||||||||||||||||||||
| DNA methylation age (Horvath, years) | 72.6 (6.7) | 74.9 (7.1) | |||||||||||||||||||||||||||||||||||||||||||||||||||||||||||||||||||||||||||||||||||||||||||||||||
| Age acceleration (Horvath, years) | 0.15 (5.3) | -0.05 (5.6) | |||||||||||||||||||||||||||||||||||||||||||||||||||||||||||||||||||||||||||||||||||||||||||||||||
| Fasting glucose (mg/dL) | 108.3 (29.2) | 105.9 (21.6) | |||||||||||||||||||||||||||||||||||||||||||||||||||||||||||||||||||||||||||||||||||||||||||||||||
| Total cholesterol (mg/dL) | 198.8 (36.9) | 180.4 (37.2) | |||||||||||||||||||||||||||||||||||||||||||||||||||||||||||||||||||||||||||||||||||||||||||||||||
| Serum triglyceride (mg/dL) | 139.5 (85.3) | 125.8 (67.8) | |||||||||||||||||||||||||||||||||||||||||||||||||||||||||||||||||||||||||||||||||||||||||||||||||
| HDL (mg/dL) | 49.6 (13.4) | 48.6 (13.1) | |||||||||||||||||||||||||||||||||||||||||||||||||||||||||||||||||||||||||||||||||||||||||||||||||
| SBP (mm Hg) | 131.5 (17.3) | 124.6 (17.2) | |||||||||||||||||||||||||||||||||||||||||||||||||||||||||||||||||||||||||||||||||||||||||||||||||
| Smoking status | |||||||||||||||||||||||||||||||||||||||||||||||||||||||||||||||||||||||||||||||||||||||||||||||||||
| Current smoker | 23 (4.2%) | 23 (4.2%) | |||||||||||||||||||||||||||||||||||||||||||||||||||||||||||||||||||||||||||||||||||||||||||||||||
| Former smoker | 348 (63.7%) | 349 (63.9%) | |||||||||||||||||||||||||||||||||||||||||||||||||||||||||||||||||||||||||||||||||||||||||||||||||
| Never smoker | 175 (32.1%) | 174 (31.9%) | |||||||||||||||||||||||||||||||||||||||||||||||||||||||||||||||||||||||||||||||||||||||||||||||||
| Body mass index | |||||||||||||||||||||||||||||||||||||||||||||||||||||||||||||||||||||||||||||||||||||||||||||||||||
| Underweight or normal weight (<25.0) | 103 (18.9%) | 130 (23.8%) | |||||||||||||||||||||||||||||||||||||||||||||||||||||||||||||||||||||||||||||||||||||||||||||||||
| Overweight (≥25 to <30) | 299 (54.7%) | 279 (51.1%) | |||||||||||||||||||||||||||||||||||||||||||||||||||||||||||||||||||||||||||||||||||||||||||||||||
| Obese (≥30.0) | 144 (26.4%) | 137 (25.1%) | |||||||||||||||||||||||||||||||||||||||||||||||||||||||||||||||||||||||||||||||||||||||||||||||||
| Alcohol consumption b | |||||||||||||||||||||||||||||||||||||||||||||||||||||||||||||||||||||||||||||||||||||||||||||||||||
| Abstainer | 114 (22.5%) | 115 (25.1%) | |||||||||||||||||||||||||||||||||||||||||||||||||||||||||||||||||||||||||||||||||||||||||||||||||
| Low (0 to <40 g/d) | 355 (70.2%) | 319 (69.5%) | |||||||||||||||||||||||||||||||||||||||||||||||||||||||||||||||||||||||||||||||||||||||||||||||||
| Intermediate (40 to <60 g/d) | 25 (4.9%) | 18 (3.9%) | |||||||||||||||||||||||||||||||||||||||||||||||||||||||||||||||||||||||||||||||||||||||||||||||||
| High (≥60 g/d) | 12 (2.4%) | 7 (1.5%) | |||||||||||||||||||||||||||||||||||||||||||||||||||||||||||||||||||||||||||||||||||||||||||||||||
| Physical activity (MET-hours/week) c | |||||||||||||||||||||||||||||||||||||||||||||||||||||||||||||||||||||||||||||||||||||||||||||||||||
| Low (≤12 kcal/kg hours/week) | 321 (61.4%) | 307 (64.2%) | |||||||||||||||||||||||||||||||||||||||||||||||||||||||||||||||||||||||||||||||||||||||||||||||||
| Median (12–30 kcal/kg hours/week) | 128 (24.5%) | 110 (23.0%) | |||||||||||||||||||||||||||||||||||||||||||||||||||||||||||||||||||||||||||||||||||||||||||||||||
| High (≥30 kcal/kg hours/week) | 74 (14.1%) | 61 (12.8%) | |||||||||||||||||||||||||||||||||||||||||||||||||||||||||||||||||||||||||||||||||||||||||||||||||
| Major diseases | |||||||||||||||||||||||||||||||||||||||||||||||||||||||||||||||||||||||||||||||||||||||||||||||||||
| Hypertension | 374 (68.5%) | 411 (75.3%) | |||||||||||||||||||||||||||||||||||||||||||||||||||||||||||||||||||||||||||||||||||||||||||||||||
| Stroke | 32 (5.9%) | 47 (8.6%) | |||||||||||||||||||||||||||||||||||||||||||||||||||||||||||||||||||||||||||||||||||||||||||||||||
| Coronary heart disease (CHD) | 143 (26.2%) | 184 (33.7%) | |||||||||||||||||||||||||||||||||||||||||||||||||||||||||||||||||||||||||||||||||||||||||||||||||
| Diabetes | 67 (12.3%) | 89 (16.3%) | |||||||||||||||||||||||||||||||||||||||||||||||||||||||||||||||||||||||||||||||||||||||||||||||||
| Cancer | 271 (49.6%) | 323 (59.2%) | |||||||||||||||||||||||||||||||||||||||||||||||||||||||||||||||||||||||||||||||||||||||||||||||||
| Use of any antihypertensive medication | |||||||||||||||||||||||||||||||||||||||||||||||||||||||||||||||||||||||||||||||||||||||||||||||||||
| Any | 313 (57.3%) | 383 (70.1%) | |||||||||||||||||||||||||||||||||||||||||||||||||||||||||||||||||||||||||||||||||||||||||||||||||
| Calcium channel blockers | 66 (12.1%) | 84 (15.4%) | |||||||||||||||||||||||||||||||||||||||||||||||||||||||||||||||||||||||||||||||||||||||||||||||||
| ACE inhibitors | 143 (26.2%) | 204 (37.4%) | |||||||||||||||||||||||||||||||||||||||||||||||||||||||||||||||||||||||||||||||||||||||||||||||||
| Angiotensin receptor antagonists | 21 (3.8%) | 45 (8.2%) | |||||||||||||||||||||||||||||||||||||||||||||||||||||||||||||||||||||||||||||||||||||||||||||||||
| Alpha blockers | 64 (11.7%) | 90 (16.5%) | |||||||||||||||||||||||||||||||||||||||||||||||||||||||||||||||||||||||||||||||||||||||||||||||||
| Beta blockers | 185 (33.9%) | 222 (40.7%) | |||||||||||||||||||||||||||||||||||||||||||||||||||||||||||||||||||||||||||||||||||||||||||||||||
| Diuretics | 98 (17.9%) | 141 (25.8%) | |||||||||||||||||||||||||||||||||||||||||||||||||||||||||||||||||||||||||||||||||||||||||||||||||
| Both visits | |||||||||||||||||||||||||||||||||||||||||||||||||||||||||||||||||||||||||||||||||||||||||||||||||||
| Years of education d | |||||||||||||||||||||||||||||||||||||||||||||||||||||||||||||||||||||||||||||||||||||||||||||||||||
| ≤12 years | 233 (44.5%) | ||||||||||||||||||||||||||||||||||||||||||||||||||||||||||||||||||||||||||||||||||||||||||||||||||
| 13 – 16 years | 223 (42.6%) | ||||||||||||||||||||||||||||||||||||||||||||||||||||||||||||||||||||||||||||||||||||||||||||||||||
| >16 years | 68 (12.9%) | ||||||||||||||||||||||||||||||||||||||||||||||||||||||||||||||||||||||||||||||||||||||||||||||||||
| Time between 1st and 2nd visits (years) | 3.86 (1.6) | ||||||||||||||||||||||||||||||||||||||||||||||||||||||||||||||||||||||||||||||||||||||||||||||||||
| Change rate of age acceleration between visits (year/chronological year) | -0.03 (1.3) | ||||||||||||||||||||||||||||||||||||||||||||||||||||||||||||||||||||||||||||||||||||||||||||||||||
| a: Mean values (standard deviation) for continuous variables and n (%) for categorical variables; | |||||||||||||||||||||||||||||||||||||||||||||||||||||||||||||||||||||||||||||||||||||||||||||||||||
| b: Data missing for 40 and 87 participants at 1st and 2nd visits, respectively; | |||||||||||||||||||||||||||||||||||||||||||||||||||||||||||||||||||||||||||||||||||||||||||||||||||
| c: Data missing for 23 and 68 participants at 1st and 2nd visits, respectively; | |||||||||||||||||||||||||||||||||||||||||||||||||||||||||||||||||||||||||||||||||||||||||||||||||||
| d: Data missing for 22 participants. | |||||||||||||||||||||||||||||||||||||||||||||||||||||||||||||||||||||||||||||||||||||||||||||||||||
Our main analyses based on the DNAmAge estimated by Horvath’s algorithm. Figure 1 shows that the estimates were highly correlated with chronological age at each visit (Spearman coefficients >0.6). While DNAmAge increased between the first and second visit, the overall AA of the second visit was lower than that of the first visit (Table 1), showing declining trajectories with a crude average ΔAA of about -0.03 year/chronological year. The trajectories of AA and distributions of ΔAA were illustrated in Figure 2. Figure S1 showed strong correlations between the AAs at both visits among those with or without hypertension at both visits (Spearman coefficients ~0.7), while for those who had hypertension or hypertension was controlled after the first visit, their correlation was slightly attenuated (Spearman coefficients = 0.53).
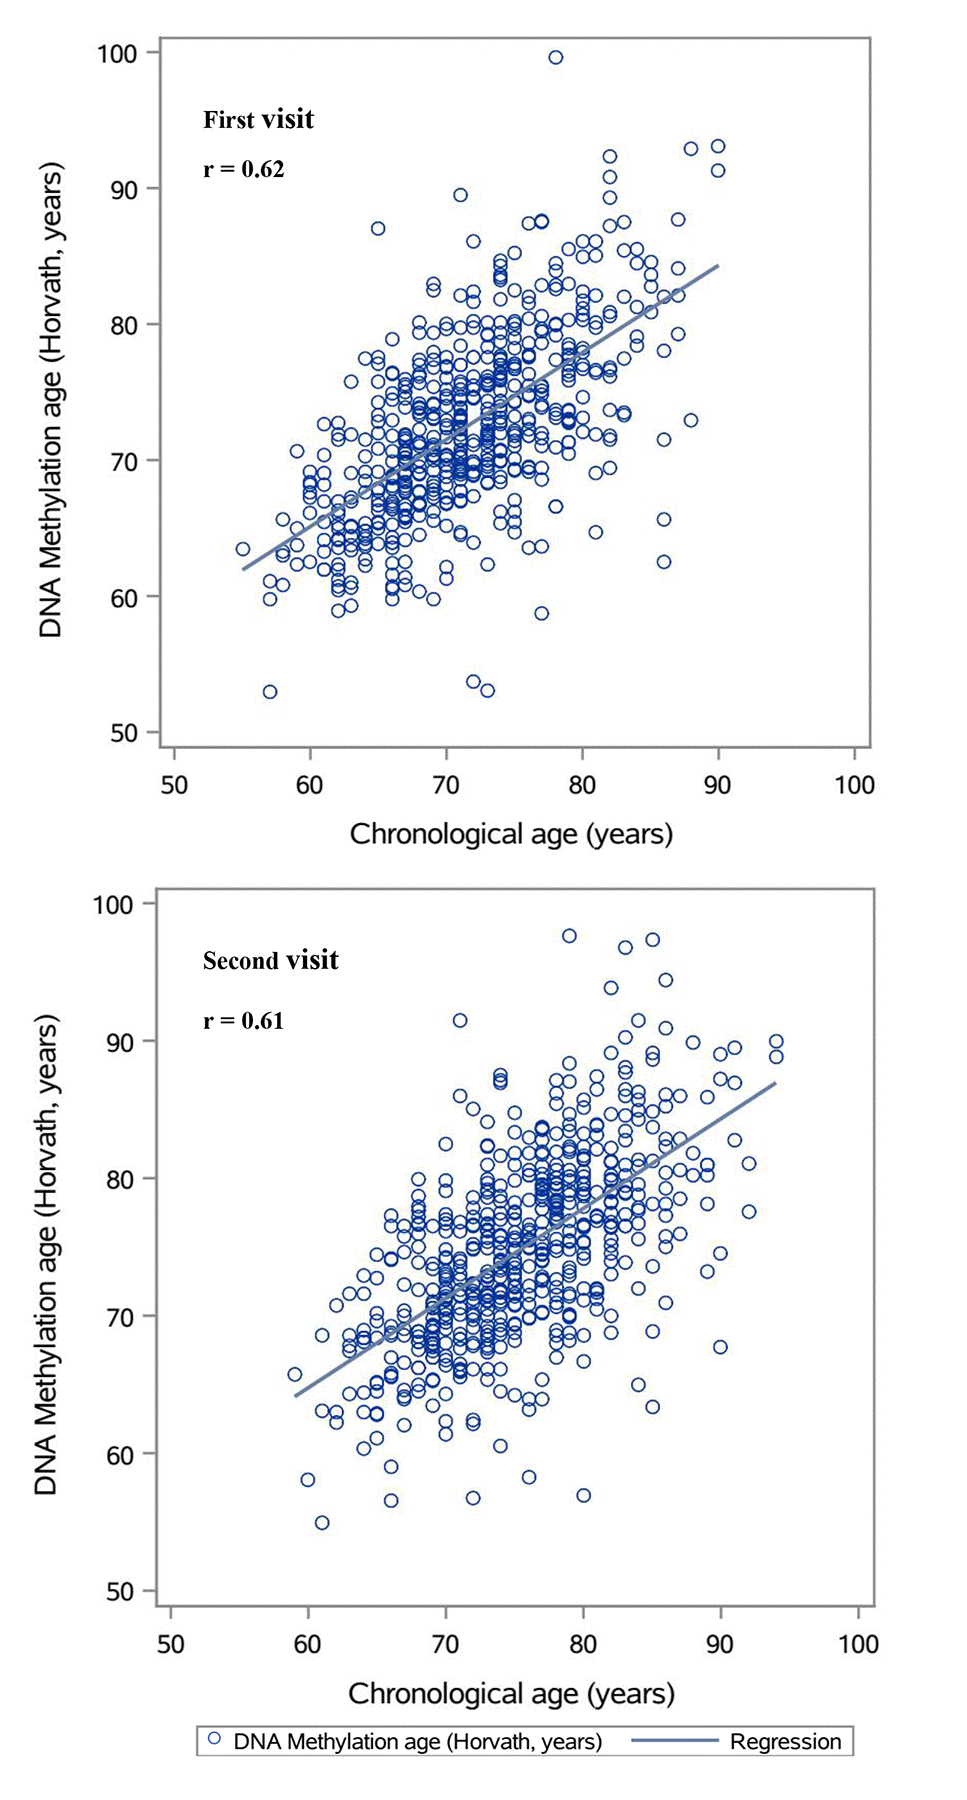
Figure 1. Plots of predicted DNA methylation ages against chronological age.
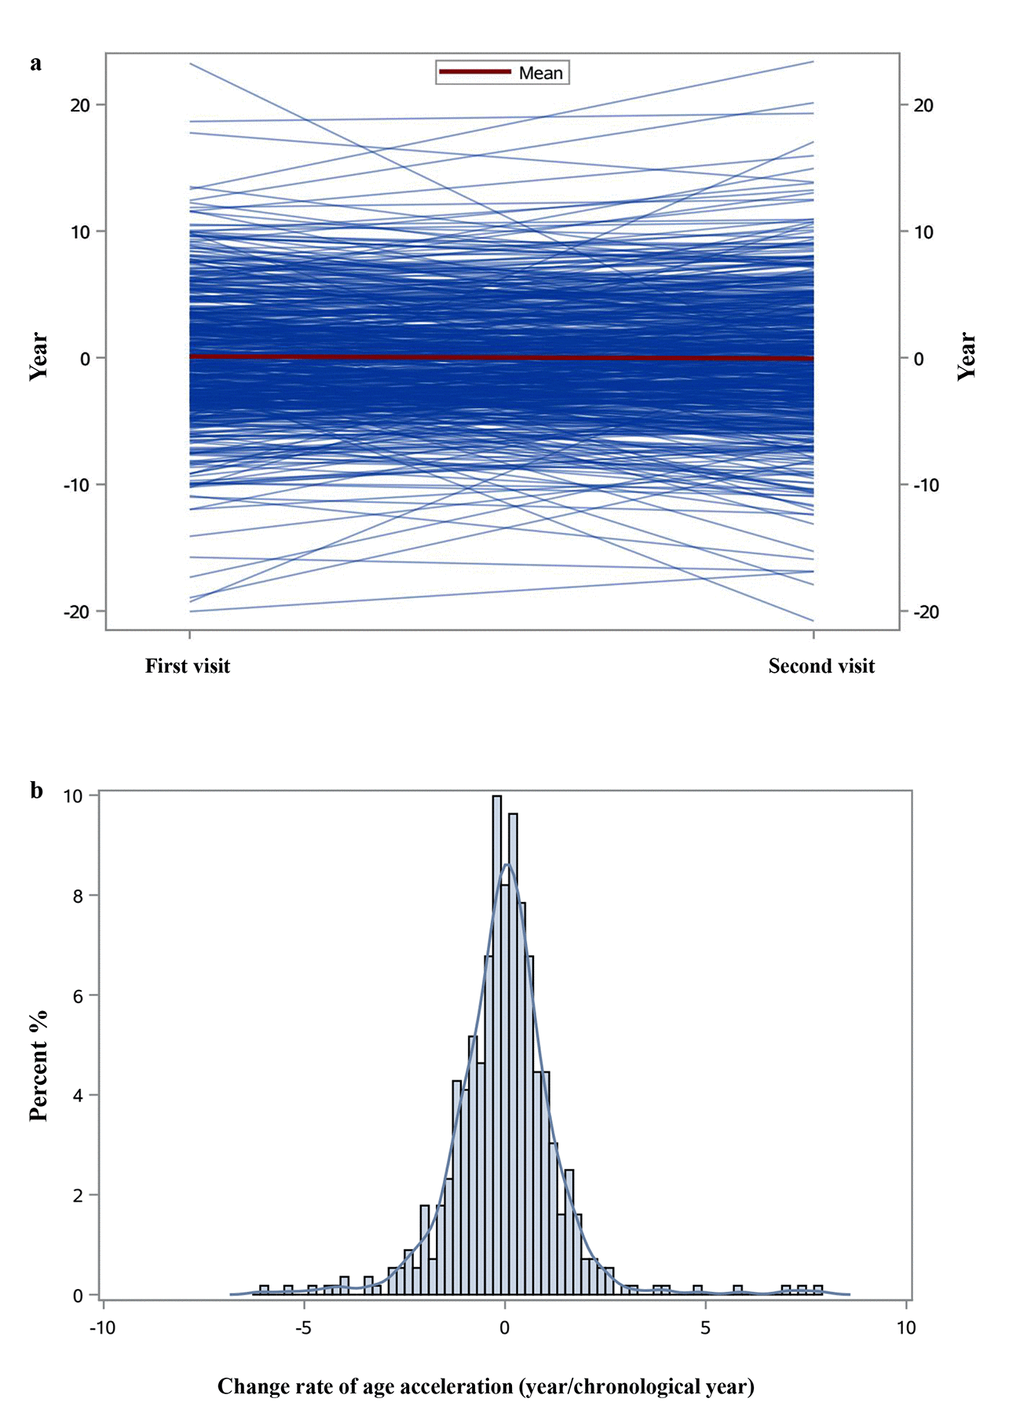
Figure 2. Individual trajectories of age acceleration (a) and the distribution of change rate of age acceleration (b).
Associations of hypertension with age acceleration and the change rate of age acceleration
We evaluated the relationship between hypertension and AA at each visit. Participants with hypertension had higher AA (years) than those without (first visit: 0.18 vs. 0.09; second visit: -0.01 vs. -0.18; p-value=0.016). The similar pattern was also observed for ΔAA that participants with hypertension had a higher ΔAA (year/chronological year) compared to those without (first visit: 0.03 vs. -0.14; second visit: 0.01 vs. -0.12; p-value=0.007). We further adjusted for other potential covariates at each visit in a mixed linear model to validate the observed patterns, including age, body max index (BMI), smoking status, alcohol consumption, years of education, physical activity, leukocyte distribution and the batch of microarray experiments in DNA methylation measurement. As shown in Table S1, the correlations of hypertension with AA and ΔAA remained positive, albeit not statistically significant. We also tested the associations of diabetes, metabolic syndrome and commonly measured clinical biomarkers with AA and ΔAA (Table S1 and S2). Despite the statistically significant association between diabetes and ΔAA, neither metabolic syndrome nor any biomarkers were strongly associated with AA or ΔAA.
Cross-sectional associations of antihypertensive medication with age acceleration and the change rate of age acceleration
We first investigated the cross-sectional associations of AHM use with AA and ΔAA at each visit. Overall, taking any AHM was significantly associated with higher AA and ΔAA (Table 2). After adjusting for potential covariates at each visit [age, BMI, smoking status, alcohol consumption, years of education, physical activity, leukocyte distribution, total cholesterol, high-density lipoprotein (HDL), triglycerides, fasting glucose, systolic blood pressure (SBP), hypertension, stroke, CHD, diabetes, cancer and the batch of microarray experiments in DNA methylation measurement], people who took any AHM at each visit were about 2.3 years older than the controls in terms of AA, and their AA increased significantly during follow-up at a rate of more than 0.4 year/chronological year compared to the people who did not take any AHMs. However, the effects of specific classes of medications varied. While taking diuretics was negatively associated with AA and ΔAA, calcium channel blockers and alpha and beta blockers were positively correlated with AA and ΔAA. Angiotensin-converting enzyme inhibitors (ACE inhibitors) and angiotensin receptor antagonists (ARBs) both had negative associations with ΔAA, but their relationships with AA were in different directions. An additional subgroup analysis was carried out among people with hypertension at each visit (Table 3), and the use of any AHM remained robustly associated with increased AA and ΔAA.
Table 2. Cross-sectional associations of the antihypertensive medication use with age acceleration and change rate of age acceleration at first and second visits.
| Visit | Medication | Medication use | N | Age acceleration | Change rate of age acceleration | ||||||||||||||||||||||||||||||||||||||||||||||||||||||||||||||||||||||||||||||||||||||||||||||
| Model 1 a | Model 2 b | Model 1 | Model 2 | ||||||||||||||||||||||||||||||||||||||||||||||||||||||||||||||||||||||||||||||||||||||||||||||||
| Coefficients(SE) | p-value | Coefficients(SE) | p-value | Coefficients(SE) | p-value | Coefficients(SE) | p-value | ||||||||||||||||||||||||||||||||||||||||||||||||||||||||||||||||||||||||||||||||||||||||||||
| First visit | Calcium channel blockers | No | 480 | Ref | Ref | Ref | Ref | ||||||||||||||||||||||||||||||||||||||||||||||||||||||||||||||||||||||||||||||||||||||||||||
| Yes | 66 | 0.059 (0.723) | 0.935 | 0.381 (0.784) | 0.627 | 0.222(0. 163) | 0.175 | 0.263 (0.184) | 0.154 | ||||||||||||||||||||||||||||||||||||||||||||||||||||||||||||||||||||||||||||||||||||||||||
| ACE inhibitors | No | 403 | Ref | Ref | Ref | Ref | |||||||||||||||||||||||||||||||||||||||||||||||||||||||||||||||||||||||||||||||||||||||||||||
| Yes | 143 | 0.241 (0.525) | 0.646 | 0.281 (0.605) | 0.643 | -0.093 (0.119) | 0.432 | -0.133 (0.142) | 0.350 | ||||||||||||||||||||||||||||||||||||||||||||||||||||||||||||||||||||||||||||||||||||||||||
| ARBs | No | 525 | Ref | Ref | Ref | Ref | |||||||||||||||||||||||||||||||||||||||||||||||||||||||||||||||||||||||||||||||||||||||||||||
| Yes | 21 | -0.144 (1.169) | 0.902 | -0.792 (1.184) | 0.504 | -0.047 (0.265) | 0.858 | -0.042 (0.279) | 0.881 | ||||||||||||||||||||||||||||||||||||||||||||||||||||||||||||||||||||||||||||||||||||||||||
| Alpha blockers | No | 482 | Ref | Ref | Ref | Ref | |||||||||||||||||||||||||||||||||||||||||||||||||||||||||||||||||||||||||||||||||||||||||||||
| Yes | 64 | 1.478 (0.721) | 0.041 | 1.974 (0.769) | 0.011 | 0.055 (0.164) | 0.737 | 0.041 (0.184) | 0.821 | ||||||||||||||||||||||||||||||||||||||||||||||||||||||||||||||||||||||||||||||||||||||||||
| Beta blockers | No | 361 | Ref | Ref | Ref | Ref | |||||||||||||||||||||||||||||||||||||||||||||||||||||||||||||||||||||||||||||||||||||||||||||
| Yes | 185 | 1.150 (0.499) | 0.022 | 1.291 (0.647) | 0.047 | 0.066 (0.114) | 0.562 | 0.075 (0.153) | 0.624 | ||||||||||||||||||||||||||||||||||||||||||||||||||||||||||||||||||||||||||||||||||||||||||
| Diuretics | No | 448 | Ref | Ref | Ref | Ref | |||||||||||||||||||||||||||||||||||||||||||||||||||||||||||||||||||||||||||||||||||||||||||||
| Yes | 98 | -0.068 (0.614) | 0.911 | -0.100 (0.676) | 0.882 | -0.095 (0.138) | 0.496 | -0.001 (0.159) | 0.973 | ||||||||||||||||||||||||||||||||||||||||||||||||||||||||||||||||||||||||||||||||||||||||||
| Any antihypertensive medication | No | 233 | Ref | Ref | Ref | Ref | |||||||||||||||||||||||||||||||||||||||||||||||||||||||||||||||||||||||||||||||||||||||||||||
| Yes | 313 | 0.935 (0.488) | 0.056 | 2.274 (0.860) | 0.009 | 0.195 (0.111) | 0.079 | 0.433 (0.205) | 0.035 | ||||||||||||||||||||||||||||||||||||||||||||||||||||||||||||||||||||||||||||||||||||||||||
| Second | Calcium channel blockers | No | 462 | Ref | Ref | Ref | Ref | ||||||||||||||||||||||||||||||||||||||||||||||||||||||||||||||||||||||||||||||||||||||||||||
| visit | Yes | 84 | 1.243 (0.681) | 0.068 | 1.035 (0.783) | 0.187 | 0.214 (0.144) | 0.137 | 0.275 (0.163) | 0.093 | |||||||||||||||||||||||||||||||||||||||||||||||||||||||||||||||||||||||||||||||||||||||||
| ACE inhibitors | No | 342 | Ref | Ref | Ref | Ref | |||||||||||||||||||||||||||||||||||||||||||||||||||||||||||||||||||||||||||||||||||||||||||||
| Yes | 204 | -0.293 (0.510) | 0.565 | -0.340 (0.648) | 0.601 | -0.045 (0.107) | 0.671 | -0.036 (0.135) | 0.791 | ||||||||||||||||||||||||||||||||||||||||||||||||||||||||||||||||||||||||||||||||||||||||||
| ARBs | No | 501 | Ref | Ref | Ref | Ref | |||||||||||||||||||||||||||||||||||||||||||||||||||||||||||||||||||||||||||||||||||||||||||||
| Yes | 45 | 0.790 (0.923) | 0.393 | 0.697 (1.092) | 0.524 | -0.247 (0.194) | 0.203 | -0.314 (0.227) | 0.167 | ||||||||||||||||||||||||||||||||||||||||||||||||||||||||||||||||||||||||||||||||||||||||||
| Alpha blockers | No | 456 | Ref | Ref | Ref | Ref | |||||||||||||||||||||||||||||||||||||||||||||||||||||||||||||||||||||||||||||||||||||||||||||
| Yes | 90 | 0.612 (0.678) | 0.367 | 0.875 (0.814) | 0.283 | 0.034 (0.142) | 0.809 | 0.073 (0.170) | 0.668 | ||||||||||||||||||||||||||||||||||||||||||||||||||||||||||||||||||||||||||||||||||||||||||
| Beta blockers | No | 324 | Ref | Ref | Ref | Ref | |||||||||||||||||||||||||||||||||||||||||||||||||||||||||||||||||||||||||||||||||||||||||||||
| Yes | 222 | 1.213 (0.506) | 0.017 | 1.406 (0.707) | 0.047 | 0.059 (0.107) | 0.581 | 0.155 (0.148) | 0.296 | ||||||||||||||||||||||||||||||||||||||||||||||||||||||||||||||||||||||||||||||||||||||||||
| Diuretics | No | 405 | Ref | Ref | Ref | Ref | |||||||||||||||||||||||||||||||||||||||||||||||||||||||||||||||||||||||||||||||||||||||||||||
| Yes | 141 | -0.136 (0.563) | 0.809 | -0.047 (0.683) | 0.945 | -0.029 (0.118) | 0.809 | -0.050 (0.142) | 0.724 | ||||||||||||||||||||||||||||||||||||||||||||||||||||||||||||||||||||||||||||||||||||||||||
| Any antihypertensive medication | No | 163 | Ref | Ref | Ref | Ref | |||||||||||||||||||||||||||||||||||||||||||||||||||||||||||||||||||||||||||||||||||||||||||||
| Yes | 383 | 0.659 (0.543) | 0.226 | 2.313 (1.096) | 0.035 | 0.097 (0.114) | 0.396 | 0.467 (0.229) | 0.042 | ||||||||||||||||||||||||||||||||||||||||||||||||||||||||||||||||||||||||||||||||||||||||||
| a: Model 1: Adjusted for covariates at each visit: age + leukocyte distribution (Houseman algorithm) + random effect (batch effect of DNA methylation measurement). Age acceleration was additionally adjusted for in the model for the change rate of age acceleration; | |||||||||||||||||||||||||||||||||||||||||||||||||||||||||||||||||||||||||||||||||||||||||||||||||||
| b: Model 2: Model 1 + BMI + smoking status + alcohol consumption + physical activity + years of education + total cholesterol + HDL + triglycerides + fasting glucose + SBP + hypertension + stroke + CHD + diabetes + cancer. | |||||||||||||||||||||||||||||||||||||||||||||||||||||||||||||||||||||||||||||||||||||||||||||||||||
Table 3. Cross-sectional associations of antihypertensive medication use with age acceleration and change of age acceleration at first and second visits among the subpopulation who had hypertension.
| Visit | Medication | Medication use | N | Age accelerationa | Change rate of age accelerationb | ||||||||||||||||||||||||||||||||||||||||||||||||||||||||||||||||||||||||||||||||||||||||||||||
| Coefficients(SE) | p-value | Coefficients(SE) | p-value | ||||||||||||||||||||||||||||||||||||||||||||||||||||||||||||||||||||||||||||||||||||||||||||||||
| First visit | Calcium channel blockers | No | 308 | Ref | Ref | ||||||||||||||||||||||||||||||||||||||||||||||||||||||||||||||||||||||||||||||||||||||||||||||
| Yes | 66 | -0.390 (0.816) | 0.633 | 0.346 (0.202) | 0.089 | ||||||||||||||||||||||||||||||||||||||||||||||||||||||||||||||||||||||||||||||||||||||||||||||
| ACE inhibitors | No | 231 | Ref | Ref | |||||||||||||||||||||||||||||||||||||||||||||||||||||||||||||||||||||||||||||||||||||||||||||||
| Yes | 143 | -0.235 (0.628) | 0.709 | 0.166 (0.156) | 0.290 | ||||||||||||||||||||||||||||||||||||||||||||||||||||||||||||||||||||||||||||||||||||||||||||||
| ARBs | No | 353 | Ref | Ref | |||||||||||||||||||||||||||||||||||||||||||||||||||||||||||||||||||||||||||||||||||||||||||||||
| Yes | 21 | -0.144 (1.169) | 0.902 | 0.012 (0.307) | 0.968 | ||||||||||||||||||||||||||||||||||||||||||||||||||||||||||||||||||||||||||||||||||||||||||||||
| Alpha blockers | No | 310 | Ref | Ref | |||||||||||||||||||||||||||||||||||||||||||||||||||||||||||||||||||||||||||||||||||||||||||||||
| Yes | 64 | 2.087 (0.795) | 0.009 | -0.048 (0.203) | 0.813 | ||||||||||||||||||||||||||||||||||||||||||||||||||||||||||||||||||||||||||||||||||||||||||||||
| Beta blockers | No | 189 | Ref | Ref | |||||||||||||||||||||||||||||||||||||||||||||||||||||||||||||||||||||||||||||||||||||||||||||||
| Yes | 185 | 1.410 (0.680) | 0.039 | 0.107 (0.171) | 0.531 | ||||||||||||||||||||||||||||||||||||||||||||||||||||||||||||||||||||||||||||||||||||||||||||||
| Diuretics | No | 276 | Ref | Ref | |||||||||||||||||||||||||||||||||||||||||||||||||||||||||||||||||||||||||||||||||||||||||||||||
| Yes | 98 | -0.010 (0.710) | 0.989 | 0.020 (0.177) | 0.909 | ||||||||||||||||||||||||||||||||||||||||||||||||||||||||||||||||||||||||||||||||||||||||||||||
| Any antihypertensive medication | No | 61 | Ref | Ref | |||||||||||||||||||||||||||||||||||||||||||||||||||||||||||||||||||||||||||||||||||||||||||||||
| Yes | 313 | 2.378 (0.898) | 0.009 | 0.497 (0.228) | 0.030 | ||||||||||||||||||||||||||||||||||||||||||||||||||||||||||||||||||||||||||||||||||||||||||||||
| Second visit | Calcium channel blockers | No | 327 | Ref | Ref | ||||||||||||||||||||||||||||||||||||||||||||||||||||||||||||||||||||||||||||||||||||||||||||||
| Yes | 84 | 0.942 (0.794) | 0.236 | 0.307 (0.153) | 0.046 | ||||||||||||||||||||||||||||||||||||||||||||||||||||||||||||||||||||||||||||||||||||||||||||||
| ACE inhibitors | No | 207 | Ref | Ref | |||||||||||||||||||||||||||||||||||||||||||||||||||||||||||||||||||||||||||||||||||||||||||||||
| Yes | 204 | -0.215 (0.657) | 0.743 | 0.016 (0.128) | 0.899 | ||||||||||||||||||||||||||||||||||||||||||||||||||||||||||||||||||||||||||||||||||||||||||||||
| ARBs | No | 366 | Ref | Ref | |||||||||||||||||||||||||||||||||||||||||||||||||||||||||||||||||||||||||||||||||||||||||||||||
| Yes | 45 | 0.687 (1.084) | 0.527 | -0.285 (0.215) | 0.187 | ||||||||||||||||||||||||||||||||||||||||||||||||||||||||||||||||||||||||||||||||||||||||||||||
| Alpha blockers | No | 329 | Ref | Ref | |||||||||||||||||||||||||||||||||||||||||||||||||||||||||||||||||||||||||||||||||||||||||||||||
| Yes | 82 | 0.584 (0.867) | 0.501 | 0.032 (0.171) | 0.851 | ||||||||||||||||||||||||||||||||||||||||||||||||||||||||||||||||||||||||||||||||||||||||||||||
| Beta blockers | No | 189 | Ref | Ref | |||||||||||||||||||||||||||||||||||||||||||||||||||||||||||||||||||||||||||||||||||||||||||||||
| Yes | 222 | 1.287 (0.715) | 0.073 | 0.123 (0.142) | 0.388 | ||||||||||||||||||||||||||||||||||||||||||||||||||||||||||||||||||||||||||||||||||||||||||||||
| Diuretics | No | 270 | Ref | Ref | |||||||||||||||||||||||||||||||||||||||||||||||||||||||||||||||||||||||||||||||||||||||||||||||
| Yes | 141 | 0.010 (0.685) | 0.989 | -0.031 (0.136) | 0.818 | ||||||||||||||||||||||||||||||||||||||||||||||||||||||||||||||||||||||||||||||||||||||||||||||
| Any antihypertensive medication | No | 36 | Ref | Ref | |||||||||||||||||||||||||||||||||||||||||||||||||||||||||||||||||||||||||||||||||||||||||||||||
| Yes | 375 | 2.313 (1.214) | 0.058 | 0.430 (0.235) | 0.069 | ||||||||||||||||||||||||||||||||||||||||||||||||||||||||||||||||||||||||||||||||||||||||||||||
| a: Adjusted for covariates at each visit: age + leucocyte distribution (Houseman algorithm) + BMI + smoking status + alcohol consumption + physical activity + years of education + total cholesterol + HDL + triglycerides + fasting glucose + SBP + stroke + CHD + diabetes + cancer + random effect (batch effect of methylation measurement); | |||||||||||||||||||||||||||||||||||||||||||||||||||||||||||||||||||||||||||||||||||||||||||||||||||
| b: Additionally adjusted for age acceleration at each visit. | |||||||||||||||||||||||||||||||||||||||||||||||||||||||||||||||||||||||||||||||||||||||||||||||||||
Table S3a showed sensitivity analyses for the cross-sectional associations of any AHM use with the AA and ΔAA of Hannum DNAmAge and DNA methylation Phenotypic age (DNAmPhenoAge). Taking any AHMs showed positive correlations with the AA of each biomarker and significantly associated with both forms of AA at the first visit. People who took medications were about 2.2 years/1.7 years older in people compared to the controls, respectively. Even though taking any AHMs was not robustly associated with the ΔAA of neither biomarker, the effects were in the same direction as we identified for the Horvath DNAmAge.
Longitudinal associations of antihypertensive medication with age acceleration and the change rate of age acceleration
We further examined the longitudinal association between AHM use and ΔAA (Table 4). People that with continuous medication use were older than that never used (76.6 vs. 73.7 years). After controlling for the potential covariates at the first visit, taking AHM showed positive correlations with the AA and ΔAA. Compared to people who never took any AHM, individuals who started to take AHM after the first visit had an increased ΔAA of about 0.3 year/chronological year, and individuals with continuous AHM use had an increased ΔAA of about 0.6 year/chronological year. Consistent with this finding, stopping taking ACE inhibitors, ARBs, and alpha and beta blockers showed negative correlations with ΔAA, compared to continuous use. A subgroup analysis among 313 participants with hypertension at first visit yielded a similar pattern (Table 5). After fully controlling for potential covariates, stopped taking AHM was correlated with a declining ΔAA compared to the continued AHM use after the first visit albeit not statistically significant.
Table 4. Associations between antihypertensive medication use and change rate of age acceleration from first to second visit.
| Medication | Change of medication use | N | Change rate of age acceleration | ||||||||||||||||||||||||||||||||||||||||||||||||||||||||||||||||||||||||||||||||||||||||||||||||
| Model 1 a | Model 2 b | ||||||||||||||||||||||||||||||||||||||||||||||||||||||||||||||||||||||||||||||||||||||||||||||||||
| Coefficients(SE) | p-value | Coefficients(SE) | p-value | ||||||||||||||||||||||||||||||||||||||||||||||||||||||||||||||||||||||||||||||||||||||||||||||||
| Calcium channel blockers | Never used | 440 | Ref | Ref | |||||||||||||||||||||||||||||||||||||||||||||||||||||||||||||||||||||||||||||||||||||||||||||||
| Stopped use after first visit | 22 | 0.103 (0.272) | 0.706 | 0.264 (0.304) | 0.386 | ||||||||||||||||||||||||||||||||||||||||||||||||||||||||||||||||||||||||||||||||||||||||||||||
| Started use after first visit | 40 | 0.437 (0.201) | 0.030 | 0.405 (0.216) | 0.062 | ||||||||||||||||||||||||||||||||||||||||||||||||||||||||||||||||||||||||||||||||||||||||||||||
| Continuous use | 44 | 0.338 (0.194) | 0.083 | 0.338 (0.214) | 0.116 | ||||||||||||||||||||||||||||||||||||||||||||||||||||||||||||||||||||||||||||||||||||||||||||||
| ACE inhibitors | Never used | 327 | Ref | Ref | |||||||||||||||||||||||||||||||||||||||||||||||||||||||||||||||||||||||||||||||||||||||||||||||
| Stopped use after first visit | 15 | -0.121 (0.316) | 0.701 | -0.026 (0.348) | 0.942 | ||||||||||||||||||||||||||||||||||||||||||||||||||||||||||||||||||||||||||||||||||||||||||||||
| Started use after first visit | 76 | -0.081 (0.159) | 0.614 | 0.033 (0.185) | 0.857 | ||||||||||||||||||||||||||||||||||||||||||||||||||||||||||||||||||||||||||||||||||||||||||||||
| Continuous use | 128 | 0.103 (0.128) | 0.419 | 0.163 (0.156) | 0.297 | ||||||||||||||||||||||||||||||||||||||||||||||||||||||||||||||||||||||||||||||||||||||||||||||
| ARBs | Never used | 496 | Ref | Ref | |||||||||||||||||||||||||||||||||||||||||||||||||||||||||||||||||||||||||||||||||||||||||||||||
| Stopped use after first visit | 5 | -0.223 (0.535) | 0.677 | -0.250 (0.556) | 0.654 | ||||||||||||||||||||||||||||||||||||||||||||||||||||||||||||||||||||||||||||||||||||||||||||||
| Started use after first visit | 29 | -0.216 (0.235) | 0.359 | -0.145 (0.276) | 0.599 | ||||||||||||||||||||||||||||||||||||||||||||||||||||||||||||||||||||||||||||||||||||||||||||||
| Continuous use | 16 | -0.006 (0.303) | 0.983 | 0.011 (0.319) | 0.972 | ||||||||||||||||||||||||||||||||||||||||||||||||||||||||||||||||||||||||||||||||||||||||||||||
| Alpha blockers | Never used | 442 | Ref | Ref | |||||||||||||||||||||||||||||||||||||||||||||||||||||||||||||||||||||||||||||||||||||||||||||||
| Stopped use after first visit | 14 | -0.422( 0.325) | 0.195 | -0.330 (0.371) | 0.375 | ||||||||||||||||||||||||||||||||||||||||||||||||||||||||||||||||||||||||||||||||||||||||||||||
| Started use after first visit | 40 | 0.105 (0.202) | 0.605 | 0.269 (0.222) | 0.226 | ||||||||||||||||||||||||||||||||||||||||||||||||||||||||||||||||||||||||||||||||||||||||||||||
| Continuous use | 50 | 0.065 (0.185) | 0.727 | 0.063 (0.201) | 0.753 | ||||||||||||||||||||||||||||||||||||||||||||||||||||||||||||||||||||||||||||||||||||||||||||||
| Beta blockers | Never used | 300 | Ref | Ref | |||||||||||||||||||||||||||||||||||||||||||||||||||||||||||||||||||||||||||||||||||||||||||||||
| Stopped use after first visit | 24 | -0.586 (0.268) | 0.029 | -0.598 (0.300) | 0.047 | ||||||||||||||||||||||||||||||||||||||||||||||||||||||||||||||||||||||||||||||||||||||||||||||
| Started use after first visit | 61 | 0.180 (0.169) | 0.288 | 0.290 (0.185) | 0.117 | ||||||||||||||||||||||||||||||||||||||||||||||||||||||||||||||||||||||||||||||||||||||||||||||
| Continuous use | 161 | 0.193 (0.122) | 0.114 | 0.471 (0.164) | 0.100 | ||||||||||||||||||||||||||||||||||||||||||||||||||||||||||||||||||||||||||||||||||||||||||||||
| Diuretics | Never used | 385 | Ref | Ref | |||||||||||||||||||||||||||||||||||||||||||||||||||||||||||||||||||||||||||||||||||||||||||||||
| Stopped use after first visit | 20 | 0.183 (0.277) | 0.509 | 0.010 (0.293) | 0.972 | ||||||||||||||||||||||||||||||||||||||||||||||||||||||||||||||||||||||||||||||||||||||||||||||
| Started use after first visit | 63 | -0.017 (0.169) | 0.921 | -0.019 (0.186) | 0.918 | ||||||||||||||||||||||||||||||||||||||||||||||||||||||||||||||||||||||||||||||||||||||||||||||
| Continuous use | 78 | 0.068 (0.154) | 0.658 | -0.016 (0.181) | 0.932 | ||||||||||||||||||||||||||||||||||||||||||||||||||||||||||||||||||||||||||||||||||||||||||||||
| Any antihypertensive medication | Never used | 150 | Ref | Ref | |||||||||||||||||||||||||||||||||||||||||||||||||||||||||||||||||||||||||||||||||||||||||||||||
| Stopped use after first visit | 13 | -0.117 (0.374) | 0.754 | 0.006 (0.433) | 0.989 | ||||||||||||||||||||||||||||||||||||||||||||||||||||||||||||||||||||||||||||||||||||||||||||||
| Started use after first visit | 83 | 0.135 (0.168) | 0.422 | 0.285 (0.185) | 0.124 | ||||||||||||||||||||||||||||||||||||||||||||||||||||||||||||||||||||||||||||||||||||||||||||||
| Continuous use | 300 | 0.258 (0.127) | 0.043 | 0.596 (0.220) | 0.008 | ||||||||||||||||||||||||||||||||||||||||||||||||||||||||||||||||||||||||||||||||||||||||||||||
| a: Model 1: Adjusted for: age (first visit) + age acceleration (first visit) + leukocyte distribution (first visit, Houseman algorithm) + random effect (batch effect of methylation measurement at first visit); | |||||||||||||||||||||||||||||||||||||||||||||||||||||||||||||||||||||||||||||||||||||||||||||||||||
| b: Model 2: Model 1 + BMI (first visit) + smoking status (first visit) + alcohol consumption (first visit) + physical activity (first visit) + years of education (first visit) + total cholesterol (first visit) + HDL (first visit) + triglycerides (first visit) + fasting glucose (first visit) + SBP (first visit) + hypertension (first visit) + stroke (first visit) + CHD (first visit) + diabetes (first visit) + cancer (first visit). | |||||||||||||||||||||||||||||||||||||||||||||||||||||||||||||||||||||||||||||||||||||||||||||||||||
Table 5. Associations between stopping antihypertensive medication use and change rate of age acceleration among the subpopulation that used the antihypertensive medications at first visit.
| Medication | Change of medication use | N | Changes of age acceleration | ||||||||||||||||||||||||||||||||||||||||||||||||||||||||||||||||||||||||||||||||||||||||||||||||
| Model 1 a | Model 2 b | ||||||||||||||||||||||||||||||||||||||||||||||||||||||||||||||||||||||||||||||||||||||||||||||||||
| Coefficients(SE) | p-value | Coefficients(SE) | p-value | ||||||||||||||||||||||||||||||||||||||||||||||||||||||||||||||||||||||||||||||||||||||||||||||||
| Calcium channel blockers | Stopped use after first visit | 22 | -0.415 (0.316) | 0.196 | -0.143 (0.442) | 0.751 | |||||||||||||||||||||||||||||||||||||||||||||||||||||||||||||||||||||||||||||||||||||||||||||
| Continuous use | 44 | Ref | Ref | ||||||||||||||||||||||||||||||||||||||||||||||||||||||||||||||||||||||||||||||||||||||||||||||||
| ACE inhibitors | Stopped use after first visit | 15 | -0.308 (0.322) | 0.342 | -0.212 (0.369) | 0.567 | |||||||||||||||||||||||||||||||||||||||||||||||||||||||||||||||||||||||||||||||||||||||||||||
| Continuous use | 128 | Ref | Ref | ||||||||||||||||||||||||||||||||||||||||||||||||||||||||||||||||||||||||||||||||||||||||||||||||
| ARBs | Stopped use after first visit | 5 | -1.724 (0.831) | 0.077 | -0.050 (3.331) | 0.985 | |||||||||||||||||||||||||||||||||||||||||||||||||||||||||||||||||||||||||||||||||||||||||||||
| Continuous use | 16 | Ref | Ref | ||||||||||||||||||||||||||||||||||||||||||||||||||||||||||||||||||||||||||||||||||||||||||||||||
| Alpha blockers | Stopped use after first visit | 14 | -0.482 (0.294) | 0.109 | -0.040 (0.569) | 0.945 | |||||||||||||||||||||||||||||||||||||||||||||||||||||||||||||||||||||||||||||||||||||||||||||
| Continuous use | 50 | Ref | Ref | ||||||||||||||||||||||||||||||||||||||||||||||||||||||||||||||||||||||||||||||||||||||||||||||||
| Beta blockers | Stopped use after first visit | 24 | -0.731 (0.333) | 0.030 | -0.824 (0.401) | 0.042 | |||||||||||||||||||||||||||||||||||||||||||||||||||||||||||||||||||||||||||||||||||||||||||||
| Continuous use | 161 | Ref | Ref | ||||||||||||||||||||||||||||||||||||||||||||||||||||||||||||||||||||||||||||||||||||||||||||||||
| Diuretics | Stopped use after first visit | 20 | 0.156 (0.335) | 0.642 | -0.263 (0.407) | 0.521 | |||||||||||||||||||||||||||||||||||||||||||||||||||||||||||||||||||||||||||||||||||||||||||||
| Continuous use | 78 | Ref | Ref | ||||||||||||||||||||||||||||||||||||||||||||||||||||||||||||||||||||||||||||||||||||||||||||||||
| Any antihypertensive medication | Stopped use after first visit | 13 | -0.317 (0.391) | 0.418 | -0.585 (0.434) | 0.180 | |||||||||||||||||||||||||||||||||||||||||||||||||||||||||||||||||||||||||||||||||||||||||||||
| Continuous use | 300 | Ref | Ref | ||||||||||||||||||||||||||||||||||||||||||||||||||||||||||||||||||||||||||||||||||||||||||||||||
| a: Model 1: Adjusted for age (first visit) + age acceleration (first visit) + leukocyte distribution (first visit, Houseman algorithm) + random effect (batch effect of methylation measurement at first visit); | |||||||||||||||||||||||||||||||||||||||||||||||||||||||||||||||||||||||||||||||||||||||||||||||||||
| b: Model 2: Model 1 + BMI (first visit) + smoking status (first visit) + alcohol consumption (first visit) + physical activity (first visit) + years of education (first visit) + total cholesterol (first visit) + HDL (first visit) + triglycerides (first visit) + fasting glucose (first visit) + SBP (first visit) + hypertension (first visit) + stroke (first visit) + CHD (first visit) + diabetes (first visit) + cancer (first visit). | |||||||||||||||||||||||||||||||||||||||||||||||||||||||||||||||||||||||||||||||||||||||||||||||||||
Same longitudinal tests were also performed for the ΔAA of Hannum DNAmAge and DNAmPhenoAge as sensitivity analyses in Table S3b. The ΔAA of neither biomarker showed significant associations with the change of AHM use, but an increasing pattern was still observed for the people with continuous AHMs use in comparison to the people who never used the AHM for each biomarker.
Discussion
In the present study, we investigated the cross-sectional and longitudinal associations of AHM use with the AA of Horvath DNAmAge in a longitudinal study of older male participants examined over two visits. Even though a general decrease of AA was observed between the two visits, after fully adjusting for hypertension and other potential covariates, any AHM use showed a cross-sectional significant association with higher AA at each visit, as well as a longitudinal association with increased ΔAA between visits. Particularly, relative to participants who never took any AHM, individuals with continuous AHM use had a higher ΔAA of 0.6 year/chronological year. Additional sensitivity analyses on another two DNA methylation-based biomarkers (Hannum DNAmAge & DNAmPhenoAge) showed the similar patterns with the use of AHM as the Horvath DNAmAge.
Recently, Marioni et al. found that DNAmAge increases at a slower rate than chronological age across the life course in five independent cohorts, especially in the older population [21], which suggested that, overall, AA declines as people get older. The global decreasing pattern of AA across the two visits observed in our study is in line with this finding. This pattern may also be explained by survival bias, due to the higher probability that healthier participants with relatively lower AA may stay longer in longitudinal studies. After adjusting for hypertension and other potential covariates that might affect the DNAmAge, we surprisingly found that taking AHMs was associated with faster AA. This finding is at variance with the declining pattern of DNAmAge across the lifespan and is not consistent with the preventive effects of AHMs against age-related health outcomes caused by hypertension [18,19]. Several explanations may account for this discrepancy.
First, measurement bias or inaccuracies may affect the comparability of longitudinal AA and ΔAA estimates. Nevertheless, we have restricted this technical bias to the greatest extent by adjusting for the batch of DNA methylation measurement as a random effect and normalizing the methylation profiles with Horvath’s internal normalization method. Furthermore, selection bias due to differential survival rate may cause an underrepresentation of participants with higher AA [22], and may lead to underestimation or even contradicting results of the effect of AHM use on AA and ΔAA, and distort their associations towards the opposite. In our analyses, we accounted for potential selection bias due to the loss of follow-up using inverse probability weighting (IPW) [23]. Point estimates were similar between models using and not using IPW, indicating that little selection bias was introduced due to the loss to follow-up. Additionally, since the use of AHMs is usually treated as the indicator of hypertension severity, our study might report a proxy outcome that indeed reflected the impact of hypertension on aging (confounding by indication). Due to this concern, despite the weak positive but not significant pattern we observed between hypertension and the AA (ΔAA), we additionally adjusted for SBP and hypertension in the fully-adjusted analysis model and performed another sensitivity analysis by adding the interaction term of hypertension and AHMs (data not shown). Neither of the two adjustments altered the patterns of taking AHMs with AA and ΔAA in any relevant manner. In the meanwhile, people might stop taking AHMs after reducing the blood pressure through changing lifestyles and exercises, two factors that are likely to decrease the ΔAA. After controlling for the factors, we still observed a declining pattern between stopping taking any AHM and ΔAA, albeit not significant due to the limited sample size.
One biologically plausible explanation for this inconsistent observation is a potential causal connection among aging, epigenetic biomarkers of age, hypertension and AHM use. We speculate that in these four-corner relationships, aging independently leads to the change of epigenetic biomarkers of age (e.g., DNAmAge, DNAmPhenoAge) and hypertension via two separate pathways. Aging could cause the change of epigenetic biomarkers of age by altering the methylation levels of age-related CpG sites. In parallel, aging could prompt hypertension via a “vicious cycle”, which consists of inflammation, oxidative stress and endothelial dysfunction, and might not be closely related to age-related DNA methylation changes [16,17]. Taking AHMs could control blood pressure and reduce the risks of aging-related diseases, such as CVD, kidney failure and dementia, which are caused by hypertension. Nevertheless, as the causation between aging and hypertension is one-way, reducing blood pressure using AHM might not reversely affect biological aging by bringing the aberrant changes of age-related CpG sites back to normal levels. On the contrary, the AHMs’ potential side effects, such as abnormal glucose and lipid metabolism [24] and psychological/cognitive disorders [25,26], might have the potential to accelerate epigenetic biomarkers of age as suggested by previous studies [6,10,27]. However, this hypothesis needs to be evaluated by further research with larger populations and multiple follow-ups along with corresponding causal inferences and functional tests.
It is worth noting that the effects of specific medications on AA and ΔAA were not all unfavorable. In our study, ACE inhibitors, ARBs, and diuretics showed weak negative correlation with AA and ΔAA, while beta blockers showed a strong aging accelerating effect. Beyond the effects from specific medications, we should not ignore the adverse drug reactions (ADRs) from combined and inappropriate medication use [28], given most of the participants with hypertension took multiple medications at the same time. ADRs could become more severe and frequent in the elderly due to age-dependent pharmacodynamics and pharmacokinetic changes promoting drug-drug or drug-disease interactions, and such reactions could directly (or indirectly) facilitate the development of aging-related health outcomes including frailty and all-cause mortality [29,30]. This effect might play another key role in accelerating DNAmAge if the ADRs are not identified and treated with further changes in prescriptions.
Major strengths of the present study include the relatively large sample size and repeated measurements with detailed information on a broad range of covariates in a large cohort study. We also acknowledge several limitations in the interpretation of results. First, shifts of leukocyte distribution might affect the DNA methylation changes in whole blood samples [31]. Hence, we adjusted for leukocyte distribution by the Houseman algorithm to restrict potential confounding from differential blood counts to the greatest possible extent [32]. Nevertheless, residual confounding by this and other factors cannot be excluded entirely for the longitudinal analysis. Furthermore, the selected study participants were Caucasians and all male, which limits the generalizability of our results to other racial/ethnic groups and women. Finally, although our overall sample size was relatively large, some of the nonsignificant results may have been due to the lack of statistical power with the relatively smaller size of subsamples for specific AHMs. And given those subgroup analyses did not appear as robust as the whole population and showed contradicted patterns, there might be a risk of getting false positive findings, further research with a bigger sample size and longer multiple follow-ups are warranted to validate our results by eliminating the possibility of false positives.
In summary, we observed cross-sectional and longitudinal associations of any AHM use with increased AA and ΔAA. Our findings suggest that controlling blood pressure by taking medications might not be able to reduce the accelerated epigenetic aging, on the contrary, was associated with accelerated DNAmAge. This study partly reveals the relationship between AHMs and biological aging, and also underlines that DNAmAge and AA may not be able to capture the preventive effects of AHMs that reduce cardiovascular risks and mortality. Future investigations are required to confirm our findings and to elucidate the causal relationship between AHM use and DNAmAge, as well as the underlying pathophysiological mechanisms.
Materials and Methods
Study design and population
The NAS study is an ongoing longitudinal study of aging, established by the U.S. Department of Veterans Affairs in 1963. Details of this study have been published previously [33]. Briefly, the NAS is a closed cohort of 2,280 male veterans from the Greater Boston area. They were enrolled after an initial health screening that determined that they were free of known chronic medical conditions. Blood samples were collected from 657 participants, most of whom were visited up to 4 times between 1999 and 2013. Participants have been reevaluated every 3–5 years on a continuous rolling basis using detailed on-site physical examinations and questionnaires. We restricted the current analysis to the data of the first two visits of 546 Caucasian participants (aged 55-85 years) who had been visited twice at least, in order to control for the heterogeneity of race and to analyze the change of AA longitudinally. The NAS study was approved by the Department of Veterans Affairs Boston Healthcare System, and written informed consent was obtained from each subject prior to participation.
Data collection
As previously described [34], at each visit, participants were asked to provide detailed information about their lifestyles, dietary habits, activity levels, and demographic factors. Height and weight were measured and were used to calculate body mass index (BMI, in kg/m2). Blood samples were collected for assessing blood-based biomarkers. Participants’ status of major diseases was assessed based on the medical history and physicians’ diagnosis. In particular, hypertension was defined as a measured SBP of ≥140 mmHg, a measured diastolic blood pressure (DBP) of ≥90 mm Hg, or participants’ use of AHMs [35]. SBP and DBP were measured by a physician, and the AHMs included calcium channel blockers, ACE inhibitors, ARBs, alpha blockers, beta blockers and diuretics.
DNA methylation data
DNA of whole blood samples were collected between 1999 and 2013. As previously described [36,37], we used the QIAamp DNA Blood Kit (Qiagen, CA, USA) to extract DNA from buffy coat, and performed bisulfite conversion with the EZ-96 DNA Methylation Kit (Zymo Research, CA, USA). To minimize batch effects, we randomized chips across plates and randomized samples based on a 2-stage age-stratified algorithm so that age distributed similarly across chips and plates. We measured DNA methylation of CpG probes using Illumina HumanMethylation450 BeadChip for all the samples from both visits. After quality control, the remaining samples were preprocessed using the Illumina-type background correction, dye-bias adjustment and BMIQ normalization [38], which were used to generate methylation status. The methylation status of a specific CpG site was quantified as a β value ranging from 0 (no methylation) to 1 (full methylation).
A total of 353 CpG sites were retrieved from the methylation profiles for the estimation of DNAmAge for each participant based on the algorithm proposed by Horvath [3]. This algorithm was derived from a range of tissues and cell types using 353 probes targeted in the Illumina 27k and 450k methylation arrays. In this study, we performed the estimation by using the online calculator, where background-corrected beta values were pre-processed by the calculator’s internal normalization method [3]. AA was determined as discrepancies between methylation and chronological age in the form of residuals, which have a mean of 0 and represent positive and negative deviations from chronological age in years. The residuals were calculated by a linear regression procedure in which DNA methylation age was the outcome and chronological age was the independent variable. The ΔAA for each participant between the two visits was determined as:
with a unit of year/chronological year.
Statistical analysis
Study population of each visit was described with respect to major socio-demographic characteristics, lifestyle factors and detailed AHM use. The correlation between estimated DNAmAge and chronological age at each visit was evaluated by Spearman correlation coefficient.
We first tested the cross-sectional association of hypertension with AA at each visit and the ΔAA between the two visits. A linear mixed model with AA (ΔAA) as outcome was employed, controlling for covariates that have been reported to be associated with DNA methylation changes or with the use of AHM, including age (years), BMI [kg/m2, underweight (<18.5, < 1% of the study population) or normal weight (18.5 to <25), overweight (25 to <30), obese (≥30)], alcohol consumption [abstainer, low (0 to <40 g/d), intermediate (40 to <60 g/d), high (≥60 g/d)], smoking (current/ former/ never smoker), education (≤12 years, 13 – 16 years, >16 years), physical activity [metabolic equivalent of task (MET), low (≤12 kcal/kg hours/week), median (12–30 kcal/kg hours/week), high (≥30 kcal/kg hours/week)] and leukocyte distribution (Houseman algorithm [32]). The batch of microarray experiments in DNA methylation measurement was controlled for as the random effect. Corresponding AA was additionally adjusted for in the analyses of ΔAA at each visit.
We then investigated the cross-sectional associations of AHM use with AA and ΔAA at each visit in two mixed linear regression models. Model 1 adjusted for age, leukocyte distribution and the random batch effect, and Model 2 further adjusted for BMI, smoking status, alcohol consumption, physical activity, education, total cholesterol (mg/dL), HDL (mg/dL), triglycerides (mg/dL), fasting glucose (mg/dL), SBP (mm Hg), hypertension, stroke, coronary heart disease, diabetes and cancer (yes/no). AA was additionally adjusted for in the analyses of ΔAA at each visit.
Finally, we examined the longitudinal association between AHM use and the ΔAA. AHM use in the longitudinal analysis was classified as: never used, stopped use after first visit, started use after first visit and continuous use according to the reports of AHM use between the two visits, and was treated as a predictor in the analysis models. Two mixed linear regression models were used, adjusting for the same covariates described above.
Sensitivity analyses
We further performed sensitivity analyses for the main results by using another two DNA methylation based aging biomarkers: DNAmAge estimated by Hanumm et al.’s algorithm [39], and DNAmPhenoAge recently developed by Morgan et al. as an “update” of the Horvath DNAmAge for the lifespan [40].
Hanumm DNAmAge was estimated based on 71 age-related CpG sites reported in 2013 [39] and determined as the sum of the methylation beta values multiplied by the reported effect sizes of the predictors. AA of Hannum’s DNAmAge was also determined as discrepancies between DNA methylation and chronological age in the form of residuals.
Another batch of 513 CpG sites was retrieved for the estimation of DNAmPhenoAge for each participant based on the algorithm proposed by Levine et al. [40]. With the coefficient and intercept values provided by the authors, we estimated the DNAmPhenoAge as:
DNAmPhenoAge = 𝐶𝑝𝐺1 × 𝛽1 + 𝐶𝑝𝐺2 × 𝛽2 +⋯ 𝐶𝑝𝐺513 × 𝛽513 + intercept.
As defined by the authors [40], difference between Phenotypic and chronological age (DNAmPhenoAge – chronological age) was defined as the AA of DNAmPhenoAge. The ΔAA for the two aging biomarkers between the two visits was also determined by the formula (1).
We tested the cross-sectional and longitudinal associations of the AA and ΔAA of the two biomarkers with the use of any AHM using the same analysis models employed in the main analyses for Horvath DNAmAge.
Data cleaning and all aforementioned analyses were performed by SAS version 9.4 (SAS Institute Inc., Cary, NC, USA), and all statistical tests were two-sided with p-values of <0.05.
Supplementary Materials
Abbreviations
DNAmAge: DNA methylation age; AA: age acceleration; ΔAA: change rate of age acceleration; AHM: antihypertensive medication; CVD: cardiovascular disease; CpG: cytosine-phosphate-guanine; BMI: body mass index; HDL: high-density lipoprotein; NAS: Normative Aging Study; SBP: systolic blood pressure; DBP: diastolic blood pressure; CHD: Coronary heart disease; IPW: inverse probability weighting; ADRs: adverse drug reactions; DNAmPhenoAge: DNA methylation Phenotypic age.
Author Contributions
XG contributed to the data analysis and drafting. Other authors contributed to critical revision of the manuscript. All authors read and approved the final manuscript.
Acknowledgments
The authors would like to thank all Normative Aging Study participants, Dr. Sarah Rasmussen for sharing the codes adapted to perform inverse probability weighting and Ms. Chen Chen for the language assistance.
Conflicts of Interest
The authors declare that they have no competing interests.
Funding
This work was supported by the National Institute of Environmental Health Sciences (grants P30ES009089, R01ES021733, R01ES025225 and R01ES027747). The VA Normative Aging Study is supported by the Cooperative Studies Program/Epidemiology Research and Information Center of the U.S. Department of Veterans Affairs and is a component of the Massachusetts Veterans Epidemiology Research and Information Center, Boston, Massachusetts.
References
- 1. Jones MJ, Goodman SJ, Kobor MS. DNA methylation and healthy human aging. Aging Cell. 2015; 14:924–32. https://doi.org/10.1111/acel.12349 [PubMed]
- 2. Jung M, Pfeifer GP. Aging and DNA methylation. BMC Biol. 2015; 13:7. https://doi.org/10.1186/s12915-015-0118-4 [PubMed]
- 3. Horvath S. DNA methylation age of human tissues and cell types. Genome Biol. 2013; 14:R115. https://doi.org/10.1186/gb-2013-14-10-r115 [PubMed]
- 4. Horvath S, Erhart W, Brosch M, Ammerpohl O, von Schönfels W, Ahrens M, Heits N, Bell JT, Tsai PC, Spector TD, Deloukas P, Siebert R, Sipos B, et al. Obesity accelerates epigenetic aging of human liver. Proc Natl Acad Sci USA. 2014; 111:15538–43. https://doi.org/10.1073/pnas.1412759111 [PubMed]
- 5. Boks MP, van Mierlo HC, Rutten BP, Radstake TR, De Witte L, Geuze E, Horvath S, Schalkwyk LC, Vinkers CH, Broen JC, Vermetten E. Longitudinal changes of telomere length and epigenetic age related to traumatic stress and post-traumatic stress disorder. Psychoneuroendocrinology. 2015; 51:506–12. https://doi.org/10.1016/j.psyneuen.2014.07.011 [PubMed]
- 6. Marioni RE, Shah S, McRae AF, Ritchie SJ, Muniz-Terrera G, Harris SE, Gibson J, Redmond P, Cox SR, Pattie A, Corley J, Taylor A, Murphy L, et al. The epigenetic clock is correlated with physical and cognitive fitness in the Lothian Birth Cohort 1936. Int J Epidemiol. 2015; 44:1388–96. https://doi.org/10.1093/ije/dyu277 [PubMed]
- 7. Horvath S, Gurven M, Levine ME, Trumble BC, Kaplan H, Allayee H, Ritz BR, Chen B, Lu AT, Rickabaugh TM, Jamieson BD, Sun D, Li S, et al. An epigenetic clock analysis of race/ethnicity, sex, and coronary heart disease. Genome Biol. 2016; 17:171. https://doi.org/10.1186/s13059-016-1030-0 [PubMed]
- 8. Perna L, Zhang Y, Mons U, Holleczek B, Saum KU, Brenner H. Epigenetic age acceleration predicts cancer, cardiovascular, and all-cause mortality in a German case cohort. Clin Epigenetics. 2016; 8:64. https://doi.org/10.1186/s13148-016-0228-z [PubMed]
- 9. Gao X, Zhang Y, Brenner H. Associations of Helicobacter pylori infection and chronic atrophic gastritis with accelerated epigenetic ageing in older adults. Br J Cancer. 2017; 117:1211–14. https://doi.org/10.1038/bjc.2017.314 [PubMed]
- 10. Quach A, Levine ME, Tanaka T, Lu AT, Chen BH, Ferrucci L, Ritz B, Bandinelli S, Neuhouser ML, Beasley JM, Snetselaar L, Wallace RB, Tsao PS, et al. Epigenetic clock analysis of diet, exercise, education, and lifestyle factors. Aging (Albany NY). 2017; 9:419–46. https://doi.org/10.18632/aging.101168 [PubMed]
- 11. Fiorito G, Polidoro S, Dugué PA, Kivimaki M, Ponzi E, Matullo G, Guarrera S, Assumma MB, Georgiadis P, Kyrtopoulos SA, Krogh V, Palli D, Panico S, et al. Social adversity and epigenetic aging: a multi-cohort study on socioeconomic differences in peripheral blood DNA methylation. Sci Rep. 2017; 7:16266. https://doi.org/10.1038/s41598-017-16391-5 [PubMed]
- 12. Dugue PA, Bassett JK, Joo JE, Baglietto L, Jung CH, Ming Wong E, Fiorito G, Schmidt D, Makalic E, Li S, Moreno-Betancur M, Buchanan DD, Vineis P, et al. Association of DNA Methylation-Based Biological Age with Health Risk Factors, and Overall and Cause-Specific Mortality. Am J Epidemiol. 2018; 187:529–38. https://doi.org/10.1093/aje/kwx291 [PubMed]
- 13. Gao X, Zhang Y, Breitling LP, Brenner H. Relationship of tobacco smoking and smoking-related DNA methylation with epigenetic age acceleration. Oncotarget. 2016; 7:46878–89. https://doi.org/10.18632/oncotarget.9795 [PubMed]
- 14. Schulz E, Gori T, Münzel T. Oxidative stress and endothelial dysfunction in hypertension. Hypertens Res. 2011; 34:665–73. https://doi.org/10.1038/hr.2011.39 [PubMed]
- 15. Schulz E, Jansen T, Wenzel P, Daiber A, Münzel T. Nitric oxide, tetrahydrobiopterin, oxidative stress, and endothelial dysfunction in hypertension. Antioxid Redox Signal. 2008; 10:1115–26. https://doi.org/10.1089/ars.2007.1989 [PubMed]
- 16. Sun Z. Aging, arterial stiffness, and hypertension. Hypertension. 2015; 65:252–56. https://doi.org/10.1161/HYPERTENSIONAHA.114.03617 [PubMed]
- 17. Buford TW. Hypertension and aging. Ageing Res Rev. 2016; 26:96–111. https://doi.org/10.1016/j.arr.2016.01.007 [PubMed]
- 18. Neal B, MacMahon S, Chapman N, and Blood Pressure Lowering Treatment Trialists’ Collaboration. Effects of ACE inhibitors, calcium antagonists, and other blood-pressure-lowering drugs: results of prospectively designed overviews of randomised trials. Blood Pressure Lowering Treatment Trialists’ Collaboration. Lancet. 2000; 356:1955–64. https://doi.org/10.1016/S0140-6736(00)03307-9 [PubMed]
- 19. Turnbull F, and Blood Pressure Lowering Treatment Trialists’ Collaboration. Effects of different blood-pressure-lowering regimens on major cardiovascular events: results of prospectively-designed overviews of randomised trials. Lancet. 2003; 362:1527–35. https://doi.org/10.1016/S0140-6736(03)14739-3 [PubMed]
- 20. Yasar S, Schuchman M, Peters J, Anstey KJ, Carlson MC, Peters R, and Review of Human Studies and Clinical Trials. Relationship Between Antihypertensive Medications and Cognitive Impairment: part I. Curr Hypertens Rep. 2016; 18:67. https://doi.org/10.1007/s11906-016-0674-1 [PubMed]
- 21. Marioni RE, Suderman M, Chen BH, Horvath S, Bandinelli S, Morris T, Beck S, Ferrucci L, Pedersen NL, Relton CL, Deary IJ, Hägg S. Tracking the Epigenetic Clock Across the Human Life Course: A Meta-analysis of Longitudinal Cohort Data. J Gerontol A Biol Sci Med Sci. 2018. https://doi.org/10.1093/gerona/gly060 [PubMed]
- 22. Howe CJ, Cole SR, Lau B, Napravnik S, Eron JJ
Jr . Selection Bias Due to Loss to Follow Up in Cohort Studies. Epidemiology. 2016; 27:91–97. https://doi.org/10.1097/EDE.0000000000000409 [PubMed] - 23. Seaman SR, White IR. Review of inverse probability weighting for dealing with missing data. Stat Methods Med Res. 2013; 22:278–95. https://doi.org/10.1177/0962280210395740 [PubMed]
- 24. Lardinois CK, Neuman SL. The effects of antihypertensive agents on serum lipids and lipoproteins. Arch Intern Med. 1988; 148:1280–88. https://doi.org/10.1001/archinte.1988.00380060044012 [PubMed]
- 25. Hamer M, Batty GD, Stamatakis E, Kivimaki M. Hypertension awareness and psychological distress. Hypertension. 2010; 56:547–50. https://doi.org/10.1161/HYPERTENSIONAHA.110.153775 [PubMed]
- 26. Brody DS. Psychological distress and hypertension control. J Human Stress. 1980; 6:2–6. https://doi.org/10.1080/0097840X.1980.9935012 [PubMed]
- 27. Zannas AS, Arloth J, Carrillo-Roa T, Iurato S, Röh S, Ressler KJ, Nemeroff CB, Smith AK, Bradley B, Heim C, Menke A, Lange JF, Brückl T, et al. Lifetime stress accelerates epigenetic aging in an urban, African American cohort: relevance of glucocorticoid signaling. Genome Biol. 2015; 16:266. https://doi.org/10.1186/s13059-015-0828-5 [PubMed]
- 28. Davies EC, Green CF, Taylor S, Williamson PR, Mottram DR, Pirmohamed M. Adverse drug reactions in hospital in-patients: a prospective analysis of 3695 patient-episodes. PLoS One. 2009; 4:e4439. https://doi.org/10.1371/journal.pone.0004439 [PubMed]
- 29. Saum KU, Schöttker B, Meid AD, Holleczek B, Haefeli WE, Hauer K, Brenner H. Is Polypharmacy Associated with Frailty in Older People? Results From the ESTHER Cohort Study. J Am Geriatr Soc. 2017; 65:e27–32. https://doi.org/10.1111/jgs.14718 [PubMed]
- 30. Schöttker B, Saum KU, Muhlack DC, Hoppe LK, Holleczek B, Brenner H. Polypharmacy and mortality: new insights from a large cohort of older adults by detection of effect modification by multi-morbidity and comprehensive correction of confounding by indication. Eur J Clin Pharmacol. 2017; 73:1041–48. https://doi.org/10.1007/s00228-017-2266-7 [PubMed]
- 31. Schwartz J, Weiss ST. Cigarette smoking and peripheral blood leukocyte differentials. Ann Epidemiol. 1994; 4:236–42. https://doi.org/10.1016/1047-2797(94)90102-3 [PubMed]
- 32. Houseman EA, Accomando WP, Koestler DC, Christensen BC, Marsit CJ, Nelson HH, Wiencke JK, Kelsey KT. DNA methylation arrays as surrogate measures of cell mixture distribution. BMC Bioinformatics. 2012; 13:86. https://doi.org/10.1186/1471-2105-13-86 [PubMed]
- 33. Bell B, Rose CL, Damon A. The Normative Aging Study: an interdisciplinary and longitudinal study of health and aging. Aging Hum Dev. 1972; 3:5–17. https://doi.org/10.2190/GGVP-XLB5-PC3N-EF0G
- 34. Mordukhovich I, Coull B, Kloog I, Koutrakis P, Vokonas P, Schwartz J. Exposure to sub-chronic and long-term particulate air pollution and heart rate variability in an elderly cohort: the Normative Aging Study. Environ Health. 2015; 14:87. https://doi.org/10.1186/s12940-015-0074-z [PubMed]
- 35. Nyhan MM, Coull BA, Blomberg AJ, Vieira CL, Garshick E, Aba A, Vokonas P, Gold DR, Schwartz J, Koutrakis P. Associations Between Ambient Particle Radioactivity and Blood Pressure: The NAS (Normative Aging Study). J Am Heart Assoc. 2018; 7:e008245. https://doi.org/10.1161/JAHA.117.008245 [PubMed]
- 36. Panni T, Mehta AJ, Schwartz JD, Baccarelli AA, Just AC, Wolf K, Wahl S, Cyrys J, Kunze S, Strauch K, Waldenberger M, Peters A. Genome-Wide Analysis of DNA Methylation and Fine Particulate Matter Air Pollution in Three Study Populations: KORA F3, KORA F4, and the Normative Aging Study. Environ Health Perspect. 2016; 124:983–90. https://doi.org/10.1289/ehp.1509966 [PubMed]
- 37. Dai L, Mehta A, Mordukhovich I, Just AC, Shen J, Hou L, Koutrakis P, Sparrow D, Vokonas PS, Baccarelli AA, Schwartz JD. Differential DNA methylation and PM2.5 species in a 450K epigenome-wide association study. Epigenetics. 2017; 12:139–48. https://doi.org/10.1080/15592294.2016.1271853 [PubMed]
- 38. Teschendorff AE, Marabita F, Lechner M, Bartlett T, Tegner J, Gomez-Cabrero D, Beck S. A beta-mixture quantile normalization method for correcting probe design bias in Illumina Infinium 450 k DNA methylation data. Bioinformatics. 2013; 29:189–96. https://doi.org/10.1093/bioinformatics/bts680 [PubMed]
- 39. Hannum G, Guinney J, Zhao L, Zhang L, Hughes G, Sadda S, Klotzle B, Bibikova M, Fan JB, Gao Y, Deconde R, Chen M, Rajapakse I, et al. Genome-wide methylation profiles reveal quantitative views of human aging rates. Mol Cell. 2013; 49:359–67. https://doi.org/10.1016/j.molcel.2012.10.016 [PubMed]
- 40. Levine ME, Lu AT, Quach A, Chen BH, Assimes TL, Bandinelli S, Hou L, Baccarelli AA, Stewart JD, Li Y, Whitsel EA, Wilson JG, Reiner AP, et al. An epigenetic biomarker of aging for lifespan and healthspan. Aging (Albany NY). 2018; 10:573–91. https://doi.org/10.18632/aging.101414 [PubMed]