


Introduction
Lung cancer is the leading cause of cancer-related deaths worldwide (18.4% of total cancer deaths), with an estimated 1.76 million deaths every year [1]. Lung adenocarcinoma (LUAD) is the most common type, comprising ~40% of all cases of lung cancer, and its incidence is increasing globally [2]. With advancements in diagnostic techniques, more LUAD patients can be diagnosed at an earlier stage. Early-stage LUAD patients have a relatively superior prognosis, but even with complete surgical resection, nearly 33%–52% of patients still die from cancer within five years [3]. Molecular heterogeneity among patients might account for individual variation in LUAD survival, although the mechanism largely remains unclear [4].
Recently, great efforts have been put into using gene expression or DNA methylation data to predict the prognosis of non-small cell lung cancer (NSCLC) [5–7]. Several studies have explored prognostic prediction models for NSCLC or LUAD using molecular biomarkers from single omics data, providing opportunities to identify patients with heterogeneous prognoses [8, 9]. However, a single omics approach is insufficient to reveal the overall molecular system [10]. Accumulating evidence suggests that an integration of trans-omics features will provide comprehensive insights into multi-layered molecular mechanisms [11, 12]. Teiseira et al. [13]. Recently profiled the genomic, transcriptomic, and epigenomic landscape of prelesions of lung squamous cancer and successfully generated a predictive model to identify which lesions will progress with remarkable accuracy. However, limited prognostic models have focused on early-stage LUAD, especially with trans-omics predictors. Thus, there may be significant possibilities to develop a trans-omics prognostic model for early-stage LUAD.
Identification of molecular changes in significant oncogenes or tumor suppressor genes associated with cancer prognosis might guide early treatment and help improve survival [14]. However, most newly found genes dysregulated in cancer tissues have no effect on the neoplastic process [15]. Thus, it might be better to focus on acknowledged cancer-related genes rather than examine genes on a genome-wide scale—which is akin to looking for a needle in a haystack—to identify LUAD prognostic biomarkers. Recently, the Catalogue of Somatic Mutations in Cancer (COSMIC) identified 719 cancer-related genes through the ongoing Cancer Gene Census project. Notably, more than half of those genes participate in the development and progression of multiple tumors [16].
In this study, we hypothesized that some cancer-related genes may possess inherent potential to uncover early-stage LUAD patients with heterogeneous survival. We performed a comprehensive study of early-stage LUAD to identify prognostic-associated biomarkers from a cancer-related gene set and further accurately predicted mortality risk for patients using a trans-omics panel of clinical–DNA methylation–gene expression biomarkers.
Results
Clinical and demographic characteristics of the study population were presented in Table 1. There were 493 early-stage patients in the discovery phase (Harvard, Spain, Norway, and Sweden) and 332 early-stage patients in the validation phase (TCGA). The majority (75.2%) of LUAD patients had stage I disease. Gene expression data was available for 133 patients in Norway and 328 patients in TCGA.
Table 1. Baseline characteristics of the study population.
| Variables | Discovery phase | Validation phase | All samples (N = 825) | ||||||||||||||||||||||||||||||||||||||||||||||||||||||||||||||||||||||||||||||||||||||||||||||||
| Harvard (N = 96) | Spain (N = 183) | Norway (N = 133) | Sweden (N = 81) | TCGA (N = 332) | |||||||||||||||||||||||||||||||||||||||||||||||||||||||||||||||||||||||||||||||||||||||||||||||
| Age (years) | 67.1 ± 9.9 | 65.6 ± 10.5 | 65.5 ± 9.3 | 66.1 ± 10.4 | 65.4 ± 9.8 | 65.7 ± 9.6 | |||||||||||||||||||||||||||||||||||||||||||||||||||||||||||||||||||||||||||||||||||||||||||||
| Gender, n (%) | |||||||||||||||||||||||||||||||||||||||||||||||||||||||||||||||||||||||||||||||||||||||||||||||||||
| Female | 50 (52.1) | 89 (48.6) | 62 (46.6) | 35 (43.2) | 152 (45.8) | 388 (47.0) | |||||||||||||||||||||||||||||||||||||||||||||||||||||||||||||||||||||||||||||||||||||||||||||
| Smoking status, n(%) | |||||||||||||||||||||||||||||||||||||||||||||||||||||||||||||||||||||||||||||||||||||||||||||||||||
| Never | 17 (17.7) | 28 (15.6) | 17 (12.8) | 17 (21.0) | 47 (14.6) | 126 (15.5) | |||||||||||||||||||||||||||||||||||||||||||||||||||||||||||||||||||||||||||||||||||||||||||||
| Former | 52 (54.2) | 97 (53.9) | 74 (55.6) | 39 (48.1) | 194 (60.2) | 456 (56.2) | |||||||||||||||||||||||||||||||||||||||||||||||||||||||||||||||||||||||||||||||||||||||||||||
| Current | 27 (28.1) | 55 (30.6) | 42 (31.6) | 25 (30.9) | 81 (25.2) | 230 (28.3) | |||||||||||||||||||||||||||||||||||||||||||||||||||||||||||||||||||||||||||||||||||||||||||||
| Clinical stage, n(%) | |||||||||||||||||||||||||||||||||||||||||||||||||||||||||||||||||||||||||||||||||||||||||||||||||||
| I | 72 (75.0) | 151 (82.5) | 93 (69.9) | 74 (91.4) | 230 (69.3) | 620 (75.2) | |||||||||||||||||||||||||||||||||||||||||||||||||||||||||||||||||||||||||||||||||||||||||||||
| II | 24 (25.0) | 32 (17.5) | 40 (30.1) | 7 (8.6) | 102 (30.7) | 205 (24.8) | |||||||||||||||||||||||||||||||||||||||||||||||||||||||||||||||||||||||||||||||||||||||||||||
| Chemotherapy, n(%) | |||||||||||||||||||||||||||||||||||||||||||||||||||||||||||||||||||||||||||||||||||||||||||||||||||
| Yes | 4 (4.2) | 14 (7.7) | 31 (23.3) | 4 (4.9) | 20 (6.0) | 73 (8.8) | |||||||||||||||||||||||||||||||||||||||||||||||||||||||||||||||||||||||||||||||||||||||||||||
| No | 92 (95.8) | 142 (77.6) | 102 (76.7) | 50 (61.7) | 109 (32.8) | 495 (60.0) | |||||||||||||||||||||||||||||||||||||||||||||||||||||||||||||||||||||||||||||||||||||||||||||
| Unknown | 0 | 27 | 0 | 27 | 203 | 257 | |||||||||||||||||||||||||||||||||||||||||||||||||||||||||||||||||||||||||||||||||||||||||||||
| Radiotherapy, n(%) | |||||||||||||||||||||||||||||||||||||||||||||||||||||||||||||||||||||||||||||||||||||||||||||||||||
| Yes | 12 (12.5) | 8 (8.9) | 1 (0.8) | 0 (0.0) | 6 (4.7) | 27 (4.8) | |||||||||||||||||||||||||||||||||||||||||||||||||||||||||||||||||||||||||||||||||||||||||||||
| No | 84 (87.5) | 148 (91.1) | 132 (99.2) | 54 (100.0) | 123 (95.3) | 541 (95.2) | |||||||||||||||||||||||||||||||||||||||||||||||||||||||||||||||||||||||||||||||||||||||||||||
| Unknown | 0 | 27 | 0 | 27 | 203 | 257 | |||||||||||||||||||||||||||||||||||||||||||||||||||||||||||||||||||||||||||||||||||||||||||||
| Adjuvant therapy, n(%) | |||||||||||||||||||||||||||||||||||||||||||||||||||||||||||||||||||||||||||||||||||||||||||||||||||
| Yes | 14 (14.5) | 21 (13.4) | 32 (24.0) | 4 (7.4) | 25 (19.3) | 96 (16.9) | |||||||||||||||||||||||||||||||||||||||||||||||||||||||||||||||||||||||||||||||||||||||||||||
| No | 82 (85.5) | 135 (86.6) | 101 (76.0) | 50 (92.6) | 104 (80.7) | 472 (83.1) | |||||||||||||||||||||||||||||||||||||||||||||||||||||||||||||||||||||||||||||||||||||||||||||
| Unknown | 0 | 27 | 0 | 27 | 203 | 257 | |||||||||||||||||||||||||||||||||||||||||||||||||||||||||||||||||||||||||||||||||||||||||||||
| Survival year | |||||||||||||||||||||||||||||||||||||||||||||||||||||||||||||||||||||||||||||||||||||||||||||||||||
| Median survival year | 7.1 | 9.6 | 7.2 | 7.1 | 4.4 | 7.4 | |||||||||||||||||||||||||||||||||||||||||||||||||||||||||||||||||||||||||||||||||||||||||||||
| Censored ratea, % | 0.3 | 58.5 | 68.4 | 40.7 | 80.7 | 63.4% | |||||||||||||||||||||||||||||||||||||||||||||||||||||||||||||||||||||||||||||||||||||||||||||
| a Censored rate is proportion of samples lost to follow-up or alive at end of the study. | |||||||||||||||||||||||||||||||||||||||||||||||||||||||||||||||||||||||||||||||||||||||||||||||||||
| TCGA: The Cancer Genome Atlas | |||||||||||||||||||||||||||||||||||||||||||||||||||||||||||||||||||||||||||||||||||||||||||||||||||
Prognosis-associated DNA methylation and gene expression probes
In total, 719 cancer-related genes from COSMIC and its corresponding 12,806 DNA methylation probes were used in this study. Ranger screened out 62 DNA methylation probes in the discovery phase according to variable importance score (VIS) (Figure 1A). Further, 38 DNA methylation probes were retained in the validation phase using the same method (Figure 1B). There were 27 overlapping DNA methylation probes between the phases, which were further analyzed by multi-Cox regression simultaneously. The 12 DNA methylation probes were significantly associated with prognosis after correction for multiple comparisons (Supplementary Table 1).
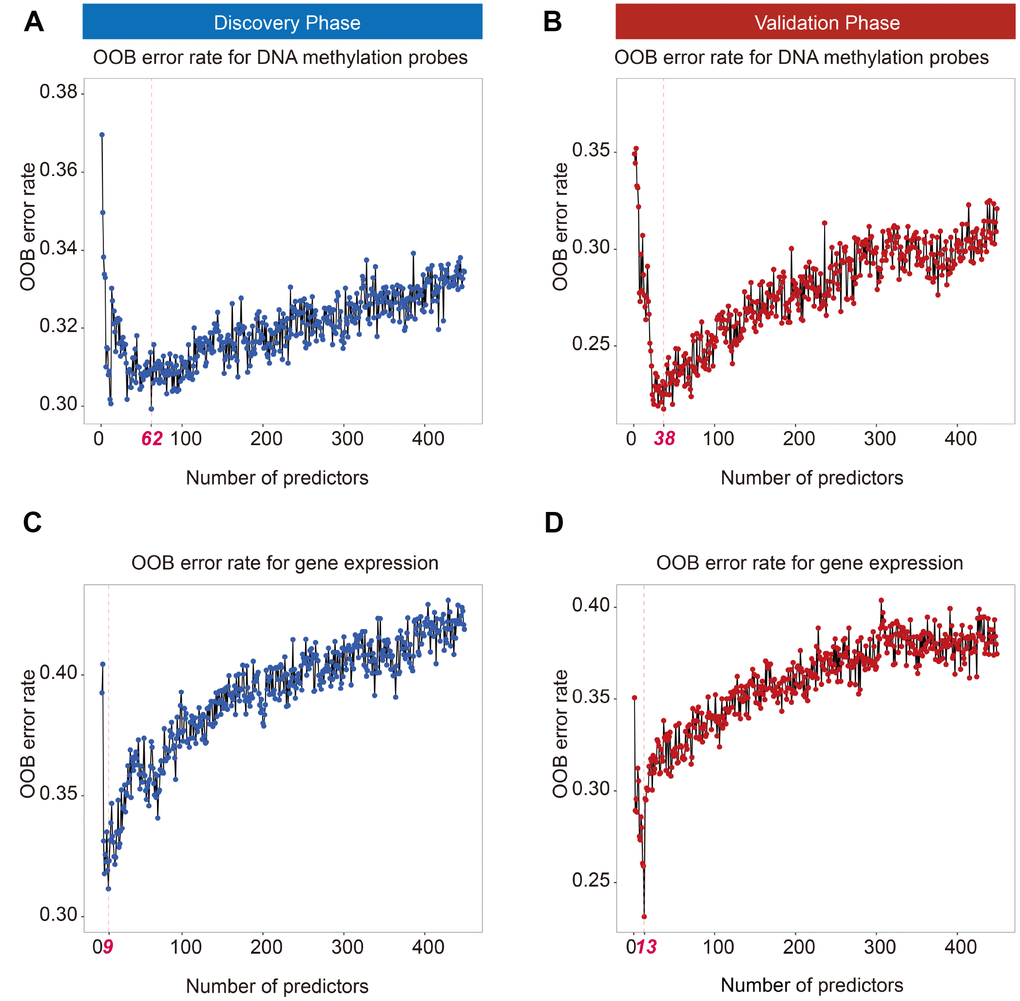
Figure 1. Out of bag (OOB) error rate derived from weighted random forest analysis. Top 62 and 38 DNA methylation probes in the discovery (A) and validation phases (B) reached a minimum OOB error rate. Top 9 and 13 mRNAs in the discovery (C) and validation phases (D) reached a minimum OOB error rate.
For transcriptomic analysis, the same procedure was applied to screen gene expression probes. Ranger identified 9 gene expression probes in the discovery phase (Figure 1C) and 13 gene expression probes in the validation phase (Figure 1D). Seven overlapping genes—BLM, CASC5, FHIT, GMPS, MSH2, SLC34A2, and ZNF429—were significantly associated with early-stage LUAD survival (Supplementary Table 2).
Causal mediation analysis
To detect the potential mechanism by which DNA methylation affects overall survival (OS), all pairwise DNA methylation–gene expression–LUAD survival pathways were evaluated, with a consideration of trans- and cis- regulation patterns between DNA methylation and gene expression. We observed six potential causal pathways that were significant in both phases (Supplementary Table 3). Further, we calculated DNA methylation risk score (MRS) and gene expression risk score (GRS) by weighted linear combination of biomarkers using ln(HRadjusted) as weights. As a result, the effect of MRS on survival was significantly mediated through GRS in both phases (discovery: HRindirect = 1.17, 95% CI = 1.01–1.37, P = 0.04, proportion mediated: 32.2%; validation: HRindirect = 1.32, 95% CI = 1.17–1.50, P = 3.89×10⁻⁴, proportion mediated: 47.1%) (Figure 2).
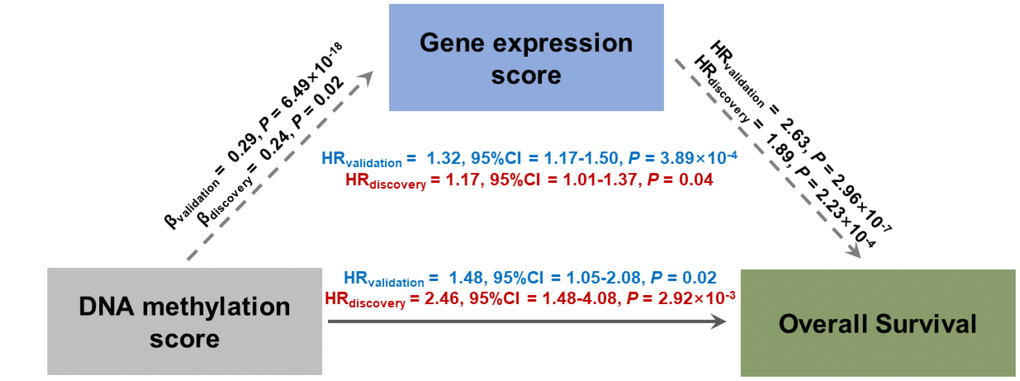
Figure 2. Direct and indirect effects of DNA methylation on lung adenocarcinoma survival mediated through gene expression in casual mediation analysis. DNA methylation risk score (MRS) and gene expression risk score (GRS) were calculated by linear combination with a weighted ln(HRadjusted) of identified probes.
Patient discrimination performance of trans-omics biomarkers panel
We used the iCluster plus machine learning approach using a joint latent variable model for fusing clinical variables (age, gender, smoking status, and clinical stage) and trans-omics biomarkers (12 DNA methylation and 7 gene expression probes) to explore the classification ability of these predictors. We compared (i) clinical classifiers with (ii) clinical and trans-omics classifiers. Clinical information only was insufficient to discriminate patients into high- and low-mortality groups in both discovery and validation phases (HRdiscovery = 1.32, 95% CI = 0.78–2.81, Pdiscovery = 0.363; HRvalidation = 1.52, 95% CI = 0.86–2.53, Pvalidation = 0.136) (Figure 3A, 3B). However, adding DNA methylation and gene expression biomarkers resulted in significantly different survival curves between the two groups in both phases (HRdiscovery = 2.67, 95% CI = 1.26–5.53, Pdiscovery = 0.011; HRvalidation = 2.32, 95% CI = 1.32–4.31, Pvalidation = 2.71×10⁻³) (Figure 3C, 3D), indicating good discrimination performance of the trans-omics biomarkers panel.
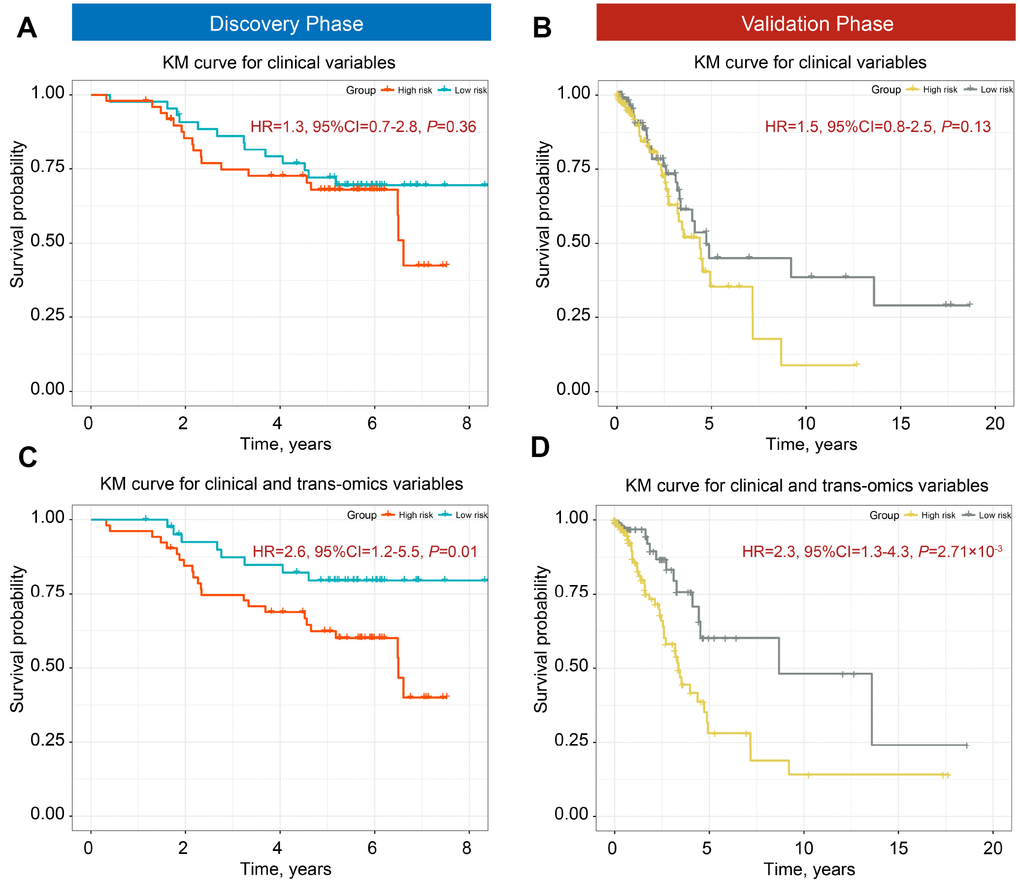
Figure 3. Kaplan-Meier (KM) survial curves of high- and low-mortality risk groups divided by iCluster. Classification ability of clinical information for discovery (A) and validation phases (B). Distinction ability of clinical information adding trans-omics biomarkers of DNA methylation and gene expression for the discovery (C) and validation phases (D).
Survival prediction performance of trans-omics biomarkers panel
Besides discrimination, we used two prediction models (i) a clinical model, and (ii) a trans-omics model (clinical + MRS + GRS) to predict 3- and 5-year survival, which are the two important clinical prognostic outcomes. A risk score model was constructed with a linear combination of predictable factors weighted by the multi-Cox coefficient. Compared to the model including clinical information only, the trans-omics model significantly improved prediction accuracy in the discovery phase, with AUCs up to 86.1% for 3-year (AUC3-year: 17.9% increase, P = 0.008) (Figure 4A) and 87.2% for 5-year survival prediction (AUC5-year: 18.3% increase, P = 0.009) (Figure 4C). The validation phase further confirmed a significant improvement in prediction with the trans-omics model, with AUCs up to 84.1% for 3-year (AUC3-year: 13.1% increase, P = 0.039) (Figure 4B) and 85.3% for 5-year survival prediction (AUC5-year: 16.4% increase, P = 0.041) (Figure 4D).
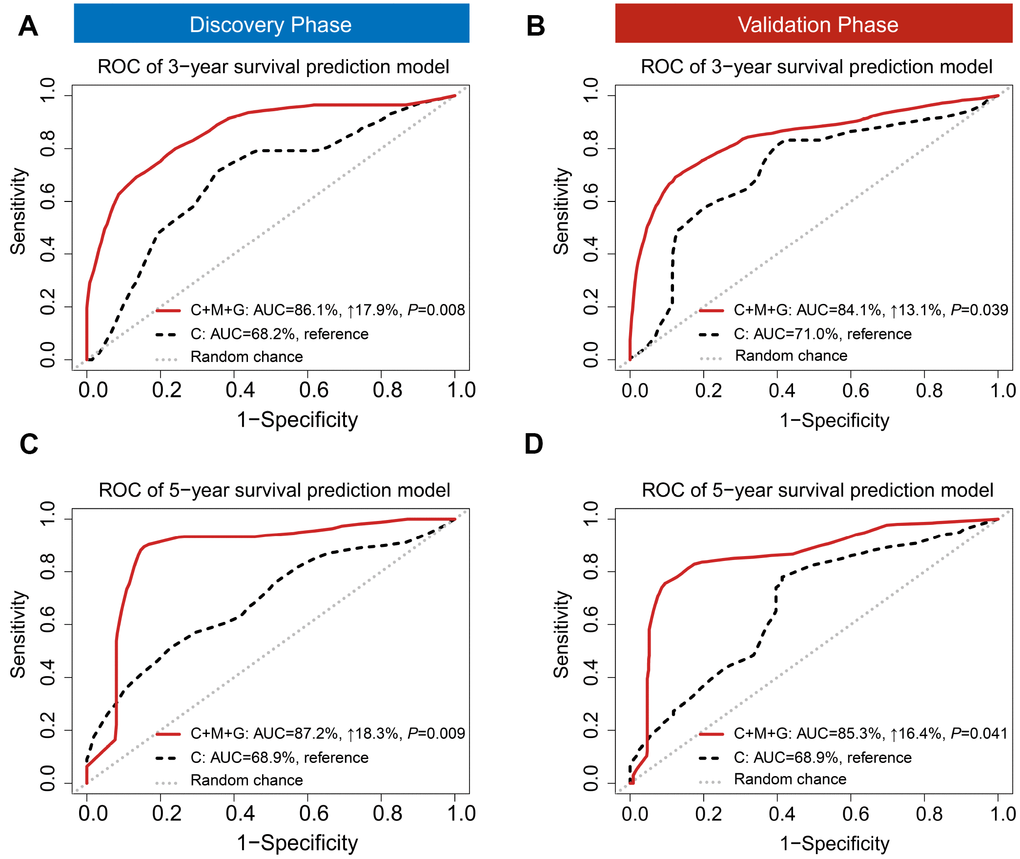
Figure 4. Time-dependent receiver operating characteristic (ROC). ROC was used to evaluate the performance of prognostic models for 3-year (A) and 5-year (B) overall survival prediction in the discovery phase. ROC also was used to evaluate the performance of prognostic models for 3-year (C) and 5-year (D) overall survival prediction in the validation phase. C: clinical model; C+M+G: clinical, DNA methylation, and gene expression model.
Nomogram development and validation
To easily apply our model in clinical practice, we combined clinical information and trans-omics features of patients from Norway to develop a nomogram and further test it in patients from TCGA. The nomogram was developed based on results of the multivariable Cox proportional hazards model. A weighted score calculated using all predictors was used to estimate 3- and 5-year OS (Figure 5). Discrimination and calibration methods were applied in both discovery and validation phases. c-index was calculated as 0.81 for the discovery phase (95% CI = 0.63–0.98, P = 6.42×10⁻¹²) and 0.77 for the validation phase (95% CI = 0.58–0.96, P = 6.80×10⁻⁶), indicating relatively good prediction of the nomogram. Calibration plots showed good accordance between observed OS and predicted OS for both 3- and 5-year survival in discovery and validation phases (Supplementary Figure 1).
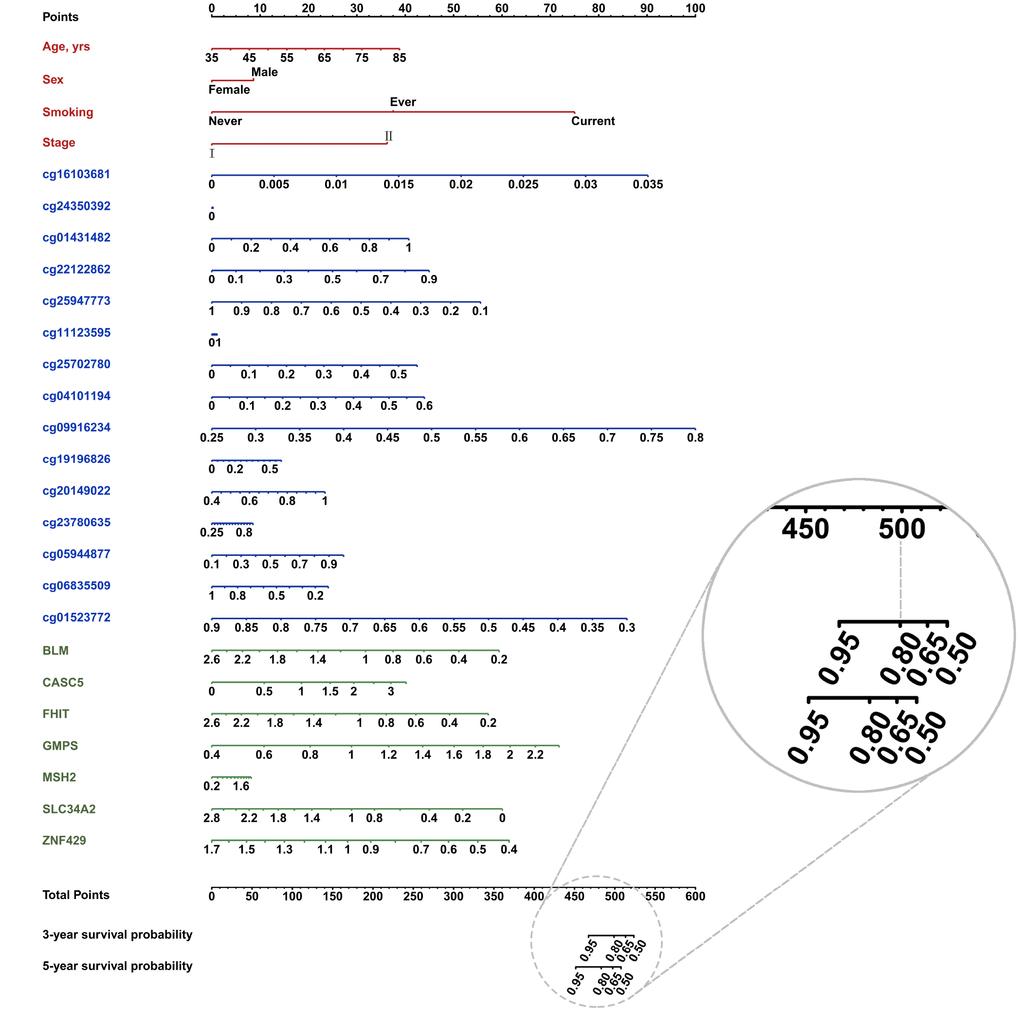
Figure 5. Nomogram constructed with clinical (red font) and trans-omics biomarkers (blue and green font) for overall survival. The probability of each predictor can be converted into the points axis in the top of the nomogram. The summary of these points of each predictor corresponded the total points at the bottom of the nomogram. After adding the points of each predictor in the total points axis, a patient’s probability of survival (3- and 5-year) can be found at the bottom of the nomogram. For example, if a patient got a score (e.g. 500), the 3-year survival probability will be corresponding to 0.80.
Sensitivity analysis
Given the potential clinical value of chemotherapy on early-stage LUAD prognosis, we further performed a sensitivity analysis to test the prediction ability of trans-omics panel using patients with available chemotherapy information. Compared to the model including clinical information only, the trans-omics model significantly improved prediction accuracy in the discovery phase, with AUCs up to 89.6% for 3-year (AUC3-year: 19.1% increase, P = 0.003) (Supplementary Figure 3A) and 90.9% for 5-year survival prediction (AUC5-year: 19.6% increase, P = 0.004) (Supplementary Figure 3C). The validation phase further confirmed a significant improvement, with AUCs up to 85.6% for 3-year (AUC3-year: 20.4% increase, P = 0.016) (Supplementary Figure 3B) and 87.2% for 5-year survival prediction (AUC5-year: 22.8% increase, P = 0.032) (Supplementary Figure 3D).
Further, we categorized all patients into two groups (age < 65 and age ≥ 65) based on the definition of elderly using UN standard [17], and evaluated whether prognostic model incorporating trans-omics biomarkers has different prediction ability between two age groups. The risk score of trans-omics biomarkers showed diverse effect on early-stage LUAD prognosis, Supplementary Figure 4 (HR<65 = 2.18, 95%CI = 1.67-2.85, P = 5.11×10⁻⁸; HR≥65 = 3.16, 95%CI = 2.59-3.85, P = 3.52×10⁻¹²), which indicated an significant heterogeneity between the two groups (I2 = 79%, P = 0.03). As shown in Supplementary Figure 5, our model achieved a superior prediction performance in elderly group: AUC≥65 = 87.6% v.s. AUC<65 = 80.3% (P = 1.21×10⁻³) for 3-year survival prediction; AUC≥65 = 91.0% v.s. AUC<65 = 79.9% (P = 0.021) for 5-year survival prediction.
Discussion
Because the mechanisms underlying cancer prognosis form a complex regulatory network, integration of trans-omics data could improve prognostic value [18]. In this study, we identified 7 cancer-related genes and 12 DNA methylation probes as potentially associated with early-stage LUAD survival. By integrating clinical information and trans-omics biomarkers, we effectively classified early-stage LUAD patients into high- and low-mortality risk groups. Further, our model with a trans-omics panel of biomarkers showed preferable prediction performance for 3- and 5-year mortality.
Age is a significant risk factor of prognosis for early-stage LUAD patients, with adjustment of other covariates (HRdiscovery = 1.02, 95% CI = 1.01-1.03, Pdiscovery = 0.038; HRvalidation = 1.04, 95% CI = 1.01-1.08, Pvalidation = 7.35×10⁻³). Also, age was incorporated into lung cancer prognostic index in previous studies, and elderly lung cancer patients tended to have worse prognostic condition [19]. Thus, we applied our proposed model in elderly and young groups, and revealed a preferable prediction performance in elderly group for both 3- and 5-year survival, which provided insights into the exclusive benefit of clinical application for elderly early-stage LUAD patients.
To the best of our knowledge, previous studies have focused on NSCLC survival prediction, but few have examined early-stage LUAD survival prediction. However, most current prediction models are derived from clinical trials with small sample sizes [20] or single omics data [21–23]. To compare the value of our proposed model, we performed a systematic review of published literature by querying PubMed using the following search terms: “((early stage) OR (stage I) OR (stage II)) AND (lung adenocarcinoma) AND (prognosis) AND ((prediction) OR (AUC) OR (c-index))” through April 29, 2019. The complete search strategy is provided in Supplementary Figure 2.
In total, we retrieved 110 articles. After filtering by briefly screening titles and abstracts and excluding articles with irrelevant objectives or animal studies, we critically reviewed 6 potentially relevant papers. This analysis of published literature revealed that our model is more accurate than all existing models, Supplementary Table 4. Among these models, the best AUC (0.79) came from a study with only 59 patients without validation, while a study with the largest sample size (N = 830) and validation produced a model with low AUC (0.65). Our study sample size (N = 825) was comparable to the largest previous study, and we observed acceptacble AUCs (≥0.84) in both discovery and validation phases that were superior to any previous models.
Further, we calculated two indexes (AUC and c-index) to evaluate our model. Those indexes differed in numerical representation because of discrepant calculation patterns [24, 25]. For binary outcomes, the values of AUC and c-index are theoretically equivalent. However, the latter is lower for survival outcomes due to mean calculations made throughout the follow-up period. Nonetheless, the c-index calculated from our model was superior to that of previous studies.
We identified 7 genes with documented activity relevant to cancer development or prognosis or evidence of mutations in cancer that change activity of the gene product in a way that promotes oncogenic transformation. All genes discovered in this study were confirmed to participate in cancer development or prognosis. For example, SLC34A2 produces NaPi2b, a type II sodium-phosphate cotransporter that is highly expressed on tumor surfaces of NSCLC [26]. CASC5 interacts with high expression of ZWINT to lead to poor OS and disease-free survival in NSCLC [27]. Further, small cell lung tumors (80%) and NSCLC (40%) show abnormalities in RNA transcripts of FHIT, and 76% of the tumors exhibit loss of FHIT alleles [28]. GMPs indicate an aggressive angiogenic phenotype associated with poor prognosis in NSCLC [29]. In addition, MSH2 is a key DNA mismatch repair protein with an important role in genomic stability, which has been confirmed to affect the risk of death in early-stage NSCLC. To our knowledge, however, there is a dearth of evidence on the role of ZNF429 and BLM on the prognosis of early-stage NSCLC.
Our study identified 12 DNA methylation probes, with detailed information displayed in Supplementary Table 5. Few of their corresponding gene expression levels significantly affected OS in both discovery and validation phases. In transcript analysis, we identified 7 genes with expression robustly associated with OS. Accumulative studies indicate that an effect transmission mechanism might exist between DNA methylation probes and gene expression by trans-regulation patterns [30, 31]. Thus, we assumed that these 12 DNA methylation probes might affect OS partly and potentially through the 7 prognostic genes. In this way, causal mediation analysis was used to explore DNA methylation–gene expression–OS pathways. The effects of DNA methylation probes were decomposed as direct effects (affects OS independently) and indirect effects (affects OS through gene expression), and the significant indirect effects confirmed our speculation.
Our study had several advantages. (i) To our knowledge, our model is the only one with a trans-omics panel of biomarkers and achieves the best performance for early-stage LUAD survival prediction. (ii) The sample size of our study is considerably large and is comparable to the largest existing published prognostic study of early-stage LUAD. Moreover, our model also performed well in an independent population. (iii) We used two advanced statistical methods (ranger and iCluster plus) to filter out noisy biomarkers and integratively cluster patients. Ranger which can pick up molecular predictors with either main effects or interactions, is a fast implementation of random forests adjusted for covariates, and is particularly suited for signal-noise ratio enrichment in high-dimensional data analysis [32]. iCluster plus is a significant enhancement of the iCluster method, which integrates diverse data types and performs well in recognition of high- and low-mortality risk patterns [33]. (iv) Besides correction of multiple comparisons using FDR, we also used two independent phases to control false positives in biomarker testing, guaranteeing the robustness of our results.
However, we also acknowledge several limitations of our study. (i) The relationship among DNA methylation, gene expression, and OS lacks biological evidence. Thus, the association should be interpreted with caution and warrants further functional experiments. (ii) The censoring rate is high in TCGA, which may lead to low power in statistical analysis. Thus, the successfully validated biomarkers were very conservative. However, our model still achieves preferable performance, indicating its robustness. (iii) We had very limited clinical information, since several cohorts were initiated decades ago. At that time, there were few electronic records for patients. However, molecular information has significantly improved prediction performance. Adding information for laboratory tests, medical histories, and imaging examinations will improve accuracy but will also bring inconvenience for clinical application of a prediction model. Based on our results, a few easily available clinical predictors plus dozens of molecular predictors can present a balance between convenience of application and accuracy of prediction.
In conclusion, using a machine learning method and two-stage design, we built a prediction model incorporating 12 DNA methylation probes and 7 gene expression probes. These 19 molecular predictors provide perspective to design a cost-effective chip that can detect biomarkers exclusively for early-stage LAUD prognosis prediction, which will benefit both physicians and patients in clinical applications.
Methods
Study population
Early-stage (stage I and II) LUAD patients (n = 825) were enrolled from the following five independent study centers. (1) Harvard [34]. Newly diagnosed patients with histologically confirmed primary LUAD (n = 96) were recruited at Massachusetts General Hospital (MGH) since 1992. Each specimen was evaluated by an MGH pathologist for amount (tumor cellularity > 70%) and quality of tumor cells and histologically classified using World Health Organization criteria. The study protocol was approved by the Institutional Review Boards at Harvard School of Public Health and MGH. (2) Spain [35]. Patients (n = 183) were recruited at eight sub-centers, including the Bellvitge Biomedical Research Institute (Spain), Center for Applied Medical Research (Spain), Catalan Institute of Oncology (Spain), IRCCS Foundation National Cancer Institute (Italy), University of Turin (Italy), University of Liverpool Cancer Research Centre (UK), Centre Hospitalier Universitaire A Michallon (France), and University of Michigan Medical School (USA), and the median clinical follow-up was 7.2 years. The study was approved by the Bellvitge Biomedical Research Institute Institutional Review Board. (3) Norway [36]. Patients (n = 133) were recruited at Oslo University Hospital-Rikshospitalet from 2006–2011. The project was approved by the Oslo University Institutional Review Board and Regional Ethics Committee (S-05307). (4) Sweden [37]. Patients (n = 81) were recruited at Skåne University Hospital (Lund, Sweden) from 2004–2008. Tumor DNA was collected from early-stage lung cancer patients who underwent operation at the hospital. The study was approved by the Regional Ethical Review Board in Lund, Sweden (registration no. 2004/762 and 2008/702). (5) TCGA. We also included patients (n = 332) from The Cancer Genome Atlas (TCGA), for which the TCGA workgroup generated level-1 HumanMethylation450 DNA methylation data (image data) and performed mRNA sequencing data processing and quality control. Datasets were downloaded on October 1, 2015.
All patients provided written informed consent under the approval of the institutional review boards of each center. Data from the international study centers were harmonized as previously described [38–41]. Quality control procedures of DNA methylation and mRNA expression data are presented in Supplementary Material.
Statistical analysis
In this study, all significant results in the discovery phase were further independently confirmed in the validation phase. Patients (n = 493) from Harvard, Spain, Norway, and Sweden were assigned to the discovery phase. Patients (n = 332) from TCGA were assigned to the validation phase. The work flow chart is shown in Figure 6. First, ranger, an improved version of random forest incorporating adjustment of covariates, was used to evaluate importance of each DNA methylation probe based on VIS [32]. All DNA methylation probes were ranked by VIS in descending order. The sliding windows sequential forward feature selection method was applied to identify top important probes, which means probes were sequentially included in the model as predictors until the model reached the minimum out of bag (OOB) error rate [42]. We screened out important probes in the discovery and validation phases. Overlapping probes in both phases were retained for subsequent analysis. The same pipeline was also used to screen out important gene expression variables. Second, a multivariate Cox regression model was further used to confirm the association between each biomarker and survival with adjustment for age, gender, clinical stage, smoking status, and study center. Hazard ratio (HR) and 95% confidence interval (CI) were described per 1% methylation increment. Multiple comparison correction was performed using the false discovery rate (FDR) method by Benjamini-Hochberg procedure. Biomarkers with FDR-q ≤ 0.05 in the discovery phase and P ≤ 0.05 in the validation phase, as well as consistent effect directions across both phases, remained for further analysis. Third, we performed a causal mediation analysis to explore possible “DNA methylation → gene expression → LUAD survival” pathways [43]. Adjusting for the same covariates as above, the total effect of methylation on survival (HRtotal) was separated into indirect effects (HRindirect), representing the effect of methylation on survival mediated through gene expression, and direct effects (HRdirect), representing the effect of methylation on survival directly. Fourth, we used an iCluster plus algorithm that integrated clinical and trans-omics biomarkers to distinguish patients with high- and low-mortality risk groups [33, 44]. Kaplan-Meier curves and log-rank test were used to assess survival differences between groups. Fifth, we integrated clinical and trans-omics biomarkers into a Cox regression model, and time-dependent receiver operating characteristic (ROC) curves were used to measure prediction performance for 3- and 5-year survival [45]. Area under ROC (AUC) of the prediction model with or without trans-omics biomarkers was compared using bootstrap with 1000 times resampling. Finally, nomogram plots were generated, and the validation was tested by discrimination and calibration in both phases. Discrimination was estimated by concordance index (c-index), which ranges from 0.5 (completely random) to 1.0 (perfect discrimination). Calibration assesses how close the nomogram-estimated risk is to observed risk, which was depicted by a calibration plot. Bootstrap analyses with 1000 resamples were used for these analyses. All data were analyzed using R version 3.4.4 statistical software (The R Foundation).
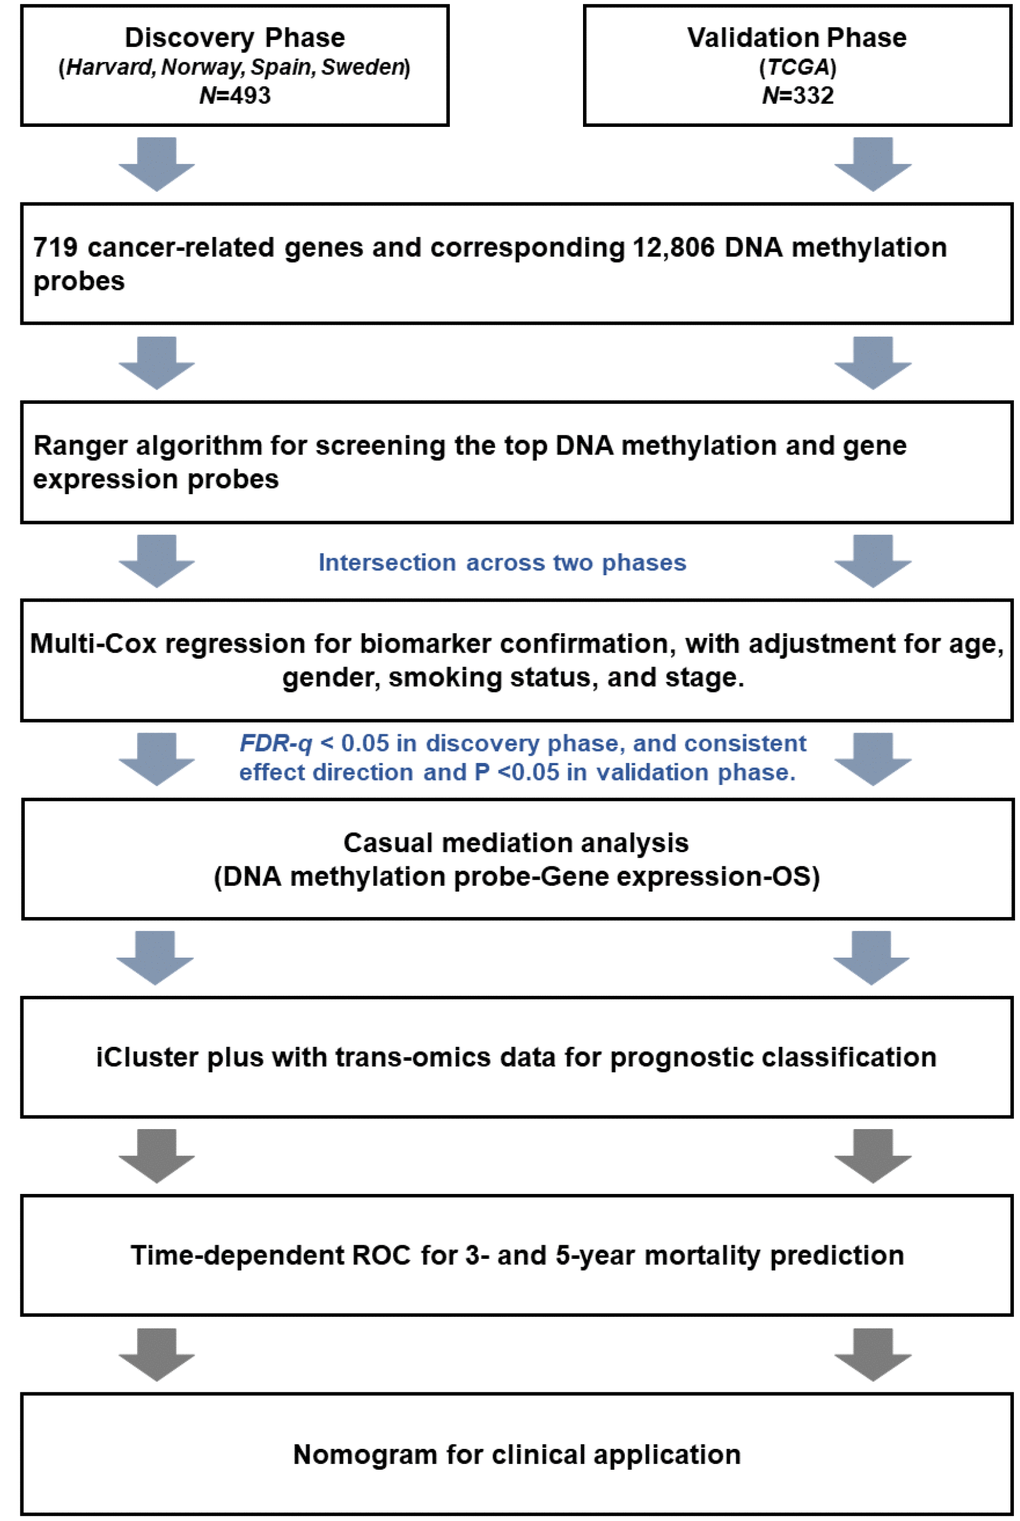
Figure 6. Flow chart of the study.
Ethics approval
The Harvard study protocol was approved by the Institutional Review Boards at Harvard School of Public Health and MGH. The Spain study was approved by the Bellvitge Biomedical Research Institute Institutional Review Board. The Norway project was approved by Oslo University Institutional Review Board and Regional Ethics Committee (S-05307). The Sweden study was approved by the Regional Ethical Review Board in Lund, Sweden (registration no. 2004/762 and 2008/702). All patients provided written informed consent.
Supplementary Materials
Abbreviations
LUAD: lung adenocarcinoma; NSCLC: none small cell lung cancer; OS: overall survival; FDR: false discovery rate; MRS: DNA methylation risk score; GRS: gene expression risk score; c-index: concordance index; ROC: receiver operating characteristic; AUC: area under ROC; HR: hazard ratio; CI: confident interval; VIS: variable importance score; OOB: out of bag; COSMIC: Catalogue of Somatic Mutations in Cancer.
Author Contributions
X.D., R.Z., Y.W., F.C., and D.C.C. contributed to the study design. R.Z., S.M., T.F., M.M.B., A.K., M.P., J.S., A.H., M.E., A.S., and L.S. contributed to data collection. R.Z., X.D., Y.W., R.W., and J.H performed statistical analysis, interpretation, and drafted the manuscript. J.H., D.Y., W.D., L.L., S.S., and Y.G. revised the manuscript. All authors contributed to critical revision of the final manuscript and approved the final version of the manuscript. F.C. and D.C.C. provided financial support and study supervision.
Acknowledgments
The authors thank TCGA for contributing clinical, DNA methylation, and RNA sequencing data, as well as all study subjects who participated in the five study cohorts.
Conflicts of Interest
The authors declare no potential conflicts of interest.
Funding
This study was supported by the National Key Research and Development Program of China (2016YFE0204900 to F.C.); National Natural Science Foundation of China (81530088 and 81473070 to F.C.); National Institute of Health (CA092824, CA209414, and ES000002 to D.C.C.); Natural Science Foundation of the Jiangsu Higher Education Institutions of China (18KJB310011 to R.Z.); China Postdoctoral Science Foundation (2018M633767 to R.Z.); and Priority Academic Program Development of Jiangsu Higher Education Institutions. Y.W. and R.Z. were partially supported by the Outstanding Young Teachers Training Program of Nanjing Medical University.
References
- 1. Bray F, Ferlay J, Soerjomataram I, Siegel RL, Torre LA, Jemal A. Global cancer statistics 2018: GLOBOCAN estimates of incidence and mortality worldwide for 36 cancers in 185 countries. CA Cancer J Clin. 2018; 68:394–424. https://doi.org/10.3322/caac.21492 [PubMed]
- 2. Shiraishi K, Kunitoh H, Daigo Y, Takahashi A, Goto K, Sakamoto H, Ohnami S, Shimada Y, Ashikawa K, Saito A, Watanabe S, Tsuta K, Kamatani N, et al. A genome-wide association study identifies two new susceptibility loci for lung adenocarcinoma in the Japanese population. Nat Genet. 2012; 44:900–03. https://doi.org/10.1038/ng.2353 [PubMed]
- 3. Tammela T, Sanchez-Rivera FJ, Cetinbas NM, Wu K, Joshi NS, Helenius K, Park Y, Azimi R, Kerper NR, Wesselhoeft RA, Gu X, Schmidt L, Cornwall-Brady M, et al. A Wnt-producing niche drives proliferative potential and progression in lung adenocarcinoma. Nature. 2017; 545:355–59. https://doi.org/10.1038/nature22334 [PubMed]
- 4. Qi L, Li T, Shi G, Wang J, Li X, Zhang S, Chen L, Qin Y, Gu Y, Zhao W, Guo Z. An individualized gene expression signature for prediction of lung adenocarcinoma metastases. Mol Oncol. 2017; 11:1630–45. https://doi.org/10.1002/1878-0261.12137 [PubMed]
- 5. Lin J, Carter CA, McGlynn KA, Zahm SH, Nations JA, Anderson WF, Shriver CD, Zhu K. A Prognostic Model to Predict Mortality among Non-Small Cell Lung Cancer Patients in the U.S. Military Health System. J Thorac Oncol. 2015; 10:1694–702. https://doi.org/10.1097/JTO.0000000000000691 [PubMed]
- 6. Zhang K, Lai Y, Axelrod R, Campling B, Hyslop T, Civan J, Solomides C, Myers RE, Lu B, Bar Ad V, Li B, Ye Z, Yang H. Modeling the overall survival of patients with advanced-stage non-small cell lung cancer using data of routine laboratory tests. Int J Cancer. 2015; 136:382–91. https://doi.org/10.1002/ijc.28995 [PubMed]
- 7. López-Encuentra A, López-Ríos F, Conde E, García-Luján R, Suárez-Gauthier A, Mañes N, Renedo G, Duque-Medina JL, García-Lagarto E, Rami-Porta R, González-Pont G, Astudillo-Pombo J, Maté-Sanz JL, et al, and Bronchogenic Carcinoma Cooperative Group of the Spanish Society of Pneumology and Thoracic Surgery (GCCB-S). Composite anatomical-clinical-molecular prognostic model in non-small cell lung cancer. Eur Respir J. 2011; 37:136–42. https://doi.org/10.1183/09031936.00028610 [PubMed]
- 8. Sperduto PW, Yang TJ, Beal K, Pan H, Brown PD, Bangdiwala A, Shanley R, Yeh N, Gaspar LE, Braunstein S, Sneed P, Boyle J, Kirkpatrick JP, et al. Estimating Survival in Patients With Lung Cancer and Brain Metastases: An Update of the Graded Prognostic Assessment for Lung Cancer Using Molecular Markers (Lung-molGPA). JAMA Oncol. 2017; 3:827–31. https://doi.org/10.1001/jamaoncol.2016.3834 [PubMed]
- 9. Nagy Á, Pongor LS, Szabó A, Santarpia M, Győrffy B. KRAS driven expression signature has prognostic power superior to mutation status in non-small cell lung cancer. Int J Cancer. 2017; 140:930–37. https://doi.org/10.1002/ijc.30509 [PubMed]
- 10. Dong X, Lin L, Zhang R, Zhao Y, Christiani DC, Wei Y, Chen F. TOBMI: trans-omics block missing data imputation using a k-Nearest Neighbor weighted approach. Bioinformatics. 2019; 35:1278–1283. https://doi.org/10.1093/bioinformatics/bty796 [PubMed]
- 11. Ma X, Liu Y, Liu Y, Alexandrov LB, Edmonson MN, Gawad C, Zhou X, Li Y, Rusch MC, Easton J, Huether R, Gonzalez-Pena V, Wilkinson MR, et al. Pan-cancer genome and transcriptome analyses of 1,699 paediatric leukaemias and solid tumours. Nature. 2018; 555:371–76. https://doi.org/10.1038/nature25795 [PubMed]
- 12. Woo HG, Choi JH, Yoon S, Jee BA, Cho EJ, Lee JH, Yu SJ, Yoon JH, Yi NJ, Lee KW, Suh KS, Kim YJ. Integrative analysis of genomic and epigenomic regulation of the transcriptome in liver cancer. Nat Commun. 2017; 8:839. https://doi.org/10.1038/s41467-017-00991-w [PubMed]
- 13. Teixeira VH, Pipinikas CP, Pennycuick A, Lee-Six H, Chandrasekharan D, Beane J, Morris TJ, Karpathakis A, Feber A, Breeze CE, Ntolios P, Hynds RE, Falzon M, et al. Deciphering the genomic, epigenomic, and transcriptomic landscapes of pre-invasive lung cancer lesions. Nat Med. 2019; 25:517–25. https://doi.org/10.1038/s41591-018-0323-0 [PubMed]
- 14. Pitiyage G, Tilakaratne WM, Tavassoli M, Warnakulasuriya S. Molecular markers in oral epithelial dysplasia: review. J Oral Pathol Med. 2009; 38:737–52. Review https://doi.org/10.1111/j.1600-0714.2009.00804.x [PubMed]
- 15. Vogelstein B, Papadopoulos N, Velculescu VE, Zhou S, Diaz LA
Jr , Kinzler KW. Cancer genome landscapes. Science. 2013; 339:1546–58. https://doi.org/10.1126/science.1235122 [PubMed] - 16. Futreal PA, Coin L, Marshall M, Down T, Hubbard T, Wooster R, Rahman N, Stratton MR. A census of human cancer genes. Nat Rev Cancer. 2004; 4:177–83. https://doi.org/10.1038/nrc1299 [PubMed]
- 17. United Nations Department of Economic and Social Affairs. The aging of populations and its economic and social implications.:New York: United Nations, 1956.
- 18. Ng SW, Mitchell A, Kennedy JA, Chen WC, McLeod J, Ibrahimova N, Arruda A, Popescu A, Gupta V, Schimmer AD, Schuh AC, Yee KW, Bullinger L, et al. A 17-gene stemness score for rapid determination of risk in acute leukaemia. Nature. 2016; 540:433–37. https://doi.org/10.1038/nature20598 [PubMed]
- 19. Alexander M, Wolfe R, Ball D, Conron M, Stirling RG, Solomon B, MacManus M, Officer A, Karnam S, Burbury K, Evans SM. Lung cancer prognostic index: a risk score to predict overall survival after the diagnosis of non-small-cell lung cancer. Br J Cancer. 2017; 117:744–51. https://doi.org/10.1038/bjc.2017.232 [PubMed]
- 20. Park MJ, Lee J, Hong JY, Choi MK, Yi JH, Lee SJ, Oh SJ, Ahn JS, Park K, Ahn MJ. Prognostic model to predict outcomes in nonsmall cell lung cancer patients treated with gefitinib as a salvage treatment. Cancer. 2009; 115:1518–30. https://doi.org/10.1002/cncr.24151 [PubMed]
- 21. Zuo S, Wei M, Zhang H, Chen A, Wu J, Wei J, Dong J. A robust six-gene prognostic signature for prediction of both disease-free and overall survival in non-small cell lung cancer. J Transl Med. 2019; 17:152. https://doi.org/10.1186/s12967-019-1899-y [PubMed]
- 22. Dehing-Oberije C, Aerts H, Yu S, De Ruysscher D, Menheere P, Hilvo M, van der Weide H, Rao B, Lambin P. Development and validation of a prognostic model using blood biomarker information for prediction of survival of non-small-cell lung cancer patients treated with combined chemotherapy and radiation or radiotherapy alone (NCT00181519, NCT00573040, and NCT00572325). Int J Radiat Oncol Biol Phys. 2011; 81:360–68. https://doi.org/10.1016/j.ijrobp.2010.06.011 [PubMed]
- 23. Dehing-Oberije C, De Ruysscher D, van der Weide H, Hochstenbag M, Bootsma G, Geraedts W, Pitz C, Simons J, Teule J, Rahmy A, Thimister P, Steck H, Lambin P. Tumor volume combined with number of positive lymph node stations is a more important prognostic factor than TNM stage for survival of non-small-cell lung cancer patients treated with (chemo)radiotherapy. Int J Radiat Oncol Biol Phys. 2008; 70:1039–44. https://doi.org/10.1016/j.ijrobp.2007.07.2323 [PubMed]
- 24. Brentnall AR, Cuzick J. Use of the concordance index for predictors of censored survival data. Stat Methods Med Res. 2018; 27:2359–73. https://doi.org/10.1177/0962280216680245 [PubMed]
- 25. Li J, Ma S. Time-dependent ROC analysis under diverse censoring patterns. Stat Med. 2011; 30:1266–77. https://doi.org/10.1002/sim.4178 [PubMed]
- 26. Lin K, Rubinfeld B, Zhang C, Firestein R, Harstad E, Roth L, Tsai SP, Schutten M, Xu K, Hristopoulos M, Polakis P. Preclinical Development of an Anti-NaPi2b (SLC34A2) Antibody-Drug Conjugate as a Therapeutic for Non-Small Cell Lung and Ovarian Cancers. Clin Cancer Res. 2015; 21:5139–50. https://doi.org/10.1158/1078-0432.CCR-14-3383 [PubMed]
- 27. Yuan W, Xie S, Wang M, Pan S, Huang X, Xiong M, Xiao RJ, Xiong J, Zhang QP, Shao L. Bioinformatic analysis of prognostic value of ZW10 interacting protein in lung cancer. Onco Targets Ther. 2018; 11:1683–95. https://doi.org/10.2147/OTT.S149012 [PubMed]
- 28. Sozzi G, Veronese ML, Negrini M, Baffa R, Cotticelli MG, Inoue H, Tornielli S, Pilotti S, De Gregorio L, Pastorino U, Pierotti MA, Ohta M, Huebner K, Croce CM. The FHIT gene 3p14.2 is abnormal in lung cancer. Cell. 1996; 85:17–26. https://doi.org/10.1016/S0092-8674(00)81078-8 [PubMed]
- 29. Tanaka F, Oyanagi H, Takenaka K, Ishikawa S, Yanagihara K, Miyahara R, Kawano Y, Li M, Otake Y, Wada H. Glomeruloid microvascular proliferation is superior to intratumoral microvessel density as a prognostic marker in non-small cell lung cancer. Cancer Res. 2003; 63:6791–94. [PubMed]
- 30. Cheng J, Wei D, Ji Y, Chen L, Yang L, Li G, Wu L, Hou T, Xie L, Ding G, Li H, Li Y. Integrative analysis of DNA methylation and gene expression reveals hepatocellular carcinoma-specific diagnostic biomarkers. Genome Med. 2018; 10:42. https://doi.org/10.1186/s13073-018-0548-z [PubMed]
- 31. Wu L, Lee SY, Zhou B, Nguyen UT, Muir TW, Tan S, Dou Y. ASH2L regulates ubiquitylation signaling to MLL: trans-regulation of H3 K4 methylation in higher eukaryotes. Mol Cell. 2013; 49:1108–20. https://doi.org/10.1016/j.molcel.2013.01.033 [PubMed]
- 32. Wright MN, Ziegler A. ranger: A Fast Implementation of Random Forests for High Dimensional Data in C plus plus and R. J Stat Softw. 2017; 77:1–17. https://doi.org/10.18637/jss.v077.i01
- 33. Mo Q, Wang S, Seshan VE, Olshen AB, Schultz N, Sander C, Powers RS, Ladanyi M, Shen R. Pattern discovery and cancer gene identification in integrated cancer genomic data. Proc Natl Acad Sci USA. 2013; 110:4245–50. https://doi.org/10.1073/pnas.1208949110 [PubMed]
- 34. Suk Heist R, Zhou W, Cogan-Drew T, Liu G, Su L, Neuberg D, Lynch TJ, Wain JC, Christiani DC. MDM2 polymorphism and recurrence-free and overall survival in early stage non-small cell lung cancer (NSCLC). J Clin Oncol. 2006; 24:7221. .
- 35. Sandoval J, Mendez-Gonzalez J, Nadal E, Chen G, Carmona FJ, Sayols S, Moran S, Heyn H, Vizoso M, Gomez A, Sanchez-Cespedes M, Assenov Y, Müller F, et al. A prognostic DNA methylation signature for stage I non-small-cell lung cancer. J Clin Oncol. 2013; 31:4140–47. https://doi.org/10.1200/JCO.2012.48.5516 [PubMed]
- 36. Bjaanæs MM, Fleischer T, Halvorsen AR, Daunay A, Busato F, Solberg S, Jørgensen L, Kure E, Edvardsen H, Børresen-Dale AL, Brustugun OT, Tost J, Kristensen V, Helland Å. Genome-wide DNA methylation analyses in lung adenocarcinomas: association with EGFR, KRAS and TP53 mutation status, gene expression and prognosis. Mol Oncol. 2016; 10:330–43. https://doi.org/10.1016/j.molonc.2015.10.021 [PubMed]
- 37. Karlsson A, Jonsson M, Lauss M, Brunnstrom H, Jonsson P, Borg A, Jonsson G, Ringner M, Planck M, Staaf J. Genome-wide DNA methylation analysis of lung carcinoma reveals one neuroendocrine and four adenocarcinoma epitypes associated with patient outcome. Clin Cancer Res. 2014; 20:6127–40. https://doi.org/10.1158/1078-0432.CCR-14-1087 [PubMed]
- 38. Zhang R, Lai L, He J, Chen C, You D, Duan W, Dong X, Zhu Y, Lin L, Shen S, Guo Y, Su L, Shafer A, et al. EGLN2 DNA methylation and expression interact with HIF1A to affect survival of early-stage NSCLC. Epigenetics. 2019; 14:118–29. https://doi.org/10.1080/15592294.2019.1573066 [PubMed]
- 39. Zhang R, Lai L, Dong X, He J, You D, Chen C, Lin L, Zhu Y, Huang H, Shen S, Wei L, Chen X, Guo Y, et al. SIPA1L3 methylation modifies the benefit of smoking cessation on lung adenocarcinoma survival: an epigenomic-smoking interaction analysis. Mol Oncol. 2019; 13:1235–48. https://doi.org/10.1002/1878-0261.12482 [PubMed]
- 40. Shen S, Zhang R, Guo Y, Loehrer E, Wei Y, Zhu Y, Yuan Q, Moran S, Fleischer T, Bjaanaes MM, Karlsson A, Planck M, Staaf J, et al. A multi-omic study reveals BTG2 as a reliable prognostic marker for early-stage non-small cell lung cancer. Mol Oncol. 2018; 12:913–24. https://doi.org/10.1002/1878-0261.12204 [PubMed]
- 41. Wei Y, Liang J, Zhang R, Guo Y, Shen S, Su L, Lin X, Moran S, Helland Å, Bjaanæs MM, Karlsson A, Planck M, Esteller M, et al. Epigenetic modifications in KDM lysine demethylases associate with survival of early-stage NSCLC. Clin Epigenetics. 2018; 10:41. https://doi.org/10.1186/s13148-018-0474-3 [PubMed]
- 42. Jiang R, Tang W, Wu X, Fu W. A random forest approach to the detection of epistatic interactions in case-control studies. BMC Bioinformatics. 2009 (Suppl 1); 10:S65. https://doi.org/10.1186/1471-2105-10-S1-S65 [PubMed]
- 43. Richiardi L, Bellocco R, Zugna D. Mediation analysis in epidemiology: methods, interpretation and bias. Int J Epidemiol. 2013; 42:1511–19. https://doi.org/10.1093/ije/dyt127 [PubMed]
- 44. Shen R, Olshen AB, Ladanyi M. Integrative clustering of multiple genomic data types using a joint latent variable model with application to breast and lung cancer subtype analysis. Bioinformatics. 2009; 25:2906–12. https://doi.org/10.1093/bioinformatics/btp543 [PubMed]
- 45. Kamarudin AN, Cox T, Kolamunnage-Dona R. Time-dependent ROC curve analysis in medical research: current methods and applications. BMC Med Res Methodol. 2017; 17:53. https://doi.org/10.1186/s12874-017-0332-6 [PubMed]