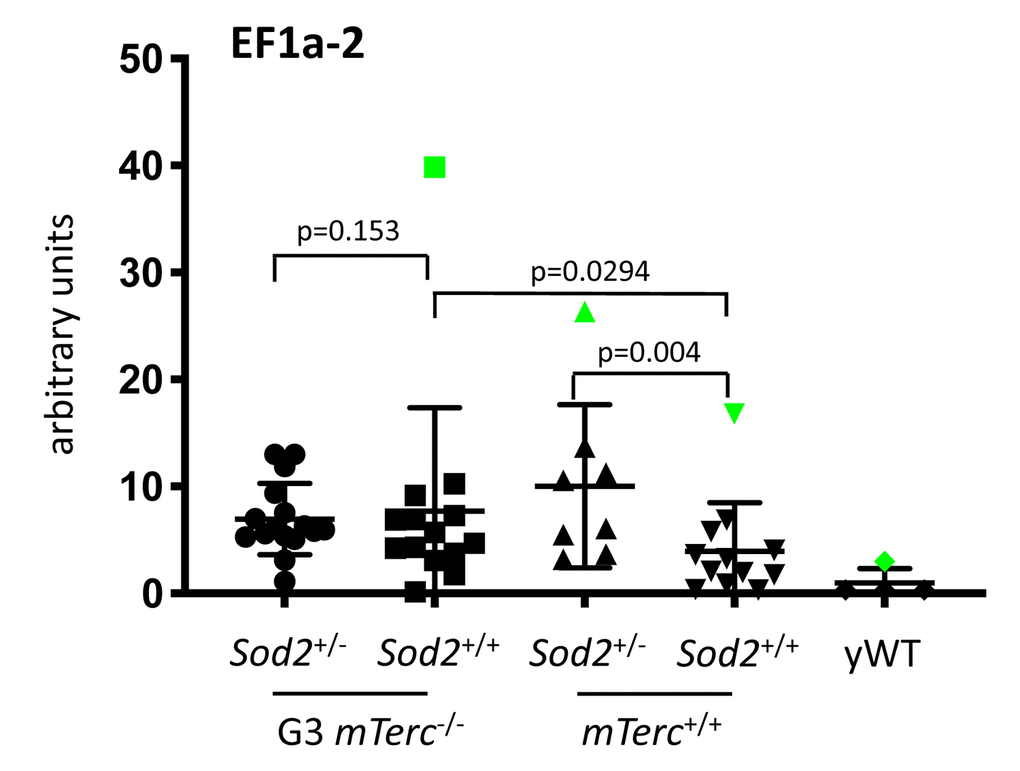
This article has been corrected: The authors requested to replace Supplementary Figure 2C. In Supplementary Figure 2C-E the errors occurred in p-value calculation and n-number depiction. Supplementary Figure 2C contained 4 outliers (Grubb’s test) but only 1 was removed for p-value calculation. The corrected Supplementary Figure 2C is shown below and indicates the outliers in green as well as the corrected p-values. In Supplementary Figure 2E the p-value for the comparison of Sod2+/+, G3mTerc-/- mice versus Sod2+/+, G3mTerc-/-mice should read p=0.12 instead of p=0.77. N-numbers for Supplementary Figure 2C-E were 16-17 for Sod2+/+, G3mTerc-/- mice, 14-16 for Sod2+/+, G3mTerc-/-mice, 7-8 for Sod2+/+, mTerc+/+ mice, 12-14 for Sod2+/+, mTerc+/+ mice, and 4-5 for young wildtype (yWT) mice. Aging markers were determined as previously described (Reference 16 of the manuscript). Statistical analysis was performed using the unpaired t-test with GraphPad Prism software. These corrections do not change any of the conclusions of the publication. The corrected Supplementary Figure 2C is provided below.
Navigate
Online ISSN: 1945-4589