


Introduction
Machado-Joseph disease, also known as spinocerebellar ataxia type 3 (MJD/SCA3), is an autosomal dominant neurodegenerative disorder that is characterized by progressive cerebellar ataxia and pyramidal signs, which can be associated with a complex clinical picture and includes extrapyramidal signs or amyotrophy [1, 2]. MJD is caused by an abnormal CAG trinucleotide repeat expansion in exon 10 of the ataxin-3 gene (ATXN3), located at 14q32.1. Deleterious expansions (CAGexp) consensually contain 61 to 87 CAG repeats, whereas wild type alleles (CAGnor) range from 12 to 44 [2].
As with other diseases caused by repeat expansions, such as Huntington’s disease (HD) and other spinocerebellar ataxias, there is an inverse correlation between expanded repeat size and the age at which pathogenesis leads to disease onset [3]. Depending on the cohort structure, the size of the repeat expansion explains 55 to 70% of the age at onset (AO) variability in MJD, suggesting the existence of additional modifying factors [3, 4]. Although several genetic factors have been proposed as modifiers, such as CAG repeat size of normal ATXN3 (SCA3), HTT (HD), ATXN2 (SCA2) and ATN1 (DRPLA) alleles, APOE status, and expression level of HSP40 [4–6], these were not replicated by subsequent studies [7, 8]. Since CAG tract profile and allelic frequencies of the potential modifier loci can have unique characteristics in different populations, large collaborative studies are required to identify genetic modifiers in MJD, as well as replicate the findings of such studies [8].
Previously, Genetic Modifiers of Huntington’s Disease (GeM-HD) Consortium carried out a GWA approach of HD individuals to reveal genetic modifiers of AO in HD [9, 10]. A total of eleven [9] and fourteen loci [10] were found to be associated with residual age at HD onset. In the present study, we performed the first GWAS to identify some possible genetic modifiers of AO in MJD. First, we assessed the relationship between AO and size of the expanded (CAGexp) and normal (CAGnor) alleles, biological sex and geographical origin. Next, we determined a residual AO for each subject, which is the difference between the measured AO and the predicted/estimated AO from expanded CAG repeat size alone. Using the residuals as a quantitative phenotype for a GWAS, we looked for genetic factors that modulate AO in MJD.
Results
The inverse correlation between CAGexp and age at onset
In the first phase of the study, the expanded ATXN3-CAG repeat lengths of 786 MJD patients were assessed. The mean (SD) CAGexp size were Australia: 68.2 (±3.3), Brazil: 74.3 (3.9), Germany: 72.9 (±3.6), North America: 73 (±4.3) and Portugal: 72 (±4.0). Next, the relationship between AO and CAGexp size, CAGnor size, sex and ethnicity was examined (Supplementary Table 1). The previously observed negative correlation between ATXN3 CAGexp size and AO [3] was confirmed (Pearson’s correlation coefficient R2 = 0.62) (Figure 1). The CAGnor size (P = 0.39), sex (P = 0.02) and geographic origin (P [Brazil] = 0.38, P [Germany] = 0.38, P [North America] = 0.33, P [Portugal] = 0.29) were not significant and their addition had little contribution to the model (ΔR2 = 0.0072). Residual AO for each sample was calculated and used as a quantitative phenotype to identify the modifiers of AO. The distribution of residual AO was close a theoretical normal distribution (Figure 1).
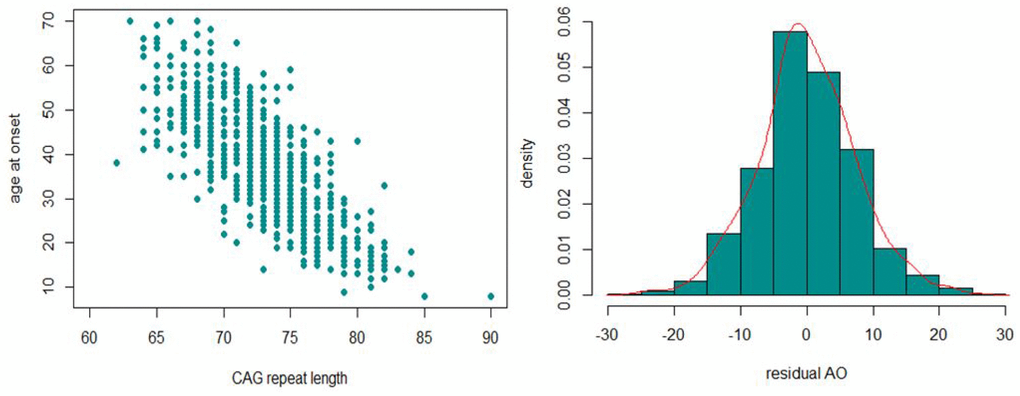
Figure 1. The inverse correlation between CAGexp and AO (left) and the distribution of residual AO (right) observed in our MJD cohort.
Genome-wide association study
After post-imputation quality assessments, a total of 700 individuals with genotyping information for 6,716,580 variants remained for GWAS. The Manhattan plots are shown in Figure 2. The genomic inflation factor was close to one (λ = 0.98), indicating the p-values were not inflated. Genome-wide suggestive associations (P < 1 × 10⁻⁵) with 204 variants across 9 loci were identified (Supplementary Table 3). The most significantly associated SNP at each locus are shown in Table 1. Positional gene mapping aligned SNPs to 17 genes by their genomic location. Fourteen of the 204 variants had a Combined Annotation Dependent Depletion (CADD)-PHRED score higher than the suggested threshold for deleterious SNPs (12.37), arguing the given loci have a functional role [11].
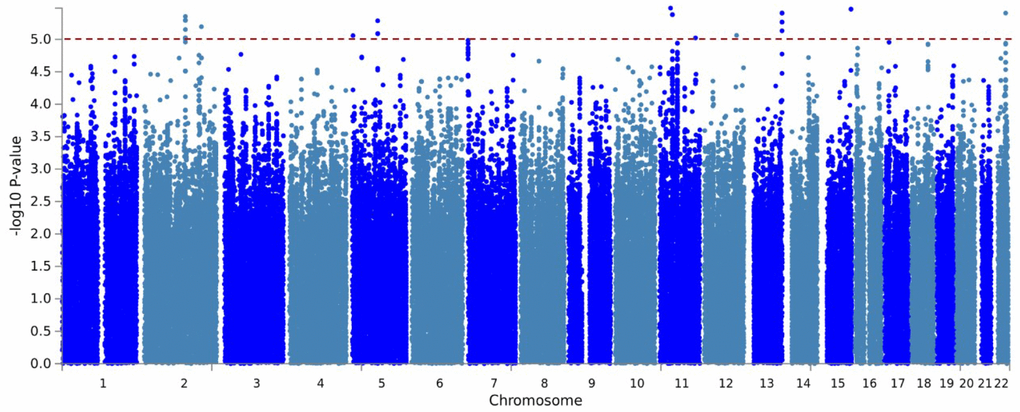
Figure 2. Manhattan plot of the GWAS for residual AO of MJD. Imputed using the HRC panel, 6,716,580 variants that passed QC are included in the plot. The x-axis shows the physical position along the genome. The y-axis shows the −log10(p-value) for association. The red line indicates the level of genome-wide suggestive association (P = 1 × 10⁻⁵).
Table 1. Suggestive loci associated with residual age at onset in MJD. Chr: chromosome, MAF: minor allele frequency, 1KGP: 1000 Genomes Project.
| SNP | Chr | Position (GRCh37) | Nearest gene | Minor allele | Major allele | MJD MAF | 1KGP MAF | b (SNP effect) | P-value |
| rs62171220 | 2 | 137802855 | THSD7B | G | C | 0.13 | 0.11 | 2.71 | 4.45 × 10⁻⁶ |
| rs2067390 | 2 | 191209028 | HIBCH, INPP1 | A | T | 0.04 | 0.06 | 4.74 | 6.39 × 10⁻⁶ |
| rs144891322 | 5 | 85135387 | RPL5P17, | C | T | 0.02 | 0.007 | 6.10 | 5.18 × 10⁻⁶ |
| rs11529293 | 11 | 36855388 | C11orf74, RAG1, RAG2 | T | C | 0.14 | 0.26 | -2.71 | 3.30 × 10⁻⁶ |
| rs7480166 | 11 | 42984753 | HNRNPKP3 | A | G | 0.40 | 0.40 | -1.86 | 4.17 × 10⁻⁶ |
| rs585809 | 11 | 119949979 | TRIM29 | T | C | 0.06 | 0.17 | -3.76 | 9.50 × 10⁻⁶ |
| rs72660056 | 13 | 113507543 | ATP11A | A | G | 0.08 | 0.05 | -3.29 | 3.94 × 10⁻⁶ |
| rs11857349 | 15 | 99924857 | TTC23, SYNM, LRRC28 | G | A | 0.04 | 0.02 | -4.58 | 3.43 × 10⁻⁶ |
| rs8141510 | 22 | 42821185 | NFAM1, CYP2D6, NAGA, NDUFA6 | C | T | 0.43 | 0.49 | 1.83 | 3.94 × 10⁻⁶ |
Interaction analysis between CAGexp, sex and SNP genotype
To assess a possible interaction between CAGexp size and the variants identified, each of the nine variants was added to the initial linear regression, modelling AO as a function of CAGexp size, SNP, sex, the first three principal components, CAGnor size, interactions of SNP:CAGexp and SNP:sex. Association of each independent SNP with AO revealed nominally significant p-values (P [rs7480166] = 8.42 × 10⁻⁶, P [rs62171220] = 6.33 × 10⁻³, P [rs2067390] = 4.51 × 10⁻⁵, P [rs144891322] = 1.14 × 10⁻⁵, P [rs11529293] = 1.62 × 10⁻⁵, P [rs585809] = 2.91 × 10⁻⁵, P [rs72660056] = 1.66 × 10⁻³, P [rs11857349] = 8.21 × 10⁻⁶, P [rs8141510] = 1.33 × 10⁻³). With the addition of the identified variants to the model, correlation coefficient R2 increased to 0.71 (ΔR2 = 0.082). Among the nine variants, only rs585809 (mapped to TRIM29) had a significant interaction with CAGexp (P = 0.01), suggesting that rs585809 might modulate AO through this epistatic interaction on CAGexp. The addition of SNP:sex interaction had little contribution to the model (ΔR2 = 0.005).
Association of HD-AO modifier variants in MJD
Association of previously identified HD-AO modifier loci in MJD were assessed. Among the 25 HD-AO modifier variants in 17 loci, a total of 18 variants (MAF > 0.02) in 12 loci were tested in this study (Supplementary Table 4). None of these HD-AO modifiers reached the genome-wide suggestive threshold. However, two variants rs144287831 (P = 0.02, effect size = - 0.98) and rs1799977 (P = 0.02, effect size = - 0.98) in the MLH1 locus were found to be nominally associated with a later AO in MJD.
Pathway and gene-set enrichment analysis
A gene-set enrichment and pathway analysis was conducted using i-GSEA4GWAS v2 [12]. Various approaches and algorithms are currently in use to conduct similar analyses. To be able to make better comparisons with other studies that may use different approaches, we performed a secondary gene-set enrichment and pathway analysis using the VEGAS2 [13] and PASCAL [14] software (Supplementary Tables 5–7). We also used these results for replication purposes in our own study. A total of 13 overrepresented pathways were found, after FDR-multiple testing correction (q-value < 0.05) in the primary GSEA analysis and replicated using at least one of the secondary gene-set enrichment algorithms (Table 2). Overall, the most significantly enriched gene-sets and pathways were vesicle transport, olfactory signaling, and synaptic pathways. Visualization and clustering of pathways are shown in Figure 3.
Table 2. Pathways significant after multiple-correction (q < 5 x 10⁻²) in the primary GSEA analysis and replicated using at least one of the secondary gene-set enrichment algorithms. NA means that the pathway was not enriched by at least two significant genes in VEGAS.
| Pathway | Description | p-value (GSEA) | q-value (GSEA) | p-value (VEGAS) | permuted p-value (VEGAS) | p-value (PASCAL) |
| GO:0030133 | transport vesicle | < 1.0 x 10⁻³ | 8.20 x 10⁻³ | 6.15 x 10-40 | 4.46 x 10⁻¹ | 6.70 x 10⁻³ |
| KEGG:04740 | olfactory transduction | < 1.0 x 10⁻³ | 8.30 x 10⁻³ | NA | NA | 3.89 x 10⁻⁴ |
| R-HSA:381753 | olfactory signaling pathway | < 1.0 x 10⁻³ | 8.80 x 10⁻³ | 1.10 x 10⁻²⁷ | 7.71 x 10⁻¹ | 2.51 x 10⁻⁴ |
| GO:0044456 | synapse part | < 1.0 x 10⁻³ | 9.30 x 10⁻³ | 1.25 x 10-182 | < 1.0 x 10⁻⁶ | < 1.0 x 10⁻⁷ |
| R-HSA:74217 | purine salvage | < 1.0 x 10⁻³ | 1.06 x 10⁻² | 1.06 x 10⁻² | 2.15 x 10⁻¹ | 6.48 x 10⁻³ |
| GO:0045202 | synapse | < 1.0 x 10⁻³ | 1.15 x 10⁻² | 1.15 x 10⁻² | < 1.0 x 10⁻⁶ | < 1.0 x 10⁻⁷ |
| GO:0004177 | aminopeptidase activity | < 1.0 x 10⁻³ | 1.50 x 10⁻² | 1.50 x 10⁻² | 3.41 x 10⁻¹ | 1.24 x 10⁻² |
| GO:0008238 | exopeptidase activity | < 1.0 x 10⁻³ | 1.80 x 10⁻² | 1.80 x 10⁻² | 2.80 x 10⁻² | 8.31 x 10⁻³ |
| GO:0006898 | receptor mediated endocytosis | < 1.0 x 10⁻³ | 2.25 x 10⁻² | 2.25 x 10⁻² | 2.03 x 10⁻¹ | 6.64 x 10⁻³ |
| GO:0016917 | GABA receptor activity | < 1.0 x 10⁻³ | 2.26 x 10⁻² | 2.26 x 10⁻² | 1.30 x 10⁻⁴ | 2.30 x 10⁻⁵ |
| GO:0030140 | trans Golgi network transport vesicle | < 1.0 x 10⁻³ | 2.36 x 10⁻² | 2.36 x 10⁻² | 2.80 x 10⁻² | 1.28 x 10⁻¹ |
| GO:0009725 | response to hormone stimulus | < 1.0 x 10⁻³ | 2.73 x 10⁻² | 2.73 x 10⁻² | 1.32 x 10⁻¹ | 1.30 x 10⁻⁴ |
| GO:0030425 | Dendrite | < 1.0 x 10⁻³ | 3.86 x 10⁻² | 3.86 x 10⁻² | < 1.0 x 10⁻⁶ | < 1.0 x 10⁻⁷ |
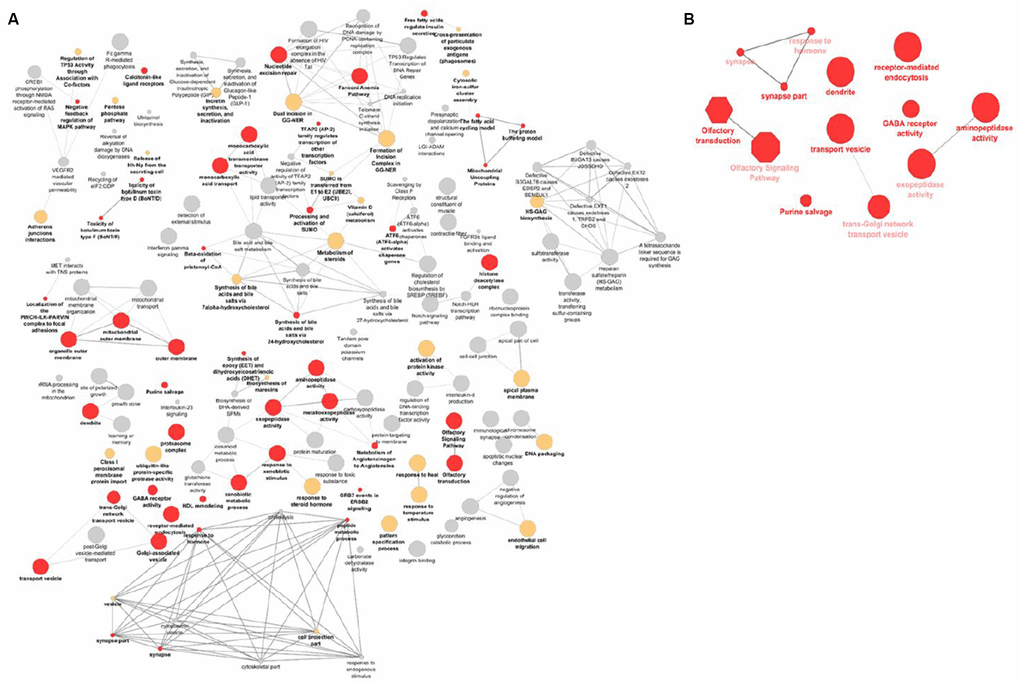
Figure 3. Visualization of the gene-sets and pathways enriched in primary GSEA analysis (A) and replicated in VEGAS and PASCAL (B). The size of the nodes corresponds to the number of the genes associated with a term. The significance is represented by the color of the nodes (P < 0.05, 0.05 < P < 0.1 and P > 0.1 are represented by red, yellow and gray, respectively).
Discussion
Using five cohorts from different geographical origins, we performed the first GWAS to examine the presence of genetic factors that could modify AO in MJD. We identified a total of nine loci that were potentially associated with either an earlier or later AO. Concomitantly, we confirmed the previously observed negative correlation between CAGexp and AO [3]. It was shown previously that normal ATXN3 allele (CAGnor) had a significant influence on AO of MJD [15]; however, several studies did not replicate this effect [6, 8]. Indeed, we did not observe an association between CAGnor and AO. However, it had little contribution to our model, with a minor difference in the correlation coefficient (ΔR2 = 0.0012).
In our GWAS, the strongest signal is for the rs11529293 variant (P = 3.30 × 10⁻⁶) within the C11orf72 and RAG loci at 11p12. Within this locus, two RAG genes, recombination-activating genes RAG1 and RAG2, were shown to be implicated in DNA damage response and DNA repair machineries [16, 17]. The rs585809 variant, which was mapped to the TRIM29 gene, was found to interact with CAGexp, suggesting that it might have an effect on AO through this interaction. Both RAG and TRIM29 loci were identified as AO-hastening modifiers. TRIM29 encodes for tripartite motif protein 29, which is implicated in mismatch repair and double strand breaks pathways [18, 19]. TRIM29 is involved both upstream and downstream of these pathways, in the regulation of DNA repair proteins into chromatin by mediating the interaction between them. One of these DNA repair proteins is MLH1, which is implicated in mismatch repair complex [19]. Previously, the MLH1 locus was identified as an AO modifier in another neurodegenerative disease caused by CAG repeat expansion, Huntington’s disease [9, 10, 20]. Additionally, in a genome-wide genetic screening study, MLH1-knock out was shown to modify the somatic expansion of the CAG repeat and slow the pathogenic process in HD mouse model [21]. Overall, the association of TRIM29 and RAG loci suggests that DNA repair mechanisms may be implicated in the alteration of AO of MJD, as well as HD, and may have a role in the pathogenesis of other CAG repeat diseases. Interestingly, in a previous study, we found variants in three transcription-coupled repair genes (ERCC6, RPA, and CDK7) associated with different CAG instability patterns in MJD [22].
We identified gene-sets enriched in olfactory signaling, vesicle transport, and synaptic pathways. Olfactory dysfunction is one of the main non-motor symptoms that was already described in patients with MJD [23, 24]. In a previous study, transplantation of olfactory ensheathing cells, which are specialized glial cells of the primary olfactory system, were found to improve motor function in an MJD mice model, and were suggested as a novel potential strategy for MJD treatment [25]. Vesicle transport and synaptic pathways were also implicated in MJD, as well as in other neurodegenerative diseases [26, 27]. An interruption of synaptic transmission caused by an expanded polyglutamine repeat and mutant ataxin-3 aggregates were shown in Drosophila and Caenorhabditis elegans models of MJD. Therefore, the interaction between synaptic vesicles and mutant aggregates supports the role of synaptic vesicle transport in the pathogenesis of MJD [28, 29]. Overall, we suggest that these gene-sets and pathways might construct a larger molecular network that could modulate the AO in MJD.
In summary, our study identified nine genetic loci that may modify the AO of MJD. Identification of TRIM29 and RAG genetic variants, as well as our gene-set enrichment analyses, implicated DNA repair, olfactory signaling, synaptic, and vesicle transport pathways in the pathogenesis of MJD. Although we used different cohorts from five distinct geographical ethnicities, a replication study in similar or additional populations would add valuable evidence to support our findings.
Materials and Methods
Study subjects
A total of 786 MJD patients from five distinct geographical origins (Portugal, Brazil, North America, Germany and Australia) were included in the present study. The overall average age at onset (standard deviation) was 38 (± 1.82) years, with a 1:1 male to female ratio. All subjects provided informed consent, and the study was approved by the respective institutional review boards. Detailed cohort demographics are shown in Supplementary Table 2.
Assessment of the ATXN3 CAG repeat length
A singleplex polymerase chain reaction was performed to determine the length of the CAGexp and CAGnor alleles at exon 10 of ATXN3 [30]. The final volume for each assay was 10 μL: 7.5 ng of gDNA, 0.2 μM of each primer, 5 μL of Taq PCR Master Mix Kit Qiagen®, 1 μL of Q-Solution from Qiagen® and H2O. Fragment length analysis was done using ABIPrism 3730xl sequencer (Applied Biosystems®, McGill University and Genome Québec Innovation Centre) and GeneMapper software [31]. A stepwise regression model was performed to assess the correlation between AO and CAGexp size, as well as gender, origin, CAGnor size, and interaction between these variables. Residual AO was calculated for each subject by subtracting individual’s expected AO based upon CAGexp size from actual AO, to be used as the primary phenotype for following genetic approach.
Genotyping, quality control and imputation
Samples were genotyped using the Global Screening Array v.1.0 from Illumina (636,139 markers). Sample-based (missingness, relatedness, sex, and multidimensional scaling analysis) and SNP-based quality assessments (missingness, Hardy-Weinberg equilibrium, and minor allele frequency) were conducted using PLINK version 1.9 [32]. In sample level QC, samples were excluded with one or more of the following: high missingness (missingness rate > 0.05), close relationship (pi-hat value > 0.2), discrepancy between genetically-inferred sex and reported sex, population outliers (deviation ≥ 4 SD from the population mean in multidimensional scaling analysis). All SNPs were checked for marker genotyping call rate (> 98%), minor allele frequency (MAF) > 0.05, and HWE (p-value threshold = 1.0 × 10⁻⁵).
Phasing and imputation were performed using SHAPEIT [33] and PBWT [34] pipelines, implemented on the Sanger Imputation Service [35]. Haplotype Reference Consortium (HRC) reference panel r1.1 containing 64,940 human haplotypes at 40,405,505 genetic markers were used as the reference panel. Imputed variants with an allele count of 30 (MAF > 0.02), an imputation quality score above 0.3 and an HWE p-value of > 1.0 × 10⁻⁵ were included for subsequent analysis.
Genome-wide association analysis
A genome-wide linear mixed model based association analysis was conducted using –mlma-loco option of GCTA version 1.91.7 [36]. Residual AO was modelled as a function of minor allele count of the test SNP, sex, and the first three principal components based on the scree plot (Supplementary Figure 1). Manhattan plots were generated in FUMA v.1.3.4 [37]. Regional association plots were generated using LocusZoom [38] (Supplementary Figure 2).
Functional annotation of SNPs
Genomic risk loci were defined using SNP2GENE function implemented in FUMA. Independent suggestive SNPs (P < 1 × 10⁻⁵) with a threshold of r2 < 0.6 were selected within a 250 kb window. The UK Biobank release 2 European population consisting of randomly selected 10,000 subjects was used as the reference population panel. The ANNOVAR [39] categories and combined annotation-dependent depletion (CADD) [40] scores were obtained from FUMA for functional annotation. Functionally annotated variants were mapped to genes based on genomic position using FUMA positional mapping tool.
Pathway analysis
To identify known biological pathways and gene sets at the associated loci, an enrichment approach was applied using public datasets containing Gene Ontology (GO, http://geneontology.org), the Kyoto Encyclopaedia of Genes and Genomes (KEGG, https://www.genome.jp/kegg) and Reactome (https://reactome.org) pathways. The primary enrichment analysis was performed using the i-GSEA4GWAS v2. It uses a candidate list of a genome-wide set of genes mapped within the SNP loci and ranks them based on the strength of their association with the phenotype. Genes were mapped within 20 kb up or downstream of the SNPs with a P < 0.05. Gene and pathway sets meeting a false discovery rate (FDR)-corrected q-value < 0.05 were regarded as significantly associated with high confidence, and q-value < 0.25 was regarded to be possibly associated with the phenotype of interest. We performed a secondary gene-based association test using the Versatile Gene-based Association Study (VEGAS) algorithm that controls the number of SNPs in each gene and the linkage disequilibrium (LD) between these SNPs using the HapMap European population. As a third algorithm to identify enriched pathways, we used Pathway Scoring Algorithm (PASCAL), which controls for potential bias from gene size, SNP density, as well as LD. ClueGO [41] and CluePedia [42] plug-ins in Cytoscape were employed to visualize identified pathways and their clustering.
Supplementary Materials
Acknowledgments
The authors thank the participants for their contribution to the study. The authors would like to thank Jay P. Ross, Faezeh Sarayloo, Zoe Schmilovich and S. Can Akerman for their assistance in reviewing the manuscript and scientific content.
Conflicts of Interest
The authors declare no conflicts of interest.
Funding
FA and CL were funded by the Fonds de Recherche du Québec–Santé. SM is funded by FCT (CEECIND/00684/2017) and by NORTE-01-0145-FEDER-000008, supported by Norte Portugal Regional Programme (NORTE 2020), under the PORTUGAL 2020 Partnership Agreement, through the European Regional Development Fund (ERDF). FM and LI are funded by Fundaçao de Amparo a Pesquisa do Estado de São Paulo (FAPESP, 2013/07559-3). MLSP and LBJ were funded by Conselho Nacional de Desenvolvimento Científico e Tecnológico, Brazil (CNPq) and by Coordenação de Aperfeiçoamento de Pessoal de Nível Superior (CAPES). GAR holds a Canada Research Chair in Genetics of the Nervous System and the Wilder Penfield Chair in Neurosciences.
References
- 1. Twist EC, Casaubon LK, Ruttledge MH, Rao VS, Macleod PM, Radvany J, Zhao Z, Rosenberg RN, Farrer LA, Rouleau GA. Machado Joseph disease maps to the same region of chromosome 14 as the spinocerebellar ataxia type 3 locus. J Med Genet. 1995; 32:25–31. https://doi.org/10.1136/jmg.32.1.25 [PubMed]
- 2. Bettencourt C, Lima M. Machado-Joseph Disease: from first descriptions to new perspectives. Orphanet J Rare Dis. 2011; 6:35. https://doi.org/10.1186/1750-1172-6-35 [PubMed]
- 3. Maciel P, Gaspar C, DeStefano AL, Silveira I, Coutinho P, Radvany J, Dawson DM, Sudarsky L, Guimarães J, Loureiro JE, et al. Correlation between CAG repeat length and clinical features in Machado-Joseph disease. Am J Hum Genet. 1995; 57:54–61. [PubMed]
- 4. de Mattos EP, Kolbe Musskopf M, Bielefeldt Leotti V, Saraiva-Pereira ML, Jardim LB. Genetic risk factors for modulation of age at onset in Machado-Joseph disease/spinocerebellar ataxia type 3: a systematic review and meta-analysis. J Neurol Neurosurg Psychiatry. 2019; 90:203–10. https://doi.org/10.1136/jnnp-2018-319200 [PubMed]
- 5. Zijlstra MP, Rujano MA, Van Waarde MA, Vis E, Brunt ER, Kampinga HH. Levels of DNAJB family members (HSP40) correlate with disease onset in patients with spinocerebellar ataxia type 3. Eur J Neurosci. 2010; 32:760–70. https://doi.org/10.1111/j.1460-9568.2010.07352.x [PubMed]
- 6. Tezenas du Montcel S, Durr A, Bauer P, Figueroa KP, Ichikawa Y, Brussino A, Forlani S, Rakowicz M, Schöls L, Mariotti C, van de Warrenburg BP, Orsi L, Giunti P, et al, and Clinical Research Consortium for Spinocerebellar Ataxia (CRC-SCA), and EUROSCA network. Modulation of the age at onset in spinocerebellar ataxia by CAG tracts in various genes. Brain. 2014; 137:2444–55. https://doi.org/10.1093/brain/awu174 [PubMed]
- 7. Chen Z, Zheng C, Long Z, Cao L, Li X, Shang H, Yin X, Zhang B, Liu J, Ding D, Peng Y, Wang C, Peng H, et al, and Chinese Clinical Research Cooperative Group for Spinocerebellar Ataxias (CCRCG-SCA). (CAG)n loci as genetic modifiers of age-at-onset in patients with Machado-Joseph disease from mainland China. Brain. 2016; 139:e41–41. https://doi.org/10.1093/brain/aww087 [PubMed]
- 8. Raposo M, Ramos A, Bettencourt C, Lima M. Replicating studies of genetic modifiers in spinocerebellar ataxia type 3: can homogeneous cohorts aid? Brain. 2015; 138:e398–398. https://doi.org/10.1093/brain/awv206 [PubMed]
- 9. Lee JM, Wheeler VC, Chao MJ, Vonsattel JP, Pinto RM, Lucente D, Abu-Elneel K, Ramos EM, Mysore JS, Gillis T, MacDonald ME, Gusella JF, Harold D, et al, and Genetic Modifiers of Huntington’s Disease (GeM-HD) Consortium. Identification of Genetic Factors that Modify Clinical Onset of Huntington’s Disease. Cell. 2015; 162:516–26. https://doi.org/10.1016/j.cell.2015.07.003 [PubMed]
- 10. Lee JM, Correia K, Loupe J, Kim KH, Barker D, Hong EP, Chao MJ, Long JD, Lucente D, Vonsattel JP, Pinto RM, Abu Elneel K, Ramos EM, et al, and Genetic Modifiers of Huntington’s Disease (GeM-HD) Consortium. Electronic address: [email protected], and Genetic Modifiers of Huntington’s Disease (GeM-HD) Consortium. CAG Repeat Not Polyglutamine Length Determines Timing of Huntington’s Disease Onset. Cell. 2019; 178:887–900.e14. https://doi.org/10.1016/j.cell.2019.06.036 [PubMed]
- 11. Amendola LM, Dorschner MO, Robertson PD, Salama JS, Hart R, Shirts BH, Murray ML, Tokita MJ, Gallego CJ, Kim DS, Bennett JT, Crosslin DR, Ranchalis J, et al. Actionable exomic incidental findings in 6503 participants: challenges of variant classification. Genome Res. 2015; 25:305–15. https://doi.org/10.1101/gr.183483.114 [PubMed]
- 12. Zhang K, Cui S, Chang S, Zhang L, Wang J. i-GSEA4GWAS: a web server for identification of pathways/gene sets associated with traits by applying an improved gene set enrichment analysis to genome-wide association study. Nucleic Acids Res. 2010; 38:W90–5. https://doi.org/10.1093/nar/gkq324 [PubMed]
- 13. Mishra A, Macgregor S. VEGAS2: Software for More Flexible Gene-Based Testing. Twin Res Hum Genet. 2015; 18:86–91. https://doi.org/10.1017/thg.2014.79 [PubMed]
- 14. Lamparter D, Marbach D, Rueedi R, Kutalik Z, Bergmann S. Fast and Rigorous Computation of Gene and Pathway Scores from SNP-Based Summary Statistics. PLoS Comput Biol. 2016; 12:e1004714. https://doi.org/10.1371/journal.pcbi.1004714 [PubMed]
- 15. França MC
Jr , Emmel VE, D’Abreu A, Maurer-Morelli CV, Secolin R, Bonadia LC, da Silva MS, Nucci A, Jardim LB, Saraiva-Pereira ML, Marques WJr , Paulson H, Lopes-Cendes I. Normal ATXN3 Allele but Not CHIP Polymorphisms Modulates Age at Onset in Machado-Joseph Disease. Front Neurol. 2012; 3:164. https://doi.org/10.3389/fneur.2012.00164 [PubMed] - 16. Lescale C, Deriano L. The RAG recombinase: beyond breaking. Mech Ageing Dev. 2017; 165:3–9. https://doi.org/10.1016/j.mad.2016.11.003 [PubMed]
- 17. Bahjat M, Guikema JE. The Complex Interplay between DNA Injury and Repair in Enzymatically Induced Mutagenesis and DNA Damage in B Lymphocytes. Int J Mol Sci. 2017; 18:18. https://doi.org/10.3390/ijms18091876 [PubMed]
- 18. Wikiniyadhanee R, Lerksuthirat T, Stitchantrakul W, Chitphuk S, Dejsuphong D. AB064. TRIM29: a novel gene involved in DNA repair mechanisms. Ann Transl Med. 2017; 5:AB064–064. https://doi.org/10.21037/atm.2017.s064
- 19. Masuda Y, Takahashi H, Sato S, Tomomori-Sato C, Saraf A, Washburn MP, Florens L, Conaway RC, Conaway JW, Hatakeyama S. TRIM29 regulates the assembly of DNA repair proteins into damaged chromatin. Nat Commun. 2015; 6:7299. https://doi.org/10.1038/ncomms8299 [PubMed]
- 20. Lee JM, Chao MJ, Harold D, Abu Elneel K, Gillis T, Holmans P, Jones L, Orth M, Myers RH, Kwak S, Wheeler VC, MacDonald ME, Gusella JF. A modifier of Huntington’s disease onset at the MLH1 locus. Hum Mol Genet. 2017; 26:3859–67. https://doi.org/10.1093/hmg/ddx286 [PubMed]
- 21. Pinto RM, Dragileva E, Kirby A, Lloret A, Lopez E, St Claire J, Panigrahi GB, Hou C, Holloway K, Gillis T, Guide JR, Cohen PE, Li GM, et al. Mismatch repair genes Mlh1 and Mlh3 modify CAG instability in Huntington’s disease mice: genome-wide and candidate approaches. PLoS Genet. 2013; 9:e1003930. https://doi.org/10.1371/journal.pgen.1003930 [PubMed]
- 22. Martins S, Pearson CE, Coutinho P, Provost S, Amorim A, Dubé MP, Sequeiros J, Rouleau GA. Modifiers of (CAG)(n) instability in Machado-Joseph disease (MJD/SCA3) transmissions: an association study with DNA replication, repair and recombination genes. Hum Genet. 2014; 133:1311–18. https://doi.org/10.1007/s00439-014-1467-8 [PubMed]
- 23. Braga-Neto P, Felicio AC, Pedroso JL, Dutra LA, Bertolucci PH, Gabbai AA, Barsottini OG. Clinical correlates of olfactory dysfunction in spinocerebellar ataxia type 3. Parkinsonism Relat Disord. 2011; 17:353–56. https://doi.org/10.1016/j.parkreldis.2011.02.004 [PubMed]
- 24. Pedroso JL, França MC
Jr , Braga-Neto P, D’Abreu A, Saraiva-Pereira ML, Saute JA, Teive HA, Caramelli P, Jardim LB, Lopes-Cendes I, Barsottini OG. Nonmotor and extracerebellar features in Machado-Joseph disease: a review. Mov Disord. 2013; 28:1200–08. https://doi.org/10.1002/mds.25513 [PubMed] - 25. Hsieh J, Liu JW, Harn HJ, Hsueh KW, Rajamani K, Deng YC, Chia CM, Shyu WC, Lin SZ, Chiou TW. Human Olfactory Ensheathing Cell Transplantation Improves Motor Function in a Mouse Model of Type 3 Spinocerebellar Ataxia. Cell Transplant. 2017; 26:1611–21. https://doi.org/10.1177/0963689717732578 [PubMed]
- 26. Wiatr K, Piasecki P, Marczak Ł, Wojciechowski P, Kurkowiak M, Płoski R, Rydzanicz M, Handschuh L, Jungverdorben J, Brüstle O, Figlerowicz M, Figiel M. Altered Levels of Proteins and Phosphoproteins, in the Absence of Early Causative Transcriptional Changes, Shape the Molecular Pathogenesis in the Brain of Young Presymptomatic Ki91 SCA3/MJD Mouse. Mol Neurobiol. 2019; 56:8168–202. https://doi.org/10.1007/s12035-019-01643-4 [PubMed]
- 27. Gissen P, Maher ER. Cargos and genes: insights into vesicular transport from inherited human disease. J Med Genet. 2007; 44:545–55. https://doi.org/10.1136/jmg.2007.050294 [PubMed]
- 28. Gunawardena S, Goldstein LS. Polyglutamine diseases and transport problems: deadly traffic jams on neuronal highways. Arch Neurol. 2005; 62:46–51. https://doi.org/10.1001/archneur.62.1.46 [PubMed]
- 29. Khan LA, Bauer PO, Miyazaki H, Lindenberg KS, Landwehrmeyer BG, Nukina N. Expanded polyglutamines impair synaptic transmission and ubiquitin-proteasome system in Caenorhabditis elegans. J Neurochem. 2006; 98:576–87. https://doi.org/10.1111/j.1471-4159.2006.03895.x [PubMed]
- 30. Martins S, Calafell F, Wong VC, Sequeiros J, Amorim A. A multistep mutation mechanism drives the evolution of the CAG repeat at MJD/SCA3 locus. Eur J Hum Genet. 2006; 14:932–40. https://doi.org/10.1038/sj.ejhg.5201643 [PubMed]
- 31. Chatterji S, Pachter L. Reference based annotation with GeneMapper. Genome Biol. 2006; 7:R29–29. https://doi.org/10.1186/gb-2006-7-4-r29 [PubMed]
- 32. Chang CC, Chow CC, Tellier LC, Vattikuti S, Purcell SM, Lee JJ. Second-generation PLINK: rising to the challenge of larger and richer datasets. Gigascience. 2015; 4:7. https://doi.org/10.1186/s13742-015-0047-8 [PubMed]
- 33. Delaneau O, Marchini J, Zagury JF. A linear complexity phasing method for thousands of genomes. Nat Methods. 2011; 9:179–81. https://doi.org/10.1038/nmeth.1785 [PubMed]
- 34. Durbin R. Efficient haplotype matching and storage using the positional Burrows-Wheeler transform (PBWT). Bioinformatics. 2014; 30:1266–72. https://doi.org/10.1093/bioinformatics/btu014 [PubMed]
- 35. McCarthy S, Das S, Kretzschmar W, Delaneau O, Wood AR, Teumer A, Kang HM, Fuchsberger C, Danecek P, Sharp K, Luo Y, Sidore C, Kwong A, et al, and Haplotype Reference Consortium. A reference panel of 64,976 haplotypes for genotype imputation. Nat Genet. 2016; 48:1279–83. https://doi.org/10.1038/ng.3643 [PubMed]
- 36. Yang J, Lee SH, Goddard ME, Visscher PM. GCTA: a tool for genome-wide complex trait analysis. Am J Hum Genet. 2011; 88:76–82. https://doi.org/10.1016/j.ajhg.2010.11.011 [PubMed]
- 37. Watanabe K, Taskesen E, van Bochoven A, Posthuma D. Functional mapping and annotation of genetic associations with FUMA. Nat Commun. 2017; 8:1826. https://doi.org/10.1038/s41467-017-01261-5 [PubMed]
- 38. Pruim RJ, Welch RP, Sanna S, Teslovich TM, Chines PS, Gliedt TP, Boehnke M, Abecasis GR, Willer CJ. LocusZoom: regional visualization of genome-wide association scan results. Bioinformatics. 2010; 26:2336–37. https://doi.org/10.1093/bioinformatics/btq419 [PubMed]
- 39. Wang K, Li M, Hakonarson H. ANNOVAR: functional annotation of genetic variants from high-throughput sequencing data. Nucleic Acids Res. 2010; 38:e164. https://doi.org/10.1093/nar/gkq603 [PubMed]
- 40. Rentzsch P, Witten D, Cooper GM, Shendure J, Kircher M. CADD: predicting the deleteriousness of variants throughout the human genome. Nucleic Acids Res. 2019; 47:D886–94. https://doi.org/10.1093/nar/gky1016 [PubMed]
- 41. Bindea G, Mlecnik B, Hackl H, Charoentong P, Tosolini M, Kirilovsky A, Fridman WH, Pagès F, Trajanoski Z, Galon J. ClueGO: a Cytoscape plug-in to decipher functionally grouped gene ontology and pathway annotation networks. Bioinformatics. 2009; 25:1091–93. https://doi.org/10.1093/bioinformatics/btp101 [PubMed]
- 42. Bindea G, Galon J, Mlecnik B. CluePedia Cytoscape plugin: pathway insights using integrated experimental and in silico data. Bioinformatics. 2013; 29:661–63. https://doi.org/10.1093/bioinformatics/btt019 [PubMed]