


Introduction
The increase in adults 65 years and older over the coming decades foretells historically high numbers of disease and disability in economically developed societies [1–4]. Consequently, there will be elevated demands for healthcare services and caregivers support [5]. To limit the financial and societal burdens associated with the growth of the elderly population, strategies geared at promoting healthy aging (i.e., preserving health/functioning into older adulthood) are of high priority [6, 7].
Modifiable health behaviors such as physical activity (PA) offer a potentially effective approach. Insufficient PA is one of the leading causes of morbidity and mortality in the United States [8]. Additionally, PA influences disease burden through its cardiometabolic effects on adiposity [9, 10], high blood pressure [11, 12], and diabetes [13]. Epidemiologic studies also suggest that PA may promote the maintenance of physical [14–17] and cognitive function [18] into older age.
While evidence points to the beneficial roles of PA in promoting health and functioning across the adult life course, there has been a scarcity of longitudinal data suitable to track PA from mid-life to older adulthood [19–21] – particularly in U.S. subpopulations. Such limited knowledge of PA behavior constrains understanding of potentially critical age-associated changes in PA among adults transitioning to late-life. With repeated assessment of leisure-time PA (LTPA) in African American and white women and men spanning over multiple decades, data from four U.S. community-based cohorts of the Atherosclerosis Risk in Communities (ARIC) Study [22] provide a valuable opportunity to characterize temporal patterns in PA from mid-life to older adulthood across subpopulations.
Given the high attrition rates common to cohorts with extended follow-up, a joint modeling approach was implemented to test and account for potential informative censoring in missing PA data due to dropout or death. Accommodating informative attrition, longitudinal trajectories of the average weekly LTPA intensity (in metabolic equivalent of task (MET)), duration (in hours), and volume (i.e., intensity x duration = energy in MET-h) [23] are described over the life epoch from age 45 to 90 years among white women, white men, African American women, and African American men.
Results
Table 1 displays demographic, cardiometabolic, and LTPA characteristics at baseline for the initial total (N = 15,036) cohort sample of 5,816 white women, 5,249 white men, 2,450 African American women, and 1,521 African American men. Baseline variables are also presented according to cohort retention represented by how many times LTPA was recorded in ARIC, including at baseline. Cohort retention, interpreted as the number of visits attended over follow-up (median=23 years), is inversely related to age, female sex, being African American, educational attainment, in addition to characteristics at mid-life including cigarette smoking as well as the presence of hypertension, obesity, and/or diabetes. Considered at mid-life, engagement (yes/no) in LTPA, duration (in h) of average weekly LTPA, and intensity (in MET) of this average weekly LTPA regimen were each associated with cohort retention, as represented by the number of times LTPA was recorded: 1 (just at baseline), 2 (at baseline and at either visit 3 or visit 5), or 3 (at baseline, at visit 3, and at visit 5). African American men experienced the highest rate of attrition due to dropout or death (71%), followed by African American women (64%), white men (62%), and white women (56%).
Table 1. Baseline characteristics of ARIC Study participants (aged 45-64 at cohort intake) and according to cohort retention as quantified by the number of non-missing LTPA measurements over follow-up including baseline (i.e., 3, 2, or 1).
| # of non-missing LTPA measurements | |||||||||||||||||||||||||||||||||||||||||||||||||||||||||||||||||||||||||||||||||||||||||||||||||||
| Baseline | 3 | 2 | 1 | ||||||||||||||||||||||||||||||||||||||||||||||||||||||||||||||||||||||||||||||||||||||||||||||||
| Socio-demographic variables Age, years mean (SD) | 54 (6) | 52 (5) | 55 (6) | 55 (6) | |||||||||||||||||||||||||||||||||||||||||||||||||||||||||||||||||||||||||||||||||||||||||||||||
| Female n (%) | 8266 (55) | 2911 (58) | 3911 (54) | 1444 (52) | |||||||||||||||||||||||||||||||||||||||||||||||||||||||||||||||||||||||||||||||||||||||||||||||
| African American n (%) | 3971 (26) | 1005 (20) | 1791 (25) | 1175 (43) | |||||||||||||||||||||||||||||||||||||||||||||||||||||||||||||||||||||||||||||||||||||||||||||||
| <High school education n (%) | 3560 (24) | 644 (13) | 1827 (25) | 1089 (39) | |||||||||||||||||||||||||||||||||||||||||||||||||||||||||||||||||||||||||||||||||||||||||||||||
| Not married n (%) | 2849 (20) | 866 (18) | 1372 (19) | 611 (23) | |||||||||||||||||||||||||||||||||||||||||||||||||||||||||||||||||||||||||||||||||||||||||||||||
| Behavioral-metabolic factors Current cigarette smoking n (%) | 3965 (26) | 867 (17) | 1991 (27) | 1107 (40) | |||||||||||||||||||||||||||||||||||||||||||||||||||||||||||||||||||||||||||||||||||||||||||||||
| Obesity (BMI ≥30 kg/m2) n (%) | 4161 (28) | 1143 (23) | 2133 (29) | 885 (32) | |||||||||||||||||||||||||||||||||||||||||||||||||||||||||||||||||||||||||||||||||||||||||||||||
| Hypertension* n (%) | 4300 (29) | 1402 (28) | 1987 (27) | 911 (33) | |||||||||||||||||||||||||||||||||||||||||||||||||||||||||||||||||||||||||||||||||||||||||||||||
| Diabetes† n (%) | 1511 (10) | 193 (4) | 813 (11) | 505 (18) | |||||||||||||||||||||||||||||||||||||||||||||||||||||||||||||||||||||||||||||||||||||||||||||||
| LTPA | |||||||||||||||||||||||||||||||||||||||||||||||||||||||||||||||||||||||||||||||||||||||||||||||||||
| Average weekly volume°, MET-h median (Q1, Q3) | 6 (0,16) | 8 (0,18) | 6 (0,16) | 1 (0,13) | |||||||||||||||||||||||||||||||||||||||||||||||||||||||||||||||||||||||||||||||||||||||||||||||
| Average weekly intensity, MET median (Q1, Q3) | 3.5 (1,4.3) | 3.8 (1,4.5) | 3.5 (1,4.3) | 2.9 (1,4.1) | |||||||||||||||||||||||||||||||||||||||||||||||||||||||||||||||||||||||||||||||||||||||||||||||
| Average weekly duration, h median (Q1, Q3) | 1.4 (0,4.0) | 1.8 (0,4.1) | 1.4 (0,4.0) | 0.2 (0,3.2) | |||||||||||||||||||||||||||||||||||||||||||||||||||||||||||||||||||||||||||||||||||||||||||||||
| No LTPA reported n (%) | 5627 (37) | 1602 (32) | 2684 (37) | 1341 (49) | |||||||||||||||||||||||||||||||||||||||||||||||||||||||||||||||||||||||||||||||||||||||||||||||
| Assessment of LTPA occurred at baseline (1987-1989), visit 3 (1993-1995), and visit 5 (2011-2013). | |||||||||||||||||||||||||||||||||||||||||||||||||||||||||||||||||||||||||||||||||||||||||||||||||||
| *Hypertension prevalent if systolic >140 mmHg, diastolic >90 mmHg, or antihypertensive medications reported. | |||||||||||||||||||||||||||||||||||||||||||||||||||||||||||||||||||||||||||||||||||||||||||||||||||
| †Diabetes prevalent if fasting glucose ≥126 mg/dL, non-fasting glucose ≥200 mg/dL, meds, or diagnosis reported. | |||||||||||||||||||||||||||||||||||||||||||||||||||||||||||||||||||||||||||||||||||||||||||||||||||
| °Note: median(volume) ≠ median(intensity) * median(duration), as the measured LTPA values appearing in these. | |||||||||||||||||||||||||||||||||||||||||||||||||||||||||||||||||||||||||||||||||||||||||||||||||||
| data make up a finite set of elements and are thus not closed under scalar multiplication. | |||||||||||||||||||||||||||||||||||||||||||||||||||||||||||||||||||||||||||||||||||||||||||||||||||
Trajectories of LTPA over the adult life course
Depicted in Figure 1 are the longitudinal trajectories (along with 95% Confidence Interval (CI) estimates) of average weekly LTPA volume (in MET-h), intensity (in MET), and duration (in h) over the life epoch from age 45 to 90 years as fit using joint models and their corresponding mixed sub-models, by race and sex subgroups. As illustrated by the divergence in trajectories of joint model estimates under those of their originating mixed sub-models over the aging period and confirmed quantitatively through statistically significant (P <.05), negative-signed estimates in each joint model output for α, representing the strength of the association between the longitudinal marker (LTPA intensity, duration, volume) and the risk of the event (i.e., right-censoring/missingness), reporting of valid LTPA trajectories necessitated accommodation of an established non-ignorable level of missingness not at random (MNAR) in these data through application of joint modeling. The trajectories of LTPA produced by joint models accounting for informative censoring bias are described over ~5-year age intervals from age 45 to 90 in Table 2. These graphic and tabulated estimates indicate the change in LTPA volume, intensity, and duration across the adult life course among four major U.S. subpopulations.
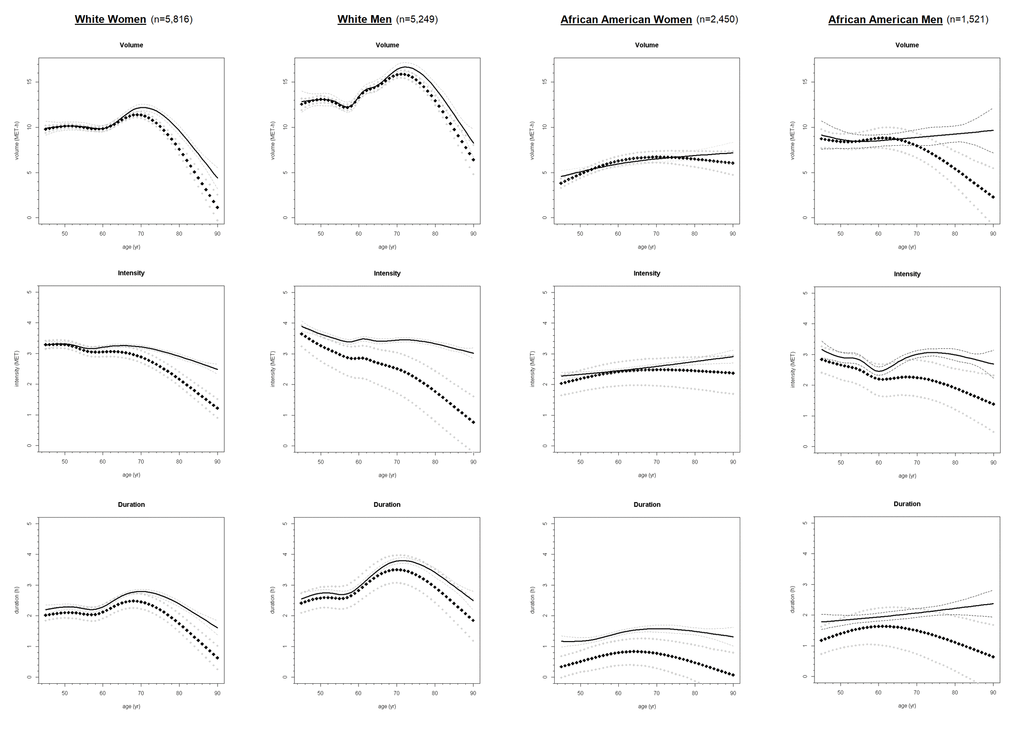
Figure 1. Longitudinal trajectories of average weekly LTPA volume, intensity, and duration from age 45 to 90 in ARIC Study participants (N = 15,036) from joint models* (diamond symbol) and corresponding mixed models† (solid fill), by race and sex. * Trajectories accounting for informative censoring generated through Markov chain Monte-Carlo simulation. † Trajectories fit using only available data (whilst attrition assumed ignorable) via maximum likelihood estimation.
Table 2. Longitudinal estimate with (lower, upper) 95% confidence bounds for average weekly LTPA volume, intensity, and duration from joint models derived* over ~5-yr intervals from age 45 to 90 in ARIC Study participants (N = 15,036), by race and sex.
| Age interval | |||||||||||||||||||||||||||||||||||||||||||||||||||||||||||||||||||||||||||||||||||||||||||||||||||
| 45-49 yr | 50-54 yr | 55-59 yr | 60-64 yr | 65-69 yr | 70-74 yr | 75-79 yr | 80-84 yr | 85-90 yr | |||||||||||||||||||||||||||||||||||||||||||||||||||||||||||||||||||||||||||||||||||||||||||
| White Women (n=5,816) | |||||||||||||||||||||||||||||||||||||||||||||||||||||||||||||||||||||||||||||||||||||||||||||||||||
| Volume MET-h | 9.9 | 10.1 | 9.9 | 10.2 | 11.2 | 11.0 | 9.1 | 6.2 | 2.6 | ||||||||||||||||||||||||||||||||||||||||||||||||||||||||||||||||||||||||||||||||||||||||||
| (9.6, 10.3) | (9.9, 10.4) | (9.6, 10.1) | (9.9, 10.5) | (10.9, 11.5) | (10.6, 11.3) | (8.6, 9.6) | (5.4, 7.0) | (1.4, 3.8) | |||||||||||||||||||||||||||||||||||||||||||||||||||||||||||||||||||||||||||||||||||||||||||
| Intensity MET | 3.3 | 3.2 | 3.1 | 3.1 | 3.0 | 2.8 | 2.4 | 2.0 | 1.4 | ||||||||||||||||||||||||||||||||||||||||||||||||||||||||||||||||||||||||||||||||||||||||||
| (3.2, 3.4) | (3.1, 3.4) | (2.9, 3.2) | (2.9, 3.2) | (2.8, 3.2) | (2.6, 3.0) | (2.2, 2.6) | (1.7, 2.2) | (1.2, 1.7) | |||||||||||||||||||||||||||||||||||||||||||||||||||||||||||||||||||||||||||||||||||||||||||
| Duration h | 2.1 | 2.1 | 2.0 | 2.2 | 2.5 | 2.4 | 2.0 | 1.5 | 0.9 | ||||||||||||||||||||||||||||||||||||||||||||||||||||||||||||||||||||||||||||||||||||||||||
| (1.9, 2.2) | (1.9, 2.3) | (1.8, 2.3) | (2.0, 2.5) | (2.2, 2.7) | (2.1, 2.6) | (1.8, 2.3) | (1.2, 1.9) | (0.6, 1.3) | |||||||||||||||||||||||||||||||||||||||||||||||||||||||||||||||||||||||||||||||||||||||||||
| White Men (n=5,249) | |||||||||||||||||||||||||||||||||||||||||||||||||||||||||||||||||||||||||||||||||||||||||||||||||||
| Volume MET-h | 12.8 | 12.9 | 12.4 | 14.0 | 15.1 | 15.8 | 14.4 | 11.5 | 7.9 | ||||||||||||||||||||||||||||||||||||||||||||||||||||||||||||||||||||||||||||||||||||||||||
| (12.3, 13.3) | (12.6, 13.3) | (12.1, 12.8) | (13.6, 14.3) | (14.7, 15.5) | (15.3, 16.2) | (14.0, 14.9) | (10.9, 12.3) | (6.6, 9.2) | |||||||||||||||||||||||||||||||||||||||||||||||||||||||||||||||||||||||||||||||||||||||||||
| Intensity MET | 3.5 | 3.1 | 2.9 | 2.8 | 2.6 | 2.4 | 2.0 | 1.6 | 1.0 | ||||||||||||||||||||||||||||||||||||||||||||||||||||||||||||||||||||||||||||||||||||||||||
| (3.0, 3.8) | (2.6, 3.5) | (2.3, 3.3) | (2.1, 3.2) | (1.9, 3.1) | (1.6, 2.9) | (1.1, 2.7) | (0.6, 2.3) | (0.0, 1.8) | |||||||||||||||||||||||||||||||||||||||||||||||||||||||||||||||||||||||||||||||||||||||||||
| Duration h | 2.5 | 2.6 | 2.6 | 3.0 | 3.4 | 3.5 | 3.2 | 2.7 | 2.1 | ||||||||||||||||||||||||||||||||||||||||||||||||||||||||||||||||||||||||||||||||||||||||||
| (2.2, 2.8) | (2.3, 2.9) | (2.3, 3.0) | (2.6, 3.5) | (3.0, 3.9) | (3.0, 4.0) | (2.7, 3.7) | (2.2, 3.3) | (1.5, 2.8) | |||||||||||||||||||||||||||||||||||||||||||||||||||||||||||||||||||||||||||||||||||||||||||
| African American Women (n=2,450) | 45-49 yr | 50-54 yr | 55-59 yr | 60-64 yr | 65-69 yr | 70-74 yr | 75-79 yr | 80-84 yr | 85-90 yr | ||||||||||||||||||||||||||||||||||||||||||||||||||||||||||||||||||||||||||||||||||||||||||
| Volume MET-h | 4.2 | 5.2 | 5.9 | 6.4 | 6.7 | 6.7 | 6.6 | 6.4 | 6.1 | ||||||||||||||||||||||||||||||||||||||||||||||||||||||||||||||||||||||||||||||||||||||||||
| (3.7, 4.7) | (4.7, 5.6) | (5.4, 6.4) | (5.9, 7.0) | (6.1, 7.3) | (6.0, 7.4) | (5.8, 7.4) | (5.5, 7.4) | (5.0, 7.3) | |||||||||||||||||||||||||||||||||||||||||||||||||||||||||||||||||||||||||||||||||||||||||||
| Intensity MET | 2.1 | 2.2 | 2.4 | 2.4 | 2.5 | 2.5 | 2.5 | 2.4 | 2.4 | ||||||||||||||||||||||||||||||||||||||||||||||||||||||||||||||||||||||||||||||||||||||||||
| (1.7, 2.4) | (1.8, 2.5) | (1.9, 2.7) | (2.0, 2.8) | (2.0, 2.8) | (1.9, 2.9) | (1.9, 2.9) | (1.8, 2.9) | (1.7, 2.9) | |||||||||||||||||||||||||||||||||||||||||||||||||||||||||||||||||||||||||||||||||||||||||||
| Duration h | 0.4 | 0.6 | 0.7 | 0.8 | 0.8 | 0.7 | 0.6 | 0.4 | 0.2 | ||||||||||||||||||||||||||||||||||||||||||||||||||||||||||||||||||||||||||||||||||||||||||
| (0.1, 0.8) | (0.2, 1.0) | (0.3, 1.1) | (0.4, 1.2) | (0.4, 1.3) | (0.2, 1.2) | (0.0, 1.1) | (0.0, 1.0) | (0.0, 0.9) | |||||||||||||||||||||||||||||||||||||||||||||||||||||||||||||||||||||||||||||||||||||||||||
| African American Men (n=1,521) | |||||||||||||||||||||||||||||||||||||||||||||||||||||||||||||||||||||||||||||||||||||||||||||||||||
| Volume MET-h | 8.6 | 8.4 | 8.6 | 8.8 | 8.4 | 7.5 | 6.3 | 4.8 | 3.0 | ||||||||||||||||||||||||||||||||||||||||||||||||||||||||||||||||||||||||||||||||||||||||||
| (7.7, 9.5) | (7.6, 9.3) | (7.7, 9.6) | (7.6, 10.0) | (7.1, 9.7) | (6.1, 9.0) | (4.6, 8.0) | (2.6, 7.0) | (0.2, 5.9) | |||||||||||||||||||||||||||||||||||||||||||||||||||||||||||||||||||||||||||||||||||||||||||
| Intensity MET | 2.8 | 2.6 | 2.4 | 2.2 | 2.3 | 2.2 | 2.0 | 1.8 | 1.5 | ||||||||||||||||||||||||||||||||||||||||||||||||||||||||||||||||||||||||||||||||||||||||||
| (2.3, 3.2) | (2.1, 3.0) | (1.9, 2.8) | (1.6, 2.7) | (1.7, 2.8) | (1.6, 2.8) | (1.4, 2.6) | (1.1, 2.5) | (0.7, 2.4) | |||||||||||||||||||||||||||||||||||||||||||||||||||||||||||||||||||||||||||||||||||||||||||
| Duration h | 1.3 | 1.5 | 1.6 | 1.6 | 1.6 | 1.4 | 1.2 | 1.0 | 0.8 | ||||||||||||||||||||||||||||||||||||||||||||||||||||||||||||||||||||||||||||||||||||||||||
| (0.8, 1.7) | (1.0, 2.0) | (1.0, 2.2) | (1.0, 2.2) | (0.8, 2.2) | (0.6, 2.2) | (0.4, 2.1) | (0.1, 1.9) | (0.0, 1.7) | |||||||||||||||||||||||||||||||||||||||||||||||||||||||||||||||||||||||||||||||||||||||||||
| * Each ~5-yr interval estimate calculated as weighted average of 1-yr fitted values generated by joint models, with corresponding standard errors as weights. | |||||||||||||||||||||||||||||||||||||||||||||||||||||||||||||||||||||||||||||||||||||||||||||||||||
Life-course patterns in LTPA by race and sex
Differences in the average weekly LTPA duration were observed by race and sex subgroups from age 45 to 90 years. Duration of LTPA was highest among white men transitioning into older adulthood, followed by white women, African American men, and African American women. Similar patterns were observed for LTPA intensity and volume until age 75 for African American men, white men, and white women. We did not see declines in intensity of LTPA among African American women, whose intensity levels remained stable across the adult life course. The highest levels of LTPA intensity reported by African American women occurred by age 75 and on. In contrast, white men reported the lowest intensity of LTPA among all race-sex subgroups by age 75.
Despite the declines in intensity, white men expended more energy on LTPA (as captured by volume) compared to the other race-sex subgroups over the entire interval from age 45 to 90 years. Although these energy expenditure estimates in white adults were initially double those of their African American counterparts at mid-life, a decline in total LTPA volume to similarly low levels of 5-7 MET-h occurred by age 80 for all subjects. From age 80 and on, African American women actually showed greater levels of LTPA volume than white women and African American men.
Role of retirement
To assess the factors that may inform changes in LTPA across the life course, we explored the role of retirement on changes in LTPA [24, 25]. In Supplementary Table 1 and 2, we examined mean differences in the average weekly intensity (in MET) and duration (in h) of LTPA by retirement status across ~5-yr intervals from ages 45-75 years. Differences in intensity and duration were observed across sex, but not race. Retired men engaged in 2.5 (95% CI: 0.2, 4.8) more h of LTPA on average each week compared to men who remained employed at ages 70-75. Average weekly LTPA intensity among retired women was reported to be 1.5 (95% CI: 0.3, 2.7) MET greater than that of non-retired women at ages 70-75.
Discussion
Trajectories of LTPA volume in U.S. adults were characterized from age 45 to 90 years in a biracial, community-based cohort estimated from repeat measures of PA performed during leisure-time collected over more than two decades. Longitudinal patterns in the average energy expenditure of LTPA (as measured by LTPA volume and across its components of intensity and duration) were estimated across the adult life epoch in four race-sex subpopulations, using joint modeling to account for bias associated with cohort attrition.
African American women and men, on average, showed relatively low levels of energy expenditure (via LTPA) from mid-life to older adulthood. In contrast, white men and women exerted nearly double the energy at baseline as that of their African American counterparts. Among white adults, increases in LTPA expenditure were observed the seventh decade of life, followed by declines in volumes of LTPA that reached levels similar to those of the African American cohort members.
The temporal patterns in PA among free-living adults illustrated by these results are in general agreement with recent reports on PA in European populations. For instance, age was associated with lower PA duration among British adults approaching older adulthood in the Whitehall II cohort [19] and with lower likelihood of PA engagement later in life in a Finnish population-based cohort [20]. The patterns of LTPA levels observed by race and sex in this study are also consistent with reported findings from cross-sectional samples of U.S. adults [26].
Our results relating retirement to LTPA engagement are similar to previous investigations using ARIC data [24, 25]. The differences observed by retirement status provide further indication that retirement from work is associated with greater engagement in PA among older adults. The different patterns observed upon retirement between women and men, specific to the average weekly intensity and duration of LTPA, suggest potential differences in how men and women adopt PA with more available leisure-time. In order to consider policy implications, the results reported here merit replication in other cohorts.
Since the information on PA collected in this study is based on self-report, our data are susceptible to reporting error and possible misclassification bias. The use of device-based measurements of PA, such as by accelerometry, is however challenging for extended follow-up of large cohorts. Given its strong performance against more objective PA measures [27–29, 31], the Baecke questionnaire provides reasonably valid and consistent estimates. While in this study information was only available for sport or exercise activities performed during times of leisure and not for other types of PA, most discretionary PA is in fact performed at leisure-time [29]. Furthermore, a more feasible opportunity for lifestyle intervention is offered during leisure-time in comparison to other domains of activity.
The focus on longitudinal examination of PA over a wide age span is a salient strength of this study, thereby capturing the influence of important life transitions from middle age into older adulthood, including retirement as presented in supplementary analysis. To appropriately evaluate such an extended follow-up period, the use of joint modeling to correct for informative censoring proved to be critical since failing to account for the influence of cohort attrition would have led to inaccurate characterization of LTPA to some degree across all four race-sex groups. Generalizability of the reported estimates is aided by the demographic diversity and population-based nature of the cohort.
Our results identified temporal patterns of LTPA volume, intensity, and duration among African American and white women and men in a population-based cohort from mid-life to older adulthood. Distinct age-related patterns were observed in each LTPA component by race and sex over the course of the adult life epoch. The reported findings can inform the design and testing of lifestyle interventions of the role of PA in the maintenance of health and functioning.
Materials and Methods
Study population
The community-based ARIC Study cohort consists of 15,792 men and women (of whom predominately reported as white or African American) aged 45-64 years at baseline visit 1 (1987-1989), sampled from four U.S. communities (Forsyth County, NC; Jackson, MS; Minneapolis, MN; and Washington County, MD) [22]. Participants who did not report white or African American, participants reporting African American from Minneapolis or Washington County, in addition to participants with any missing baseline covariate data were excluded (<5% in total), providing a total of 15,036 participants for analysis.
Follow-up examinations to monitor cardiovascular conditions, reassess cardiometabolic factors, and gage social/lifestyle variables took place in 1990-1992 (visit 2), 1993-1995 (visit 3), 1996-1998 (visit 4), and 2011-2013 (visit 5). Institutional review boards at participating sites approved the ARIC Study, and informed consent was obtained from participants at every clinic visit.
Measurement of PA
Self-reported information related to the type and frequency of PA performed during leisure-time (i.e., LTPA) was collected at baseline, visit 3, and visit 5 in the ARIC Study using a modified version of the Baecke Physical Activity questionnaire [30] administered by trained interviewers through a standardized protocol. The instrument has demonstrated modest correlation to cardio-respiratory fitness (0.5-0.7) and accelerometer-assessed PA (0.6-0.7), a moderate association with alternate self-report assessments (e.g., ~0.5 with PA diary), and consistently high repeatability (e.g., ≥0.6 in men) across various other study populations [28, 29, 31].
Within the modified Baecke, participants were asked whether they exercised or played sports during leisure-time over the past year. Those indicating they did so were requested to list (up to four) activities performed and to estimate the number of hours per week and months of the year they engaged in each activity [31]. Reported activities were assigned their corresponding intensity values (in MET) per the Compendium of Physical Activities. This intensity can be interpreted as the power or work rate (i.e., energy per h) of that activity’s performance relative to what is exerted at rest (or 1 MET, roughly equivalent to 1 kilocalorie per kilogram of body weight per h) [32]. Using this information, continuous estimates of the average weekly duration, intensity, and volume of LTPA were derived as so (for four reported activities):
Duration is the time (in h) spent on LTPA each week on average, calculated weighting by the proportion of months each activity makes up of the total months of all reported activities:
h1∙ (monthsactivity 1 / monthstotal) + h2 ∙ (monthsactivity 2 / monthstotal) +
h3 ∙ (monthsactivity 3 / monthstotal) + h4 ∙ (monthsactivity 4 / monthstotal).
Intensity is the power (in MET) of the average weekly LTPA regimen, calculated weighting by the proportion of the duration of all reported activities represented by each activity:
MET1 ∙ (durationactivity 1 / durationtotal) + MET2 ∙ (durationactivity 2 / durationtotal)
+ MET3 ∙ (durationactivity 3 / durationtotal) + MET4 ∙ (durationactivity 4 / durationtotal).
Volume (in MET-h) of LTPA is the arithmetic product of intensity (i.e., power or hourly work rate in MET) and duration (h). As the product of measures of power and time, volume physically represents the total work, or energy expenditure, of the average weekly LTPA.
Reports of no engagement in LTPA are incorporated in analytic samples to provide estimated trajectories applicable to the general population of aging adults, including the considerable proportion of those who do not engage in LTPA. A report of no LTPA is assigned an intensity of 1.0 MET (corresponding to being generally at rest during leisure-time), a duration of 0 h, and accordingly a volume of 0 MET-h.
Covariates
Sociodemographic variables were self-reported by ARIC participants at baseline including age, sex, white or African American, as well as highest educational attainment (<, =, or > high school). Cardio-metabolic factors were also assessed at baseline. Sitting blood pressures were measured three times following a 5-minute rest. The mean of the last two measurements is applied for classification of prevalent hypertension, indicated by a systolic blood pressure >140 mmHg, a diastolic blood pressure >90 mmHg, or self-reported use of antihypertensive medication. Information on both cigarette and drinking status (current, former, or never) is available from questionnaire response. Baseline anthropometric measurements used in computation of body mass index (BMI) are the quotient of weight (in kg) and squared height (meters2). A cut-off of ≥30 kg/m2 was employed to index obesity. Prevalent diabetes was identified by a fasting blood glucose ≥126 mg/dL, a non-fasting serum glucose ≥200 mg/dL, self-reported use of hypoglycemic medications (oral or insulin), or self-reported physician diagnosis of diabetes. Occupational status information was self-reported at baseline, at visit 3, and over annual follow-up calls thereafter. For this study, participants who reported working at mid-life are identified as either retired or non-retired (i.e., no longer working versus still employed).
Statistical analysis
Assuming data are informatively censored (due to cohort attrition), ‘conventional’ strategies for longitudinal analysis of prospective data – such as mixed models, which rely on only the available (i.e., non-missing) measures of the longitudinal outcome [33] – may lead to biased estimation [34]. While application of imputation and weighting methods can provide unbiased estimates when missingness of follow-up data does not depend directly upon the longitudinal variable of interest, these techniques are unable to produce valid (or precise) estimates when missingness in these data occurs under an MNAR mechanism at rates ≥25% [35].
Due to the high rate of dropout common to cohorts with extended follow-up, particularly those that follow large samples of aging adults, it is important to consider the potential influence of informative attrition on the validity of study estimates [34, 35]. Bayesian joint models [36, 37] allow for valid causal inference in the presence of incomplete data, and are particularly well suited for application to the present setting in which death and dropout occur as competing risks. The outcome of missingness or more formally, right-censoring, is quantified as a binary indicator. Bayesian joint modeling proceeds through a Markov Chain Monte Carlo algorithm to generate subsequent increments of simulated information over continuous time.
Age was used as the time scale in this study also as a way to simplify model fitting and provide interpretable LTPA trajectories [38]. Piecewise cubic splines [39] were applied in the fixed effects of mixed sub-models to allow for flexible modeling of marginal (i.e., population-level) trends in the LTPA components over this extended life epoch. Detailed evaluation of likelihood ratio tests, fit statistics, and residual diagnostics, as well as visual inspection guided the placement of spline knots. Splines were not configured into the random effects structure of mixed sub-models, as they did not prove to be necessary and may thus have led to over-specification. A more relaxed random intercepts and slopes structure allowed for adequate model fit of individual deviations in LTPA. Further, a semiparametric Bayesian modeling approach [37] was applied to relax the normality assumption and accommodate the skewness from the aforementioned reports of no LTPA. Baseline values of educational attainment, cigarette smoking, diabetes, obesity, and hypertension were included as covariates in the relative risk sub-models for the missingness process.
For each LTPA measure, assessment of temporal patterns, differences by race and/or sex, as well as informative censoring involved visual and quantitative evaluation. An estimate (noted in the Results as α) was produced in joint models used to assess the presence (test of statistical significance), direction (sign of α), and degree (magnitude of α) of informative censoring. Race-sex specific population-based trajectories of LTPA volume, intensity, and duration were illustrated by combining and superimposing each set of 1-yr estimates (and 95% CI bounds) from age 45 to 90 generated by joint models and corresponding mixed sub-models. Estimates from joint models were quantified over ~5-yr intervals from age 45 to 90. All statistical procedures were performed in R v3.4.0.
Supplementary Materials
Author Contributions
DK performed all statistical analyses of the data and drafted the manuscript. KRE, DZ, CLA, PP, and SBK offered expert input and critical review in preparation of the manuscript. GH coordinated the study, assisted with valuable feedback throughout the manuscript development process, and provided funding. All authors approved the final manuscript.
Acknowledgments
The authors thank the staff and participants of the ARIC study for their important contributions.
Conflicts of Interest
The authors declare that there are no conflicts of interest.
Funding
The Atherosclerosis Risk in Communities study has been funded in whole or in part with Federal funds from the National Heart, Lung, and Blood Institute, National Institutes of Health, Department of Health and Human Services, under Contract nos. (HHSN268201700001I, HHSN268201700002I, HHSN268201700003I, HHSN 268201700005I, HHSN268201700004I). P. Palta is supported by grant R00 AG052830 from the National Institute of Aging.
References
- 1. U.S. Department of Health and Human Services, Administration on Aging. A profile of older Americans: 2011. http://www.aoa.gov/AoAroot/Aging_Statistics/Profile/2011/docs/2011profile.pdf. .
- 2. Wan H, Sengupta M, Velkoff VA, DeBarros KA. US Census Bureau, Current Population Reports, 65+ in the United States. Washington (DC): U.S. Government Printing Office; 2005.
- 3. Colby SL, Ortman JM. Census Bureau, Current Population Reports, Projections of the Size and Composition of the U.S. Population: 2014 to 2060. Washington (DC): U.S. Government Printing Office; 2005. pp. 25–1143.
- 4. He W, Muenchrath MN. 90+ in the United States: 2006–2008. U.S. Census Bureau, American Community Survey Reports, ACS-17. Washington (DC): U.S. Government Printing Office; 2011. https://www2.census.gov/library/publications/2011/acs/acs-17.pdf. .
- 5. Centers for Disease Control and Prevention. The state of aging and health in America 2013. Atlanta, GA: Centers for Disease Control and Prevention, U.S. Department of Health and Human Services; 2013. https://www.cdc.gov/aging/pdf/state-aging-health-in-america-2013.pdf. .
- 6. Rowe JW, Kahn RL. Successful aging. Gerontologist. 1997; 37:433–40. https://doi.org/10.1093/geront/37.4.433 [PubMed]
- 7. Cosco TD, Prina AM, Perales J, Stephan BC, Brayne C. Operational definitions of successful aging: a systematic review. Int Psychogeriatr. 2014; 26:373–81. https://doi.org/10.1017/S1041610213002287 [PubMed]
- 8. Forouzanfar MH, Afshin A, Alexander LT, Anderson HR, Bhutta ZA, Biryukov S, Brauer M, Burnett R, Cercy K, Charlson FJ, Cohen AJ, Dandona L, Estep K, et al, and GBD 2015 Risk Factors Collaborators. Global, regional, and national comparative risk assessment of 79 behavioural, environmental and occupational, and metabolic risks or clusters of risks, 1990-2015: a systematic analysis for the Global Burden of Disease Study 2015. Lancet. 2016; 388:1659–724. https://doi.org/10.1016/S0140-6736(16)31679-8 [PubMed]
- 9. Jensen MD, Ryan DH, Apovian CM, Ard JD, Comuzzie AG, Donato KA, Hu FB, Hubbard VS, Jakicic JM, Kushner RF, Loria CM, Millen BE, Nonas CA, et al, and American College of Cardiology/American Heart Association Task Force on Practice Guidelines, and Obesity Society. 2013 AHA/ACC/TOS guideline for the management of overweight and obesity in adults: a report of the American College of Cardiology/American Heart Association Task Force on Practice Guidelines and The Obesity Society. J Am Coll Cardiol. 2014 (25 Pt B); 63:2985–3023. https://doi.org/10.1016/j.jacc.2013.11.004 [PubMed]
- 10. Hemmingsson E, Ekelund U. Is the association between physical activity and body mass index obesity dependent? Int J Obes. 2007; 31:663–68. https://doi.org/10.1038/sj.ijo.0803458 [PubMed]
- 11. Monteiro MD, Sobral Filho DC. Physical exercise and blood pressure control. Rev Bras Med Esporte. 2004; 10:513–16. http://www.scielo.br/pdf/rbme/v10n6/en_a08v10n6. Accessed December 2, 2017. https://doi.org/10.1590/S1517-86922004000600008
- 12. Fagard RH, Cornelissen VA. Effect of exercise on blood pressure control in hypertensive patients. Eur J Cardiovasc Prev Rehabil. 2007; 14:12–17. https://doi.org/10.1097/HJR.0b013e3280128bbb [PubMed]
- 13. Colberg SR, Sigal RJ, Yardley JE, Riddell MC, Dunstan DW, Dempsey PC, Horton ES, Castorino K, Tate DF. Physical activity/exercise and diabetes: a position statement of the American Diabetes Association. Diabetes Care. 2016; 39:2065–79. https://doi.org/10.2337/dc16-1728 [PubMed]
- 14. Yorston LC, Kolt GS, Rosenkranz RR. Physical activity and physical function in older adults: the 45 and up study. J Am Geriatr Soc. 2012; 60:719–25. https://doi.org/10.1111/j.1532-5415.2012.03906.x [PubMed]
- 15. Paterson DH, Warburton DE. Physical activity and functional limitations in older adults: a systematic review related to Canada’s Physical Activity Guidelines. Int J Behav Nutr Phys Act. 2010; 7:38. https://doi.org/10.1186/1479-5868-7-38 [PubMed]
- 16. Pahor M, Blair SN, Espeland M, Fielding R, Gill TM, Guralnik JM, Hadley EC, King AC, Kritchevsky SB, Maraldi C, Miller ME, Newman AB, Rejeski WJ, et al, and LIFE Study Investigators. Effects of a physical activity intervention on measures of physical performance: results of the lifestyle interventions and independence for Elders Pilot (LIFE-P) study. J Gerontol A Biol Sci Med Sci. 2006; 61:1157–65. https://doi.org/10.1093/gerona/61.11.1157 [PubMed]
- 17. Blazer DG, Yaffe K, Liverman CT, editors. Cognitive Aging: Progress in Understanding and Opportunities for Action. Washington (DC): National Academy of Sciences; 2015.
- 18. DiPietro L. Physical activity in aging: changes in patterns and their relationship to health and function. J Gerontol A Biol Sci Med Sci. 2001 (Spec No 2); 56:13–22. https://doi.org/10.1093/gerona/56.suppl_2.13 [PubMed]
- 19. Hamer M, Kivimaki M, Steptoe A. Longitudinal patterns in physical activity and sedentary behaviour from mid-life to early old age: a substudy of the Whitehall II cohort. J Epidemiol Community Health. 2012; 66:1110–15. https://doi.org/10.1136/jech-2011-200505 [PubMed]
- 20. Borodulin K, Mäkinen TE, Leino-Arjas P, Tammelin TH, Heliövaara M, Martelin T, Kestilä L, Prättälä R. Leisure time physical activity in a 22-year follow-up among Finnish adults. Int J Behav Nutr Phys Act. 2012; 9:121–26. https://doi.org/10.1186/1479-5868-9-121 [PubMed]
- 21. Cooper R, Mishra GD, Kuh D. Physical activity across adulthood and physical performance in midlife: findings from a British birth cohort. Am J Prev Med. 2011; 41:376–84. https://doi.org/10.1016/j.amepre.2011.06.035 [PubMed]
- 22. The Atherosclerosis Risk in Communities (ARIC) Study: design and objectives. The ARIC investigators. Am J Epidemiol. 1989; 129:687–702. https://doi.org/10.1093/oxfordjournals.aje.a115184 [PubMed]
- 23. Baecke JA, Burema J, Frijters JE. A short questionnaire for the measurement of habitual physical activity in epidemiological studies. Am J Clin Nutr. 1982; 36:936–42. https://doi.org/10.1093/ajcn/36.5.936 [PubMed]
- 24. Evenson KR, Rosamond WD, Cai J, Diez-Roux AV, Brancati FL, and Atherosclerosis Risk In Communities Study Investigators. Influence of retirement on leisure-time physical activity: the atherosclerosis risk in communities study. Am J Epidemiol. 2002; 155:692–99. https://doi.org/10.1093/aje/155.8.692 [PubMed]
- 25. Jones SA, Li Q, Aiello AE, O’Rand AM, Evenson KR. Physical Activity, Sedentary Behavior, and Retirement: The Multi-Ethnic Study of Atherosclerosis. Am J Prev Med. 2018; 54:786–94. https://doi.org/10.1016/j.amepre.2018.02.022 [PubMed]
- 26. Office of Disease Prevention and Health Promotion. Healthy People 2020. ODPHP Publication No. B0132. Washington, DC: U.S. Department of Health and Human Services; 2010. https://www.healthypeople.gov/2020/topicsobjectives/topic/immunization-and-infectious-diseases/objectives. .
- 27. Jacobs DR
Jr , Ainsworth BE, Hartman TJ, Leon AS. A simultaneous evaluation of 10 commonly used physical activity questionnaires. Med Sci Sports Exerc. 1993; 25:81–91. https://doi.org/10.1249/00005768-199301000-00012 [PubMed] - 28. Pols MA, Peeters PH, Kemper HC, Collette HJ. Repeatability and relative validity of two physical activity questionnaires in elderly women. Med Sci Sports Exerc. 1996; 28:1020–25. https://doi.org/10.1097/00005768-199608000-00012 [PubMed]
- 29. Richardson MT, Ainsworth BE, Wu HC, Jacobs DR
Jr , Leon AS. Ability of the Atherosclerosis Risk in Communities (ARIC)/Baecke Questionnaire to assess leisure-time physical activity. Int J Epidemiol. 1995; 24:685–93. https://doi.org/10.1093/ije/24.4.685 [PubMed] - 30. Folsom AR, Arnett DK, Hutchinson RG, Liao F, Clegg LX, Cooper LS. Physical activity and incidence of coronary heart disease in middle-aged women and men. Med Sci Sports Exerc. 1997; 29:901–09. https://doi.org/10.1097/00005768-199707000-00009 [PubMed]
- 31. Ainsworth BE, Haskell WL, Herrmann SD, Meckes N, Bassett DR
Jr , Tudor-Locke C, Greer JL, Vezina J, Whitt-Glover MC, Leon AS. 2011 Compendium of Physical Activities: a second update of codes and MET values. Med Sci Sports Exerc. 2011; 43:1575–81. https://doi.org/10.1249/MSS.0b013e31821ece12 [PubMed] - 32. Angevaren M, Vanhees L, Wendel-Vos W, Verhaar HJ, Aufdemkampe G, Aleman A, Verschuren WM. Intensity, but not duration, of physical activities is related to cognitive function. Eur J Cardiovasc Prev Rehabil. 2007; 14:825–30. https://doi.org/10.1097/HJR.0b013e3282ef995b [PubMed]
- 33. Lin H, McCulloch CE, Mayne ST. Maximum likelihood estimation in the joint analysis of time-to-event and multiple longitudinal variables. Stat Med. 2002; 21:2369–82. https://doi.org/10.1002/sim.1179 [PubMed]
- 34. Karahalios A, Baglietto L, Carlin JB, English DR, Simpson JA. A review of the reporting and handling of missing data in cohort studies with repeated assessment of exposure measures. BMC Med Res Methodol. 2012; 12:96. https://doi.org/10.1186/1471-2288-12-96 [PubMed]
- 35. Kristman VL, Manno M, Côté P. Methods to account for attrition in longitudinal data: do they work? A simulation study. Eur J Epidemiol. 2005; 20:657–62. https://doi.org/10.1007/s10654-005-7919-7 [PubMed]
- 36. Tsiatis AA, Davidian M. Joint modeling of longitudinal and time-to-event data: an overview. Stat Sin. 2004; 14:809–34. http://www3.stat.sinica.edu.tw/statistica/oldpdf/A14n39.pdf.
- 37. Rizopoulos D. The R package JMbayes for fitting joint models for longitudinal and time-to-event data MCMC. J Stat Softw. 2016; 72:1–45. https://doi.org/10.18637/jss.v072.i07
- 38. Lamarca R, Alonso J, Gómez G, Muñoz A. Left-truncated data with age as time scale: an alternative for survival analysis in the elderly population. J Gerontol A Biol Sci Med Sci. 1998; 53:M337–43. https://doi.org/10.1093/gerona/53A.5.M337 [PubMed]
- 39. Grajeda LM, Ivanescu A, Saito M, Crainiceanu C, Jaganath D, Gilman RH, Crabtree JE, Kelleher D, Cabrera L, Cama V, Checkley W. Modelling subject-specific childhood growth using linear mixed-effect models with cubic regression splines. Emerg Themes Epidemiol. 2016; 13:1. https://doi.org/10.1186/s12982-015-0038-3 [PubMed]