


Introduction
Since the end of 2019, a novel coronavirus with person-to-person transmission has spread to many other countries worldwide [1–5]. Previous epidemiology report uncovered that the epidemic of coronavirus disease 2019 (COVID-19) has doubled every 7.4 day in its early stage, with an average serial interval of 7.5 days [3]. Early information estimated that the basic reproductive number R0 was estimated to be 1.4 – 2.5 reported by WHO [2]. The pandemic is accelerating at an exponential rate and at risk of escalating into a global health emergency [2]. The mortality of coronavirus disease 2019 (COVID-19) patients in China is approximately 2.3%, compared with 9.6% of severe acute respiratory syndrome (SARS) and 34.4% of middle east respiratory syndrome (MERS) reported by WHO [6]. Even this virus is not as fetal as people thought, the transmissibility is far exceeding that of SARS and MERS [7]. Although many clinical and epidemiological literatures have been published [3–6, 8–10], the spread in still ongoing and the early warning parameters for disease progression remain incomplete.
Compared to symptoms, chest CT findings were more rapid and frequent [11, 12]. The imaging performance on chest CT scans from COVID-19 patients mainly manifested as bilateral ground-glass opacities (GGOs) in the lung periphery [13]. In a retrospective cohort, chest CTs of 121 symptomatic COVID-19 patients have been reviewed. Bilateral lung involvement was observed in 10/36 early patients (28%), 25/33 intermediate patients (76%), and 22/25 late patients (88%) [11]. Currently, chest CT is used to assess the severity of lung involvement in COVID-19 pneumonia [14]. In a cohort study, 85.7% (54/63) confirmed COVID-19 patients developed imaging progression including enlarged and increased extent of GGOs and consolidation at early follow-up chest CT scans [12]. That is, short-term imaging progression on chest CT from COVID-19 patients should be early predicted and intervened.
In this analysis, we summarized the baseline characteristics and investigated the potential predictive parameters for imaging progression on chest CT scans at first week after admission of COVID-19 patients, in the hope that the data may provide novel biomarker candidates as well as useful insights into the pathogenesis and progression of COVID-19 patients.
Results
Imaging performance of progression and progression-free patients
As shown in Figure 1, most mild type COVID-19 patients had bilateral and peripheral GGOs, consolidation and linear opacities imaging involvements on chest CT at the first admission day. Some patients had no remarkable hallmarks. At the first six (±1) day, enlarged and increased GGOs, consolidation, solid nodules and fibrous stripes were observed for patients suffered from imaging progression on chest CT scans. On the contrary, the GGOs, consolidation and linear opacities were partly resolved and decreased for imaging progression-free patients.
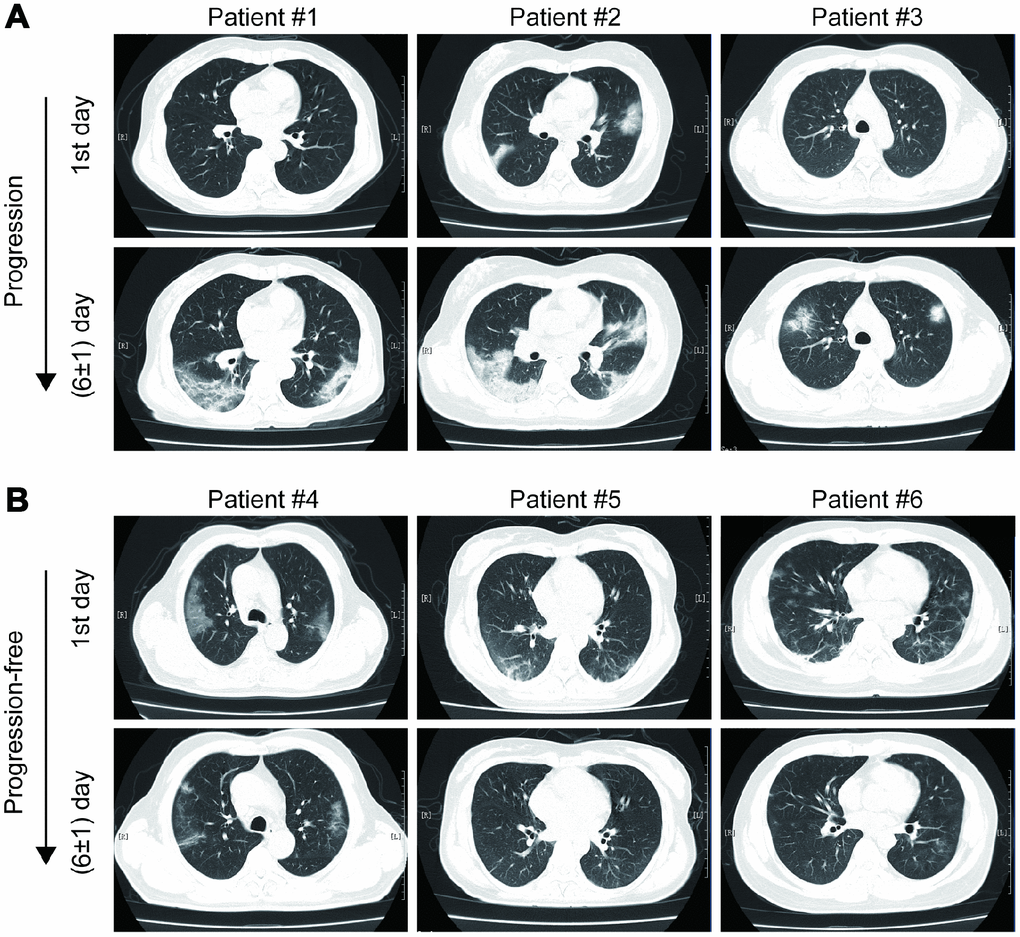
Figure 1. Examples of imaging progression (A) and progression-free (B) in chest CT from COVID-19 patients.
Baseline characteristics and inflammatory model comparisons between imaging progression and progression-free patients
In total, 71 COVID-19 patients suffered from imaging progression on chest CT at first week after admission, and the other 202 patients were imaging progression-free on chest CT. As summarized in Table 1, the patients in imaging progression group were significantly older than those in imaging progression-free group (p = 0.006, Table 1). More patients were treated with gamma globulin and thymosin in imaging progression group compared to those without imaging progression (p = 0.022 and p = 0.001, respectively, Table 1). In blood routine tests, the white blood cells (WBC), platelets and neutrophils were significantly lower in imaging progression patients than those in imaging progression-free ones (p = 0.025, p = 0.044 and p = 0.014, respectively, Table 1), while the monocytes were significantly higher in imaging progression patients (p = 0.025, Table 1). Additionally, acid glycoprotein was significantly lower in imaging progression patients (p = 0.037, Table 1). In liver function tests, gamma-glutamyl transferase (GGT) levels were significantly higher in imaging progression-free patients (p = 0.045, Table 1), while homocysteine levels were significantly higher in imaging progression patients (p = 0.006, Table1). In kidney function tests, urea, creatinine and serum cystatin C levels were significantly higher in imaging progression patients compared to those in imaging progression-free ones (p = 0.011, p = 0.007, respectively, Table 1). As we expected, the estimated glomerular filtration rate (eGFR) levels were significantly decreased in imaging progression patients (p < 0.001, Table 1). No differences were found in cardiac markers and coagulation function tests.
Table 1. Baseline characteristics of COVID-19 patients.
| Variables | Chest CT | p value | |||||||||||||||||||||||||||||||||||||||||||||||||||||||||||||||||||||||||||||||||||||||||||||||||
| Progression group (n = 71) | Progression-free group (n = 202) | ||||||||||||||||||||||||||||||||||||||||||||||||||||||||||||||||||||||||||||||||||||||||||||||||||
| Age, years, mean ± SD | 53.5 ± 1.9 | 47.6 ± 1.1 | 0.006 | ||||||||||||||||||||||||||||||||||||||||||||||||||||||||||||||||||||||||||||||||||||||||||||||||
| Male, n (%) | 33 (46.5) | 101 (50) | 0.61 | ||||||||||||||||||||||||||||||||||||||||||||||||||||||||||||||||||||||||||||||||||||||||||||||||
| Disease history, n (%) | 0.614 | ||||||||||||||||||||||||||||||||||||||||||||||||||||||||||||||||||||||||||||||||||||||||||||||||||
| None | 48 (67.6) | 143 (70.8) | |||||||||||||||||||||||||||||||||||||||||||||||||||||||||||||||||||||||||||||||||||||||||||||||||
| Hypertension | 13 (18.3) | 27 (13.4) | |||||||||||||||||||||||||||||||||||||||||||||||||||||||||||||||||||||||||||||||||||||||||||||||||
| Diabetes | 7 (9.9) | 11 (5.4) | |||||||||||||||||||||||||||||||||||||||||||||||||||||||||||||||||||||||||||||||||||||||||||||||||
| Fatty liver disease | 12 (16.9) | 27 (13.4) | |||||||||||||||||||||||||||||||||||||||||||||||||||||||||||||||||||||||||||||||||||||||||||||||||
| Others | 3 (4.2) | 21 (10.4) | |||||||||||||||||||||||||||||||||||||||||||||||||||||||||||||||||||||||||||||||||||||||||||||||||
| Epidemiology, n (%) | |||||||||||||||||||||||||||||||||||||||||||||||||||||||||||||||||||||||||||||||||||||||||||||||||||
| Hubei sojourning history | 43 (56.3) | 108 (53.5) | 0.301 | ||||||||||||||||||||||||||||||||||||||||||||||||||||||||||||||||||||||||||||||||||||||||||||||||
| Contact with COVID-19 patients | 27 (38.0) | 72 (35.6) | 0.719 | ||||||||||||||||||||||||||||||||||||||||||||||||||||||||||||||||||||||||||||||||||||||||||||||||
| Therapeutic strategy, n (%) | |||||||||||||||||||||||||||||||||||||||||||||||||||||||||||||||||||||||||||||||||||||||||||||||||||
| Antivirus drugs | 58 (81.7) | 141 (69.8) | 0.053 | ||||||||||||||||||||||||||||||||||||||||||||||||||||||||||||||||||||||||||||||||||||||||||||||||
| Antibiotics | 22 (31.0) | 46 (22.8) | 0.169 | ||||||||||||||||||||||||||||||||||||||||||||||||||||||||||||||||||||||||||||||||||||||||||||||||
| Gamma globulin | 13 (18.3) | 17 (8.4) | 0.022 | ||||||||||||||||||||||||||||||||||||||||||||||||||||||||||||||||||||||||||||||||||||||||||||||||
| Thymosin | 20 (28.2) | 23 (11.4) | 0.001 | ||||||||||||||||||||||||||||||||||||||||||||||||||||||||||||||||||||||||||||||||||||||||||||||||
| Glucocorticoid | 10 (14.1) | 17 (8.4) | 0.169 | ||||||||||||||||||||||||||||||||||||||||||||||||||||||||||||||||||||||||||||||||||||||||||||||||
| TCM decoction | 5 (7.0) | 25 (12.4) | 0.216 | ||||||||||||||||||||||||||||||||||||||||||||||||||||||||||||||||||||||||||||||||||||||||||||||||
| TCM patent | 27 (38.0) | 58 (28.7) | 0.145 | ||||||||||||||||||||||||||||||||||||||||||||||||||||||||||||||||||||||||||||||||||||||||||||||||
| Chest CT imaging, n (%) | 0.504 | ||||||||||||||||||||||||||||||||||||||||||||||||||||||||||||||||||||||||||||||||||||||||||||||||||
| Bilateral lung lesion | 60 (84.5) | 177 (87.6) | |||||||||||||||||||||||||||||||||||||||||||||||||||||||||||||||||||||||||||||||||||||||||||||||||
| Single lung lesion | 11 (15.5) | 25 (12.4) | |||||||||||||||||||||||||||||||||||||||||||||||||||||||||||||||||||||||||||||||||||||||||||||||||
| Blood routine tests, mean ± SD | |||||||||||||||||||||||||||||||||||||||||||||||||||||||||||||||||||||||||||||||||||||||||||||||||||
| WBC, 103/mm3 | 4.6 ± 0.1 | 5.2 ± 0.1 | 0.025 | ||||||||||||||||||||||||||||||||||||||||||||||||||||||||||||||||||||||||||||||||||||||||||||||||
| RBC, 104/mm3 | 4.4 ± 0.1 | 4.5 ± 0.04 | 0.334 | ||||||||||||||||||||||||||||||||||||||||||||||||||||||||||||||||||||||||||||||||||||||||||||||||
| Hemoglobin, g/L | 135.1 ± 1.7 | 136.7 ± 1.1 | 0.465 | ||||||||||||||||||||||||||||||||||||||||||||||||||||||||||||||||||||||||||||||||||||||||||||||||
| Platelet, 103/mm3 | 176.0 ± 6.6 | 195.0 ± 5.1 | 0.044 | ||||||||||||||||||||||||||||||||||||||||||||||||||||||||||||||||||||||||||||||||||||||||||||||||
| Neutrophils, 103/mm3 | 2.9 ± 0.1 | 3.5 ± 0.1 | 0.014 | ||||||||||||||||||||||||||||||||||||||||||||||||||||||||||||||||||||||||||||||||||||||||||||||||
| Lymphocytes, 103/mm3 | 1.2 ± 0.1 | 1.3 ± 0.04 | 0.342 | ||||||||||||||||||||||||||||||||||||||||||||||||||||||||||||||||||||||||||||||||||||||||||||||||
| Monocytes, 103/mm3 | 0.5 ± 0.03 | 0.4 ± 0.01 | 0.025 | ||||||||||||||||||||||||||||||||||||||||||||||||||||||||||||||||||||||||||||||||||||||||||||||||
| Hypersensitive CRP, mg/L, mean ± SD | 17.5 ± 2.4 | 18.7 ± 1.6 | 0.697 | ||||||||||||||||||||||||||||||||||||||||||||||||||||||||||||||||||||||||||||||||||||||||||||||||
| ESR, mm/Hour, mean ± SD | 56.9 ± 4.3 | 64.5 ± 2.7 | 0.148 | ||||||||||||||||||||||||||||||||||||||||||||||||||||||||||||||||||||||||||||||||||||||||||||||||
| Procalcitonin, ng/ml, mean±SD | 0.05 ± 0.01 | 0.09 ± 0.05 | 0.687 | ||||||||||||||||||||||||||||||||||||||||||||||||||||||||||||||||||||||||||||||||||||||||||||||||
| Acid glycoprotein, mg/dl, mean ± SD | 140.9 ± 5.6 | 154.5 ± 3.3 | 0.037 | ||||||||||||||||||||||||||||||||||||||||||||||||||||||||||||||||||||||||||||||||||||||||||||||||
| Liver function tests, mean ± SD | |||||||||||||||||||||||||||||||||||||||||||||||||||||||||||||||||||||||||||||||||||||||||||||||||||
| ALT, U/L | 27.6 ± 2.3 | 27.6 ± 1.4 | 0.995 | ||||||||||||||||||||||||||||||||||||||||||||||||||||||||||||||||||||||||||||||||||||||||||||||||
| AST, U/L | 29.4 ± 1.7 | 29.2 ± 1.6 | 0.958 | ||||||||||||||||||||||||||||||||||||||||||||||||||||||||||||||||||||||||||||||||||||||||||||||||
| GGT, U/L | 29.5 ± 2.5 | 38.6 ± 2.5 | 0.045 | ||||||||||||||||||||||||||||||||||||||||||||||||||||||||||||||||||||||||||||||||||||||||||||||||
| LDH, U/L | 244.4 ± 10.4 | 248.8 ± 5.8 | 0.703 | ||||||||||||||||||||||||||||||||||||||||||||||||||||||||||||||||||||||||||||||||||||||||||||||||
| TBiL, μmol/L | 8.4 ± 0.4 | 9.2 ± 0.3 | 0.116 | ||||||||||||||||||||||||||||||||||||||||||||||||||||||||||||||||||||||||||||||||||||||||||||||||
| Albumin, g/L | 40.8 ± 0.4 | 41.1 ± 0.3 | 0.537 | ||||||||||||||||||||||||||||||||||||||||||||||||||||||||||||||||||||||||||||||||||||||||||||||||
| Globulin, g/L | 28.8 ± 0.5 | 29.0 ± 0.3 | 0.693 | ||||||||||||||||||||||||||||||||||||||||||||||||||||||||||||||||||||||||||||||||||||||||||||||||
| Homocysteine, μmol/L | 10.7 ± 0.5 | 9.3 ± 0.2 | 0.006 | ||||||||||||||||||||||||||||||||||||||||||||||||||||||||||||||||||||||||||||||||||||||||||||||||
| Renal function test, mean ± SD | |||||||||||||||||||||||||||||||||||||||||||||||||||||||||||||||||||||||||||||||||||||||||||||||||||
| Urea, mmol/L | 5.1 ± 0.2 | 4.5 ± 0.1 | 0.011 | ||||||||||||||||||||||||||||||||||||||||||||||||||||||||||||||||||||||||||||||||||||||||||||||||
| Creatinine, μmol/L | 70.7 ± 3.0 | 63.0 ± 1.3 | 0.007 | ||||||||||||||||||||||||||||||||||||||||||||||||||||||||||||||||||||||||||||||||||||||||||||||||
| Serum cystatin C, mg/L | 1.0 ± 0.04 | 0.8 ± 0.01 | < 0.001 | ||||||||||||||||||||||||||||||||||||||||||||||||||||||||||||||||||||||||||||||||||||||||||||||||
| eGFR, ml/(min×1.73m2) | 101.3 ± 3.1 | 116.3 ± 1.9 | < 0.001 | ||||||||||||||||||||||||||||||||||||||||||||||||||||||||||||||||||||||||||||||||||||||||||||||||
| Lactic acid, mmol/L, mean ± SD | 2.8 ± 0.1 | 2.8 ± 0.04 | 0.936 | ||||||||||||||||||||||||||||||||||||||||||||||||||||||||||||||||||||||||||||||||||||||||||||||||
| Haptoglobin, mg/dl, mean ± SD | 209.2 ± 12.0 | 229.6 ± 7.0 | 0.142 | ||||||||||||||||||||||||||||||||||||||||||||||||||||||||||||||||||||||||||||||||||||||||||||||||
| Retinol-binding protein, mg/L, mean ± SD | 27.8 ± 1.4 | 26.4 ± 0.7 | 0.327 | ||||||||||||||||||||||||||||||||||||||||||||||||||||||||||||||||||||||||||||||||||||||||||||||||
| Cardiac markers, mean ± SD | |||||||||||||||||||||||||||||||||||||||||||||||||||||||||||||||||||||||||||||||||||||||||||||||||||
| cTnI, ng/ml | 0.029 ± 0.004 | 0.033 ± 0.003 | 0.455 | ||||||||||||||||||||||||||||||||||||||||||||||||||||||||||||||||||||||||||||||||||||||||||||||||
| Myoglobin, ng/ml | 17.5 ± 3.0 | 14.7 ± 2.9 | 0.59 | ||||||||||||||||||||||||||||||||||||||||||||||||||||||||||||||||||||||||||||||||||||||||||||||||
| Pro-BNP, pg/ml | 73.5 ± 13.7 | 67.6 ± 7.2 | 0.692 | ||||||||||||||||||||||||||||||||||||||||||||||||||||||||||||||||||||||||||||||||||||||||||||||||
| Coagulation function tests, mean ± SD | |||||||||||||||||||||||||||||||||||||||||||||||||||||||||||||||||||||||||||||||||||||||||||||||||||
| INR | 1.01 ± 0.008 | 1.02 ± 0.008 | 0.424 | ||||||||||||||||||||||||||||||||||||||||||||||||||||||||||||||||||||||||||||||||||||||||||||||||
| PTA | 99.9 ± 1.2 | 99.0 ± 0.8 | 0.579 | ||||||||||||||||||||||||||||||||||||||||||||||||||||||||||||||||||||||||||||||||||||||||||||||||
| Prothrombin time, second | 13.4 ± 0.08 | 13.5 ± 0.08 | 0.402 | ||||||||||||||||||||||||||||||||||||||||||||||||||||||||||||||||||||||||||||||||||||||||||||||||
| D-Dimer, μg/ml | 0.55 ± 0.06 | 0.77 ± 0.11 | 0.254 | ||||||||||||||||||||||||||||||||||||||||||||||||||||||||||||||||||||||||||||||||||||||||||||||||
| TCM, Traditional Chinese Medicine; WBC, white blood cells; RBC, red blood cells; CRP, C-reactive protein; ESR, erythrocyte sedimentation rate; ALT, alanine aminotransferase; AST, aspartate aminotransferase; GGT, gamma-glutamyl transferase; LDH, lactate dehydrogenase; TBiL, total bilirubin; eGFR, estimated glomerular filtration rate; cTnI, cardiac troponin; Pro-BNP, Brain natriuretic peptide prohormone; INR, international normalized ratio; PTA, prothrombin activity. | |||||||||||||||||||||||||||||||||||||||||||||||||||||||||||||||||||||||||||||||||||||||||||||||||||
Six inflammatory models were compared between imaging progression and progression-free patients. As shown in Figure 2, monocyte-lymphocyte ratio (MLR) levels were significantly higher in imaging progression patients than those in imaging progression-free ones (p < 0.001, Figure 2C), while no differences were found among aspartate aminotransferase-lymphocyte ratio index (ALRI), aspartate aminotransferase-platelet ratio index (APRI), neutrophil-lymphocyte ratio (NLR), platelet-lymphocyte ratio (PLR) and systemic immune-inflammation index (SII) between these two groups (Figure 2A, 2B, 2D–2F).
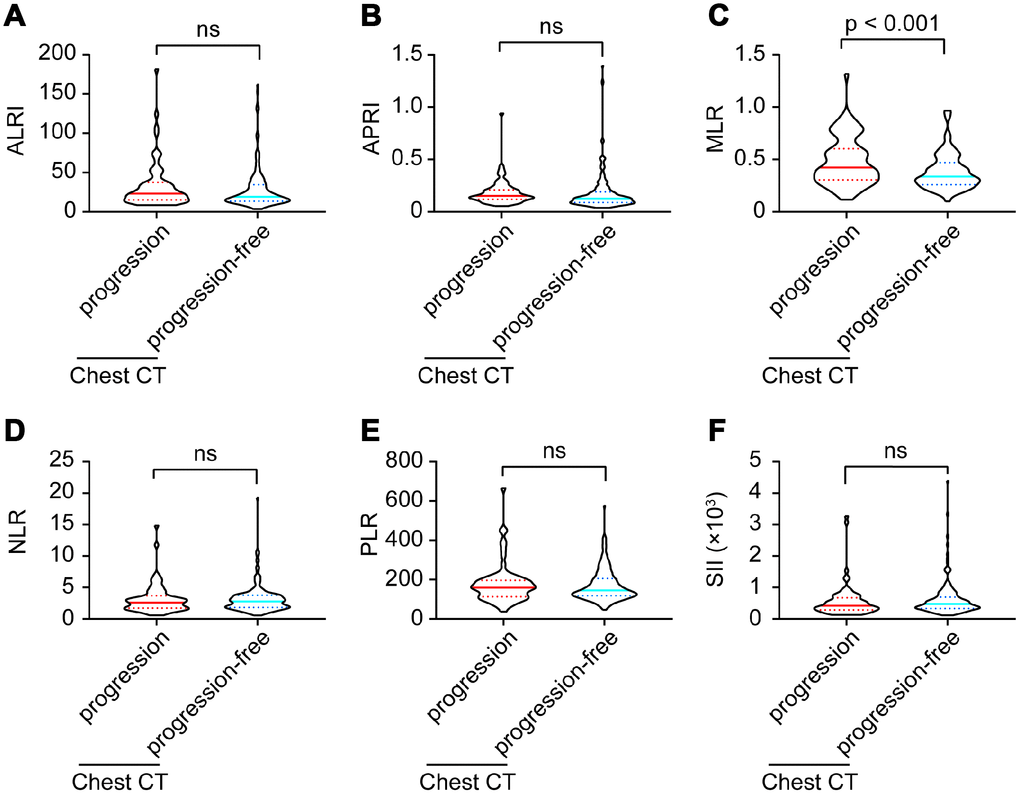
Figure 2. ALRI (A), APRI (B), MLR (C), NLR (D), PLR (E) and SII (F) model comparisons between imaging progression and progression-free COVID-19 patients.
Co-manifestations on chest CT and outcomes
As summarized in Table 2, except for common manifestations on chest CT, chronic inflammatory manifestation, chronic bronchitis / emphysema, pericardial effusion, pleural effusion, bullae of lung and obsolete tuberculosis were the most frequent imaging co-manifestations in COVID-19 patients. COVID-19 patients with imaging progression had significantly higher frequency of chronic inflammatory manifestation than those without imaging progression (12.7% vs. 3.5%, p = 0.005, Table 2). No differences were found in distributions of chronic bronchitis / emphysema, pericardial effusion, pleural effusion, bullae of lung and obsolete tuberculosis between these two groups (Table 2).
Table 2. Co-manifestations on chest CT in COVID-19 patients.
| Co-manifestations, n (%) | Chest CT | p value | |
| Progression group (n = 71) | Progression-free group (n = 202) | ||
| Chronic inflammatory manifestations | 9 (12.7) | 7 (3.5) | 0.005 |
| Chronic bronchitis / emphysema | 2 (2.8) | 2 (1.0) | 0.271 |
| Pericardial effusion | 1 (1.4) | 1 (0.5) | 0.438 |
| Pleural effusion | 1 (1.4) | 0 (0) | 0.091 |
| Bullae of lung | 1 (1.4) | 2 (1.0) | 0.771 |
| Obsolete tuberculosis | 2 (2.8) | 1 (0.5) | 0.107 |
Moreover, no acute bacterial or other viral co-infection performances on chest CT were found in these COVID-19 patients.
All these COVID-19 patients did not develop severe conditions, no one died during our follow up.
Parameters associated with imaging progression on chest CT
Variables including age, gender, disease history, epidemiology, chest CT imaging, therapeutic strategies, period from onset to admission, ALRI, APRI, MLR, NLR, PLR, SII, WBC, neutrophils, lymphocytes, monocytes, platelet, red blood cells (RBC), hemoglobin, C-reactive protein (CRP), erythrocyte sedimentation rate (ESR), procalcitonin, alanine aminotransferase (ALT), aspartate aminotransferase (AST), GGT, lactate dehydrogenase (LDH), total bilirubin (TBiL), albumin, globulin, urea, creatinine, eGFR, lactic acid, haptoglobin, acid glycoprotein, cystatin C, homocysteine, retinol-binding protein, cardiac troponin (cTnI), myoglobin, brain natriuretic peptide prohormone (pro-BNP), prothrombin time, prothrombin activity (PTA), international normalized ratio (INR), D-dimer were included in the univariate analysis. As presented in Table 3, age, gamma globulin therapy, thymosin therapy, MLR, serum cystatin C, homocysteine, eGFR and period from onset to admission were potential parameters associated with imaging progression (all p < 0.05, Table 3). When these parameters were included in the multivariate model, age, MLR and homocysteine were significantly correlated with imaging progression on chest CT from COVID-19 patients (RR = 2.28, 95%CI = 1.12 – 4.34, p = 0.012; RR = 7.69, 95%CI = 1.67 – 35.55, p = 0.009 and RR = 3.17, 95%CI = 1.01 – 9.96, p = 0.048; respectively, Table 3). In addition, COVID-19 patients with period from onset to admission ≥ 4 days might have lower risk to develop imaging progression on chest CT at first week after admission (RR = 0.35, 95%CI = 0.19 – 0.67, p = 0.001, Table 3).
Table 3. parameters associated with imaging progression in chest CT from COVID-19 patients#.
| Variables | Univariate | p value | Multivariate | p value | |||||||||||||||||||||||||||||||||||||||||||||||||||||||||||||||||||||||||||||||||||||||||||||||
| RR | 95%CI | RR | 95%CI | ||||||||||||||||||||||||||||||||||||||||||||||||||||||||||||||||||||||||||||||||||||||||||||||||
| Age, years | |||||||||||||||||||||||||||||||||||||||||||||||||||||||||||||||||||||||||||||||||||||||||||||||||||
| <60 | reference | - | 1.0 | reference | - | 1.0 | |||||||||||||||||||||||||||||||||||||||||||||||||||||||||||||||||||||||||||||||||||||||||||||
| ≥60 | 2.72 | 1.55-4.78 | < 0.001 | 2.28 | 1.12-4.34 | 0.012 | |||||||||||||||||||||||||||||||||||||||||||||||||||||||||||||||||||||||||||||||||||||||||||||
| Gamma globulin, yes vs. no | 2.44 | 1.12-5.32 | 0.025 | 1.08 | 0.38-3.08 | 0.89 | |||||||||||||||||||||||||||||||||||||||||||||||||||||||||||||||||||||||||||||||||||||||||||||
| Thymosin, yes vs. no | 3.05 | 1.55-6.0 | 0.001 | 2.32 | 0.94-5.73 | 0.069 | |||||||||||||||||||||||||||||||||||||||||||||||||||||||||||||||||||||||||||||||||||||||||||||
| MLR, per increase 1 unit | 12.2 | 3.09-48.23 | < 0.001 | 7.69 | 1.67-35.55 | 0.009 | |||||||||||||||||||||||||||||||||||||||||||||||||||||||||||||||||||||||||||||||||||||||||||||
| Serum cystatin C, mg/L | |||||||||||||||||||||||||||||||||||||||||||||||||||||||||||||||||||||||||||||||||||||||||||||||||||
| < 1.03 | reference | - | 1.0 | reference | - | 1.0 | |||||||||||||||||||||||||||||||||||||||||||||||||||||||||||||||||||||||||||||||||||||||||||||
| > 1.03 | 2.8 | 1.35-5.82 | 0.006 | 0.79 | 0.28-2.2 | 0.65 | |||||||||||||||||||||||||||||||||||||||||||||||||||||||||||||||||||||||||||||||||||||||||||||
| Homocysteine, μmol/L | |||||||||||||||||||||||||||||||||||||||||||||||||||||||||||||||||||||||||||||||||||||||||||||||||||
| < 15.4 | reference | - | 1.0 | reference | - | 1.0 | |||||||||||||||||||||||||||||||||||||||||||||||||||||||||||||||||||||||||||||||||||||||||||||
| > 15.4 | 3.54 | 1.23-10.14 | 0.019 | 3.17 | 1.01-9.96 | 0.048 | |||||||||||||||||||||||||||||||||||||||||||||||||||||||||||||||||||||||||||||||||||||||||||||
| eGFR, ml/(min×1.73m2) | |||||||||||||||||||||||||||||||||||||||||||||||||||||||||||||||||||||||||||||||||||||||||||||||||||
| > 90 | reference | - | 1.0 | reference | - | 1.0 | |||||||||||||||||||||||||||||||||||||||||||||||||||||||||||||||||||||||||||||||||||||||||||||
| < 90 | 2.97 | 1.54-5.75 | 0.001 | 1.63 | 0.67-4.0 | 0.281 | |||||||||||||||||||||||||||||||||||||||||||||||||||||||||||||||||||||||||||||||||||||||||||||
| Period from onset to admission, days | |||||||||||||||||||||||||||||||||||||||||||||||||||||||||||||||||||||||||||||||||||||||||||||||||||
| < 4 | reference | - | 1.0 | reference | - | 1.0 | |||||||||||||||||||||||||||||||||||||||||||||||||||||||||||||||||||||||||||||||||||||||||||||
| ≥ 4 | 0.36 | 0.20-0.64 | 0.001 | 0.35 | 0.19-0.67 | 0.001 | |||||||||||||||||||||||||||||||||||||||||||||||||||||||||||||||||||||||||||||||||||||||||||||
| Variables including age, gender, disease history, epidemiology, chronic inflammatory co-manifestation on chest CT, therapeutic strategies, period from onset to admission, ALRI, APRI, MLR, NLR, PLR, SII, WBC, neutrophils, lymphocytes, monocytes, platelet, RBC, hemoglobin, CRP, ESR, procalcitonin, ALT, AST, GGT, LDH, TBiL, albumin, globulin, urea, creatinine, eGFR, lactic acid, haptoglobin, acid glycoprotein, cystatin C, homocysteine, retinol-binding protein, cTnI, myoglobin, pro-BNP, prothrombin time, PTA, INR, D-dimer were included in the univariate analysis. Only variables with p < 0.05 in univariate model were included in the multivariate analysis. # Only variables significantly associated with imaging progression in chest CT in univariate analysis were presented. | |||||||||||||||||||||||||||||||||||||||||||||||||||||||||||||||||||||||||||||||||||||||||||||||||||
Predictive values of MLR and age for imaging progression on chest CT
Using OptimalCutpoints package in R program, we detected that the optimal cutoff of MLR was 0.51. The sensitivity, specificity, positive predictive value (PPV) and negative predictive value (NPV) of MLR for predicting imaging progression on chest CT were 0.44, 0.79, 0.42 and 0.80, respectively (Figure 3A and Table 4). And, the AUC of MLR for predicting imaging progression on chest CT was 0.63 (Figure 3A).
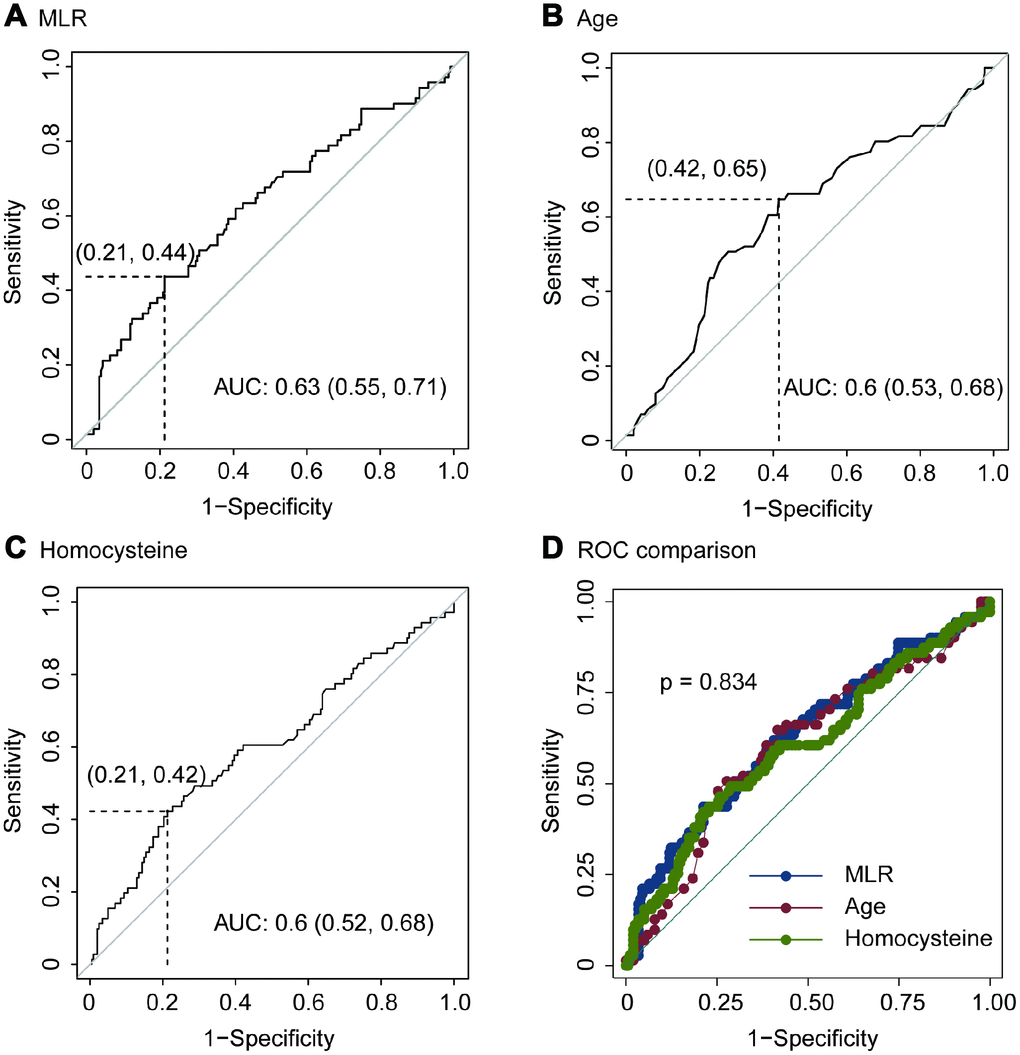
Figure 3. ROC of MLR (A), age (B), homocysteine (C) and ROC comparison (D) for imaging progression in chest CT from COVID-19 patients.
Table 4. Predictive values of MLR model, age and homocysteine for imaging progression on chest CT from COVID-19 patients.
| Estimate | 95%CI | |
| MLR | ||
| Cutoff | 0.51 | - |
| Sensitivity | 0.44 | 0.32 – 0.56 |
| Specificity | 0.79 | 0.72 – 0.84 |
| Positive predictive value | 0.42 | 0.34 – 0.54 |
| Negative predictive value | 0.80 | 0.71 – 0.85 |
| Age, years | ||
| Cutoff | 51 | - |
| Sensitivity | 0.65 | 0.53 – 0.76 |
| Specificity | 0.58 | 0.51 – 0.65 |
| Positive predictive value | 0.35 | 0.29 – 0.48 |
| Negative predictive value | 0.83 | 0.74 – 0.86 |
| Homocysteine, μmol/L | ||
| Cut off | 10.58 | |
| Sensitivity | 0.42 | 0.31 – 0.55 |
| Specificity | 0.79 | 0.72 – 0.84 |
| Positive predictive value | 0.41 | 0.33 – 0.53 |
| Negative predictive value | 0.80 | 0.70 – 0.85 |
The optimal cutoff of age for predicting imaging progression on chest CT was 51 years. The sensitivity, specificity, PPV and NPV were 0.65, 0.58, 0.35 and 0.83 respectively (Figure 3B and Table 4). ROC curve revealed that the AUC of age in the prediction model was 0.6 (Figure 3B).
In addition, the optimal cutoff of homocysteine for predicting imaging progression on chest CT from COVID-19 patients was 10.58 μmol/L. The sensitivity, specificity, PPV and NPV were 0.42, 0.79, 0.41 and 0.80, respectively (Figure 3C and Table 4).
We performed ROC comparison in MLR, age and homocysteine using ROC regression. As showed in Figure 3D, no difference among these three indexes was found (p = 0.834, Figure 3D).
Discussion
According to the Chinese guidelines, imaging progression-free on chest CT scans was one of discharge criteria for COVID-19 patients. At present stage, the long-term imaging features of COVID-19 are not yet known [13, 15]. Follow-up imaging in COVID-19 patients often demonstrated the disease progression. Generally, imaging manifestations are in line with the severity of COVID-19 [16]. Hence, a short-term follow up with identification of imaging progression is of great importance for early warning of disease aggravation from COVID-19 patients, which could help clinicians to manage quickly and accurately [12]. Considered that, we defined the imaging progression at first week on chest CT as the primary outcome.
In this outbreak, age was considered as one critical content during the disease occurrence and development. Our results also revealed that the average age of patients with imaging progression was older than those without. Logistic model confirmed that age should be a risk factor for predicting imaging progression. Previous reports suggested that COVID-19 is more susceptible to infect older adults [3, 8, 10]. Research with small samples of 2019-nCoV infected infants have been reported [17]. In a study included 34 COVID-19 children, the authors concluded that the clinical manifestations in children with 2019-nCoV infection are non-specific and are milder than that in adults [18]. In a nationwide retrospective study, 2143 pediatric patients were included. They found that more than 90% patients were asymptomatic, mild, or moderate, even though young children, particularly infants, were vulnerable to infection [19]. The first deaths of COVID-19 occurred frequently among elderly people, who may progress more faster [20]. In a multicenter cohort study with 137 patients enrolled, age was shown to be associated with high risk of death in COVID-19 patients. Middle-aged and elderly patients with underlying comorbidities are prone to respiratory failure and have a poorer prognosis [21, 22]. Combined the previous literatures and our results, we assumed that age also should be a risk factor for imaging progression at the early stage of COVID-19.
Among the six inflammatory models, MLR was significantly higher in COVID-19 patients with imaging progression on chest CT scans, and correlated with imaging aggravation. Previous evidence demonstrated that monocytes/macrophages were susceptible to human coronavirus (HCoV) 229E infection, but strongly restricted OC43 replication [23]. Differs from HCoV-229E, SARS-CoV poorly infects human purified monocytes/macrophages, and production of interferon-alpha by these cells further limits the infection [24]. Following infection of monocytes/macrophages by HCoV-OC43, viability remained high over 6 days and no apoptosis was observed [25]. These clues suggested that monocytes might be stable in function and quantity levels during HCoV infection like SARS and 2019-CoV. Conversely, SARS-CoV frequently targets for cytotoxic T lymphocytes [26, 27]. Lymphopenia is one of hematological abnormalities during SARS-CoV infection, and lymphocyte counts could predict the severity and clinical outcomes [28]. Previous study showed that lymphocytes and its subsets significantly decreased in SARS patients, while those with severe clinical illness or those who died had more remarkable CD4+ and CD8+ lymphopenia [28]. Also, MERS-CoV could efficiently infected T lymphocytes from the peripheral blood and from human lymphoid organs and induced apoptosis in T lymphocytes [29]. Similar with SARS-CoV and MERS-CoV, 2019-nCoV infection also related with loss of lymphocytes, which was supported by Chinese guidelines [30, 31]. Thus, the MLR increased especially in patients with disease progression.
Homocysteine is a potent toxic agent that involved in oxidative stress and neurotoxicity promotion, endothelial dysfunction, and acceleration of the atherosclerotic process [32–34]. Emerging evidences revealed that hyperhomocysteinemia contributed to a spectrum of disease development, including cardiovascular disease, diabetes, chronic kidney disease and fatty liver disease [35–37]. Previous reports uncovered that homocysteine concentrations were greater in many virus infections including human immunodeficiency virus, hepatitis virus and human papilloma virus [38–40]. However, the roles of homocysteine in coronavirus infection have not been well illustrated. Based on our results, homocysteine concentrated in imaging progression patients and showed predictive value for imaging progression.
Our results also demonstrated that COVID-19 patients with period from onset to admission ≥ 4 days had lower risk to develop imaging progression on chest CT at first week after admission. On the one hand, patients with period over 4 days might have mild clinical symptoms, which in line with mild or slow progression of this disease. On the other hand, the period from onset to admission should be counted in the natural process of 2019-nCoV infection.
This study has some limitations. First, only mild type of COVID-19 patients was included, and severe type and life-threating types were excluded in this analysis. Second, MLR and age did not have powerful prognostic values for imaging progression on chest CT in our study. Therefore, we suggest that they be used in combination in clinical practice. Third, the follow-up period was short-term, more solid outcomes should be considered in future. And, subgroup analysis of category manifestation of imaging progression on chest CT should also be considered. Even though, age, MLR model, homocysteine and period from onset to admission might be useful for evaluating disease progression in COVID-19 patients.
Materials and Methods
Ethic statement
All participants provided written informed consent during their admission. The study protocol and informed consent documents were reviewed and approved by the Ethics Committee of Shanghai Public Health Clinical Center, Fudan University.
Patients
In accordance to the 4th edition of “Diagnosis and management program of novel coronavirus-infected pneumonia” released by National Health Commission of The People’s Republic of China [30], 273 diagnosed COVID-19 patients with mild category in Shanghai Public Health Clinical Center were included in this analysis. 2019 novel coronavirus (2019-nCoV) nucleic acid of sputum samples from all participants were positive detected by real-time polymerase chain reaction. The influenza A and B antigens of all participants were negative. All participants had no other lymphatic system disorders or malignant hematologic diseases, ensuring that the whole blood parameters were representative of normal baseline values. Patients with renal and/or hepatic failure, acute coronary syndromes, valvular heart diseases, autoimmune thyroid diseases, or systematic inflammatory diseases were excluded from our study.
Study design
This was a prospective single-center cohort study. The baseline characteristics, including demographics, treatment strategies, routine blood tests, liver-kidney function parameters, coagulation function tests, cardiac markers and chest CT imaging, were all collected at the first admission day. Chest CT imaging were also performed at the (7 ± 2) day during their admission. All the tests and examines were conducted in the Department of Medical Laboratory and the Department of Radiology in Shanghai Public Health Clinical Center, Fudan University.
Definition
The primary outcome was defined as imaging progression on chest CT at first week. Any one of the following criteria was considered as imaging progression on chest CT: 1) Increased ground-glass lesions in the underlying involvements; 2) Newly occurred lesions beyond underlying involvements. The chest CT imaging performance was diagnosed by two radiologists independently and inconsistency was discussed and determined by the director of Department of Radiology who acted as an arbiter.
Six inflammatory models, including ALRI, APRI, MLR, NLR, PLR and SII were included in this analysis. The definitions of these models are as follows: ALRI = AST / L; APRI = AST / P; MLR = M / L; NLR = N / L; PLR = P / L; and SII = P × N / L, where M, L, N and P are the peripheral monocyte, lymphocyte, neutrophil and platelet counts, respectively.
Statistical analysis
Differences of variables between the individual groups were analyzed using student t test and Chi-square test based on variables types. Parameters associated with the outcome were assessed by univariate and multivariate logistic regression. Only variables significantly associated with the outcome at univariate analysis (two-sided p < 0.05) included in the multivariate model. Results were reported as risk ratios (RR) with 95% confidence intervals (CI). OptimalCutpoints package [41] in R program was used to perform ROC analysis to evaluate predictive values of potential factors for the outcome. Stata software version 16.0 (Stata Corp LLC, Texas, USA) was used for other statistics. A two-tailed p < 0.05 were considered significant for all tests.
Conflicts of Interest
The authors have declared that no Conflicts of interest exist.
Funding
This work was mainly supported by National Science and Technology Major Program (2017ZX10305501) and Grants from Shanghai Municipal Health Commission (2020NCP001 and 2018LQ014). All the sponsors or funders play no roles in the study design, data collection and analysis, decision to publish, or preparation of the manuscript.
References
- 1. Chan JF, Yuan S, Kok KH, To KK, Chu H, Yang J, Xing F, Liu J, Yip CC, Poon RW, Tsoi HW, Lo SK, Chan KH, et al. A familial cluster of pneumonia associated with the 2019 novel coronavirus indicating person-to-person transmission: a study of a family cluster. Lancet. 2020; 395:514–23. https://doi.org/10.1016/S0140-6736(20)30154-9 [PubMed]
- 2. Cheng ZJ, Shan J. 2019 Novel coronavirus: where we are and what we know. Infection. 2020; 48:155–163. https://doi.org/10.1007/s15010-020-01401-y [PubMed]
- 3. Li Q, Guan X, Wu P, Wang X, Zhou L, Tong Y, Ren R, Leung KS, Lau EH, Wong JY, Xing X, Xiang N, Wu Y, et al. Early Transmission Dynamics in Wuhan, China, of Novel Coronavirus-Infected Pneumonia. N Engl J Med. 2020; 382:1199–207. https://doi.org/10.1056/NEJMoa2001316 [PubMed]
- 4. Phan LT, Nguyen TV, Luong QC, Nguyen TV, Nguyen HT, Le HQ, Nguyen TT, Cao TM, Pham QD. Importation and Human-to-Human Transmission of a Novel Coronavirus in Vietnam. N Engl J Med. 2020; 382:872–74. https://doi.org/10.1056/NEJMc2001272 [PubMed]
- 5. Zhu N, Zhang D, Wang W, Li X, Yang B, Song J, Zhao X, Huang B, Shi W, Lu R, Niu P, Zhan F, Ma X, et al, and China Novel Coronavirus Investigating and Research Team. A Novel Coronavirus from Patients with Pneumonia in China, 2019. N Engl J Med. 2020; 382:727–33. https://doi.org/10.1056/NEJMoa2001017 [PubMed]
- 6. She J, Jiang J, Ye L, Hu L, Bai C, Song Y. 2019 novel coronavirus of pneumonia in Wuhan, China: emerging attack and management strategies. Clin Transl Med. 2020; 9:19. https://doi.org/10.1186/s40169-020-00271-z [PubMed]
- 7. Liu Y, Gayle AA, Wilder-Smith A, Rocklöv J. The reproductive number of COVID-19 is higher compared to SARS coronavirus. J Travel Med. 2020; 27:taaa021. https://doi.org/10.1093/jtm/taaa021 [PubMed]
- 8. Chen N, Zhou M, Dong X, Qu J, Gong F, Han Y, Qiu Y, Wang J, Liu Y, Wei Y, Xia J, Yu T, Zhang X, Zhang L. Epidemiological and clinical characteristics of 99 cases of 2019 novel coronavirus pneumonia in Wuhan, China: a descriptive study. Lancet. 2020; 395:507–13. https://doi.org/10.1016/S0140-6736(20)30211-7 [PubMed]
- 9. Novel Coronavirus Pneumonia Emergency Response Epidemiology Team. [The epidemiological characteristics of an outbreak of 2019 novel coronavirus diseases (COVID-19) in China]. Zhonghua Liu Xing Bing Xue Za Zhi. 2020; 41:145–151. https://doi.org/10.3760/cma.j.issn.0254-6450.2020.02.003 [PubMed]
- 10. Wang D, Hu B, Hu C, Zhu F, Liu X, Zhang J, Wang B, Xiang H, Cheng Z, Xiong Y, Zhao Y, Li Y, Wang X, Peng Z. Clinical Characteristics of 138 Hospitalized Patients With 2019 Novel Coronavirus-Infected Pneumonia in Wuhan, China. JAMA. 2020. [Epub ahead of print]. https://doi.org/10.1001/jama.2020.1585 [PubMed]
- 11. Bernheim A, Mei X, Huang M, Yang Y, Fayad ZA, Zhang N, Diao K, Lin B, Zhu X, Li K, Li S, Shan H, Jacobi A, Chung M. Chest CT Findings in Coronavirus Disease-19 (COVID-19): Relationship to Duration of Infection. Radiology. 2020; [Epub ahead of print]. https://doi.org/10.1148/radiol.2020200463 [PubMed]
- 12. Pan Y, Guan H, Zhou S, Wang Y, Li Q, Zhu T, Hu Q, Xia L. Initial CT findings and temporal changes in patients with the novel coronavirus pneumonia (2019-nCoV): a study of 63 patients in Wuhan, China. Eur Radiol. 2020. [Epub ahead of print]. https://doi.org/10.1007/s00330-020-06731-x [PubMed]
- 13. Kim H. Outbreak of novel coronavirus (COVID-19): what is the role of radiologists? Eur Radiol. 2020. [Epub ahead of print]. https://doi.org/10.1007/s00330-020-06748-2 [PubMed]
- 14. Pan F, Ye T, Sun P, Gui S, Liang B, Li L, Zheng D, Wang J, Hesketh RL, Yang L, Zheng C. Time Course of Lung Changes On Chest CT During Recovery From 2019 Novel Coronavirus (COVID-19) Pneumonia. Radiology. 2020. [Epub ahead of print]. https://doi.org/10.1148/radiol.2020200370 [PubMed]
- 15. Kanne JP, Chest CT. Chest CT Findings in 2019 Novel Coronavirus (2019-nCoV) Infections from Wuhan, China: Key Points for the Radiologist. Radiology. 2020; 295:16–17. https://doi.org/10.1148/radiol.2020200241 [PubMed]
- 16. Chung M, Bernheim A, Mei X, Zhang N, Huang M, Zeng X, Cui J, Xu W, Yang Y, Fayad ZA, Jacobi A, Li K, Li S, Shan H. CT Imaging Features of 2019 Novel Coronavirus (2019-nCoV). Radiology. 2020; 295:202–07. https://doi.org/10.1148/radiol.2020200230 [PubMed]
- 17. Wei M, Yuan J, Liu Y, Fu T, Yu X, Zhang ZJ. Novel Coronavirus Infection in Hospitalized Infants Under 1 Year of Age in China. JAMA. 2020. [Epub ahead of print]. https://doi.org/10.1001/jama.2020.2131 [PubMed]
- 18. Wang XF, Yuan J, Zheng YJ, Chen J, Bao YM, Wang YR, Wang LF, Li H, Zeng JX, Zhang YH, Liu YX, Liu L. [Retracted: clinical and epidemiological characteristics of 34 children with 2019 novel coronavirus infection in Shenzhen]. Zhonghua Er Ke Za Zhi. 2020; 58:E008. https://doi.org/10.3760/cma.j.issn.0578-1310.2020.0008 [PubMed]
- 19. Dong Y, Mo X, Hu Y, Qi X, Jiang F, Jiang Z, Tong S. Epidemiological Characteristics of 2143 Pediatric Patients With 2019 Coronavirus Disease in China. Pediatrics. 2020. [Epub ahead of print]. https://doi.org/10.1542/peds.2020-0702 [PubMed]
- 20. Wang W, Tang J, Wei F. Updated understanding of the outbreak of 2019 novel coronavirus (2019-nCoV) in Wuhan, China. J Med Virol. 2020; 92:441–47. https://doi.org/10.1002/jmv.25689 [PubMed]
- 21. Liu K, Fang YY, Deng Y, Liu W, Wang MF, Ma JP, Xiao W, Wang YN, Zhong MH, Li CH, Li GC, Liu HG. Clinical characteristics of novel coronavirus cases in tertiary hospitals in Hubei Province. Chin Med J (Engl). 2020. [Epub ahead of print]. https://doi.org/10.1097/CM9.0000000000000744 [PubMed]
- 22. Zhou L, Liu HG. [Early detection and disease assessment of patients with novel coronavirus pneumonia]. Zhonghua Jie He He Hu Xi Za Zhi. 2020; 43:E003. https://doi.org/10.3760/cma.j.issn.1001-0939.2020.0003 [PubMed]
- 23. Desforges M, Miletti TC, Gagnon M, Talbot PJ. Activation of human monocytes after infection by human coronavirus 229E. Virus Res. 2007; 130:228–40. https://doi.org/10.1016/j.virusres.2007.06.016 [PubMed]
- 24. Yilla M, Harcourt BH, Hickman CJ, McGrew M, Tamin A, Goldsmith CS, Bellini WJ, Anderson LJ. SARS-coronavirus replication in human peripheral monocytes/macrophages. Virus Res. 2005; 107:93–101. https://doi.org/10.1016/j.virusres.2004.09.004 [PubMed]
- 25. Collins AR. In vitro detection of apoptosis in monocytes/macrophages infected with human coronavirus. Clin Diagn Lab Immunol. 2002; 9:1392–95. https://doi.org/10.1128/cdli.9.6.1392-1395.2002 [PubMed]
- 26. Kohyama S, Ohno S, Suda T, Taneichi M, Yokoyama S, Mori M, Kobayashi A, Hayashi H, Uchida T, Matsui M. Efficient induction of cytotoxic T lymphocytes specific for severe acute respiratory syndrome (SARS)-associated coronavirus by immunization with surface-linked liposomal peptides derived from a non-structural polyprotein 1a. Antiviral Res. 2009; 84:168–77. https://doi.org/10.1016/j.antiviral.2009.09.004 [PubMed]
- 27. Ohno S, Kohyama S, Taneichi M, Moriya O, Hayashi H, Oda H, Mori M, Kobayashi A, Akatsuka T, Uchida T, Matsui M. Synthetic peptides coupled to the surface of liposomes effectively induce SARS coronavirus-specific cytotoxic T lymphocytes and viral clearance in HLA-A*0201 transgenic mice. Vaccine. 2009; 27:3912–20. https://doi.org/10.1016/j.vaccine.2009.04.001 [PubMed]
- 28. He Z, Zhao C, Dong Q, Zhuang H, Song S, Peng G, Dwyer DE. Effects of severe acute respiratory syndrome (SARS) coronavirus infection on peripheral blood lymphocytes and their subsets. Int J Infect Dis. 2005; 9:323–30. https://doi.org/10.1016/j.ijid.2004.07.014 [PubMed]
- 29. Chu H, Zhou J, Wong BH, Li C, Chan JF, Cheng ZS, Yang D, Wang D, Lee AC, Li C, Yeung ML, Cai JP, Chan IH, et al. Middle East Respiratory Syndrome Coronavirus Efficiently Infects Human Primary T Lymphocytes and Activates the Extrinsic and Intrinsic Apoptosis Pathways. J Infect Dis. 2016; 213:904–14. https://doi.org/10.1093/infdis/jiv380 [PubMed]
- 30. National Health Commission of the People’s Republic of China. Diagnosis and management program of novel coronavirus-infected pneumonia (4th edition). 2020. http://www.gov.cn/zhengce/zhengceku/2020-2001/2028/5472673/files/5472670f5472696c5472610cc5472609d5472674d5472636a5472676f5472679a5472679f5472670b5472642d5472972b.pdf.
- 31. National Health Commission of the People’s Republic of China. Diagnosis and management program of novel coronavirus pneumonia (6th edition). 2020. http://www.nhc.gov.cn/yzygj/s7653p/202002/208334a208326dd202094d202329df202351d202007da202008aefc202002/files/b202218cfeb202001bc254639af202227f202922bf202006b202817.pdf.
- 32. Guo YH, Chen FY, Wang GS, Chen L, Gao W. Diet-induced hyperhomocysteinemia exacerbates vascular reverse remodeling of balloon-injured arteries in rat. Chin Med J (Engl). 2008; 121:2265–71. https://doi.org/10.1097/00029330-200811020-00011 [PubMed]
- 33. Hofmann MA, Lalla E, Lu Y, Gleason MR, Wolf BM, Tanji N, Ferran LJ
Jr , Kohl B, Rao V, Kisiel W, Stern DM, Schmidt AM. Hyperhomocysteinemia enhances vascular inflammation and accelerates atherosclerosis in a murine model. J Clin Invest. 2001; 107:675–83. https://doi.org/10.1172/JCI10588 [PubMed] - 34. Jakubowski H. Pathophysiological consequences of homocysteine excess. J Nutr. 2006 (6 Suppl); 136:1741S–49S. https://doi.org/10.1093/jn/136.6.1741S [PubMed]
- 35. Deminice R, da Silva RP, Lamarre SG, Brown C, Furey GN, McCarter SA, Jordao AA, Kelly KB, King-Jones K, Jacobs RL, Brosnan ME, Brosnan JT. Creatine supplementation prevents the accumulation of fat in the livers of rats fed a high-fat diet. J Nutr. 2011; 141:1799–804. https://doi.org/10.3945/jn.111.144857 [PubMed]
- 36. Triant VA, Lee H, Hadigan C, Grinspoon SK. Increased acute myocardial infarction rates and cardiovascular risk factors among patients with human immunodeficiency virus disease. J Clin Endocrinol Metab. 2007; 92:2506–12. https://doi.org/10.1210/jc.2006-2190 [PubMed]
- 37. Wijekoon EP, Brosnan ME, Brosnan JT. Homocysteine metabolism in diabetes. Biochem Soc Trans. 2007; 35:1175–79. https://doi.org/10.1042/BST0351175 [PubMed]
- 38. Abike F, Engin AB, Dunder I, Tapisiz OL, Aslan C, Kutluay L. Human papilloma virus persistence and neopterin, folate and homocysteine levels in cervical dysplasias. Arch Gynecol Obstet. 2011; 284:209–14. https://doi.org/10.1007/s00404-010-1650-7 [PubMed]
- 39. Deminice R, Silva TC, de Oliveira VH. Elevated homocysteine levels in human immunodeficiency virus-infected patients under antiretroviral therapy: A meta-analysis. World J Virol. 2015; 4:147–55. https://doi.org/10.5501/wjv.v4.i2.147 [PubMed]
- 40. Roblin X, Pofelski J, Zarski JP. [Steatosis, chronic hepatitis virus C infection and homocysteine]. Gastroenterol Clin Biol. 2007; 31:415–20. https://doi.org/10.1016/S0399-8320(07)89402-4 [PubMed]
- 41. Lopez-Raton M, Rodriguez-Alvarez MX, Suarez CC, Sampedro FG. OptimalCutpoints: An R Package for Selecting Optimal Cutpoints in Diagnostic Tests. J Stat Softw. 2014; 61:1–36. https://doi.org/10.18637/jss.v061.i08