


Introduction
Metabolic syndrome (MetS) is a group of metabolic conditions that occur together and promote the development of cardiovascular disease and diabetes [1]. Moreover, MetS and its components are associated with cancers, such as colorectal cancer [2], prostate cancer [3], and primary liver cancer [4]. In parallel with changes towards a sedentary lifestyle and subsequent obesity worldwide, the prevalence of MetS has increased in recent decades. A previous study demonstrated that the prevalence of MetS in the United States (US) has increased from 32.9% in 2003-2004 to 34.7% in 2010-2012 [5]. Thus, considering the increasing burden of MetS, it is important to identify modifiable risk factors of MetS.
Handgrip strength is a simple and reliable measurement method, especially a good measurement of upper body strength, which is realized as an index for muscular fitness [6, 7]. And a strong evidence suggests that in addition to obesity, low level of fitness is a major contributor to a development of metabolic disease and metabolic syndrome [8, 9]. Furthermore, muscle strengthening activities are closely related with improved insulin sensitivity, meliorated dyslipidemia, and reduced blood pressure, all of those are principle components of metabolic syndrome [10–12]. In addition, skeletal muscle can secrete multiple peptides [13]. Many of these peptides contribute to metabolic homeostasis [14, 15]. Interleukin-15 from skeletal muscle negatively regulates fat mass [16]. Inhibition of myostatin suppresses body fat accumulation and improves insulin sensitivity [17, 18]. These myokines appear to participated in maintenance of whole-body metabolic homeostasis. Muscles are target organs for insulin action [19]. Moreover, insulin resistance is a hallmark of MetS [20]. Muscles also secrete irisin [21] which could be a therapeutic tool in managing obesity and MetS [22]. Thus, it is plausible that muscle strength could play an important role in the development of MetS. Indeed, several previous studies found that high muscle strength was associated with lower prevalence of MetS [23–30]. Most of these studies were conducted in Asian countries. In the US, only the Aerobics Center Longitudinal Study demonstrated that lower muscle strength was associated with higher MetS prevalence in men [30]. Moreover, compared to participants with higher muscle strength, the odds ratios (ORs) were 2.20 (95% confidence interval (CI), 1.89-2.54) and 2.11 (95% CI, 1.62-2.74) for male participants aged <50 years and ≥50 years with lower muscle strength, respectively [30]. However, the Aerobics Center Longitudinal Study used the supine bench press and seated leg press to assess muscle strength [30] instead of handgrip strength, which is easier to use in both clinical and community settings [31]. Moreover, most of the previous studies were conducted in middle-aged and older participants or in men alone, which would limit the generalization of their findings. Studies have shown that BMI increased with the prevalence of MetS [32]. BMI can be a factor differentiating the course of many metabolic and adaptive processes in the body [33–36]. It can also be a factor conditioning a different response of the body to certain lifestyle elements that modifiers of metabolic risk factors [37]. We therefore accept the hypothesis that individuals with a different BMI also have a different response to the relationship between muscle strength and MetS.
To the best of our knowledge, no epidemiological study has investigated the associations between handgrip strength and MetS in general US adults and considering BMI as a stratification factor. Thus, we used data from 2011-2012 and 2013-2014 survey cycles of the National Health and Nutrition Examination Survey (NHANES) to determine the associations between handgrip strength and MetS and identify cut-off points of handgrip strength associated with MetS in general US adults. In order to help individuals to identify the risk of MetS as quick as possible.
Results
Characteristics of participants
According to the data from NHANES 2011-2012 and 2013-2014 cycles, 19 931 people joined the household questionnaire interview, and 14 984 people participated in the handgrip strength test. Because of the design of NHANES, subsampling was required to reduce respondent burden and facilitate the scheduling and completion of examinations, the final analysed sample comprised 5 056 participants, of which 36.33% had MetS. The prevalence of MetS in men was 36.35% and that in women was 36.30% (P=0.9796). Baseline characteristics of the participants are shown in Table 1. With the increase in relative handgrip strength, age, BMI, waist circumference, triglyceride, fasting glucose, SBP, and the prevalence of MetS were decreased, and the proportion of male participants, DBP, tobacco and alcohol use, proportion of college graduation, percentage of >$100 000 annual household income, energy intake per day, and proportion of high physical activity were increased.
Table 1. Participants characteristics according to categories of adjusted handgrip.
| Tertiles of handgrip strength per weight (kg/kg) (Range) | P for trend* | ||||||||||||||||||||||||||||||||||||||||||||||||||||||||||||||||||||||||||||||||||||||||||||||||||
| Level 1 (0.11, 0.41) | Level 2 (0.41, 0.53) | Level 3 (0.53, 1.13) | |||||||||||||||||||||||||||||||||||||||||||||||||||||||||||||||||||||||||||||||||||||||||||||||||
| No. of participants (%) | 33.32 | 33.56 | 33.12 | ||||||||||||||||||||||||||||||||||||||||||||||||||||||||||||||||||||||||||||||||||||||||||||||||
| Age (year) | 49.92 (49.01, 50.84) | 41.47 (40.56, 42.38) | 35.29 (34.38, 36.20) | <0.0001 | |||||||||||||||||||||||||||||||||||||||||||||||||||||||||||||||||||||||||||||||||||||||||||||||
| Male (%) | 21.31 | 47.69 | 80.69 | <0.0001 | |||||||||||||||||||||||||||||||||||||||||||||||||||||||||||||||||||||||||||||||||||||||||||||||
| BMI (kg/m2) | 33.41 (33.15, 33.67) | 26.51 (26.24, 26.77) | 23.79 (23.53, 24.06) | <0.0001 | |||||||||||||||||||||||||||||||||||||||||||||||||||||||||||||||||||||||||||||||||||||||||||||||
| Waist circumference (cm) | 108.28(107.60, 108.96) | 93.00 (92.32, 93.68) | 85.16 (84.48, 85.84) | <0.0001 | |||||||||||||||||||||||||||||||||||||||||||||||||||||||||||||||||||||||||||||||||||||||||||||||
| Triglyceride (mg/dL) | 125.16 (120.18, 130.13) | 116.84 (111.870, 121.82) | 104.59 (99.63, 109.56) | <0.001 | |||||||||||||||||||||||||||||||||||||||||||||||||||||||||||||||||||||||||||||||||||||||||||||||
| HDL cholesterol (mg/dL) | 52.46 (51.76, 53.15) | 53.76 (53.07. 54.46) | 53.62 (52.93 54.32) | 0.0204 | |||||||||||||||||||||||||||||||||||||||||||||||||||||||||||||||||||||||||||||||||||||||||||||||
| Fasting glucose (mg/dL) | 112.39 (110.98, 113.81) | 102.80 (101.38, 104.22) | 99.40 (97.99, 100.82) | <0.0001 | |||||||||||||||||||||||||||||||||||||||||||||||||||||||||||||||||||||||||||||||||||||||||||||||
| SBP (mm Hg) | 123.43 (122.64, 124.22) | 118.79 (118.00, 119.59) | 117.28 (116.49,118.07) | <0.0001 | |||||||||||||||||||||||||||||||||||||||||||||||||||||||||||||||||||||||||||||||||||||||||||||||
| DBP (mm Hg) | 67.32 (66.70, 67.94) | 67.07 (66.45, 67.69) | 67.18 (66.57, 67.80) | 0.7609 | |||||||||||||||||||||||||||||||||||||||||||||||||||||||||||||||||||||||||||||||||||||||||||||||
| Metabolic syndrome (%) | 59.35 | 33.48 | 16.06 | <0.0001 | |||||||||||||||||||||||||||||||||||||||||||||||||||||||||||||||||||||||||||||||||||||||||||||||
| Smoke | |||||||||||||||||||||||||||||||||||||||||||||||||||||||||||||||||||||||||||||||||||||||||||||||||||
| Every day (%) | 34.21 | 31.63 | 47.26 | <0.0001 | |||||||||||||||||||||||||||||||||||||||||||||||||||||||||||||||||||||||||||||||||||||||||||||||
| Somedays (%) | 6.12 | 8.83 | 8.81 | ||||||||||||||||||||||||||||||||||||||||||||||||||||||||||||||||||||||||||||||||||||||||||||||||
| Never (%) | 59.67 | 59.54 | 43.93 | ||||||||||||||||||||||||||||||||||||||||||||||||||||||||||||||||||||||||||||||||||||||||||||||||
| Drink | |||||||||||||||||||||||||||||||||||||||||||||||||||||||||||||||||||||||||||||||||||||||||||||||||||
| Yes (%) | 70.37 | 80.97 | 85.55 | <0.0001 | |||||||||||||||||||||||||||||||||||||||||||||||||||||||||||||||||||||||||||||||||||||||||||||||
| No (%) | 29.63 | 19.03 | 14.45 | ||||||||||||||||||||||||||||||||||||||||||||||||||||||||||||||||||||||||||||||||||||||||||||||||
| Education | |||||||||||||||||||||||||||||||||||||||||||||||||||||||||||||||||||||||||||||||||||||||||||||||||||
| ≤High school (%) | 43.95 | 42.74 | 46.80 | 0.0971 | |||||||||||||||||||||||||||||||||||||||||||||||||||||||||||||||||||||||||||||||||||||||||||||||
| ≥College (%) | 56.05 | 52.26 | 53.20 | ||||||||||||||||||||||||||||||||||||||||||||||||||||||||||||||||||||||||||||||||||||||||||||||||
| Annual household income (%) | |||||||||||||||||||||||||||||||||||||||||||||||||||||||||||||||||||||||||||||||||||||||||||||||||||
| Low (<35 000) | 40.56 | 29.91 | 30.45 | <0.0001 | |||||||||||||||||||||||||||||||||||||||||||||||||||||||||||||||||||||||||||||||||||||||||||||||
| Medium (<100 000) | 44.25 | 43.74 | 42.23 | ||||||||||||||||||||||||||||||||||||||||||||||||||||||||||||||||||||||||||||||||||||||||||||||||
| High (≥100 000) | 15.19 | 26.34 | 27.32 | ||||||||||||||||||||||||||||||||||||||||||||||||||||||||||||||||||||||||||||||||||||||||||||||||
| Energy intake (kcal/d) | 1899.01 (1845.31, 1952.71) | 2120.94 (2067.18, 2174.71) | 2388.95 (2335.31, 2442.59) | <0.0001 | |||||||||||||||||||||||||||||||||||||||||||||||||||||||||||||||||||||||||||||||||||||||||||||||
| Physical activity (MET * h/wk) (%) | |||||||||||||||||||||||||||||||||||||||||||||||||||||||||||||||||||||||||||||||||||||||||||||||||||
| Low (< 3500/year) | 47.65 | 29.44 | 19.95 | <0.0001 | |||||||||||||||||||||||||||||||||||||||||||||||||||||||||||||||||||||||||||||||||||||||||||||||
| Medium (< 10 000/year) | 31.07 | 34.28 | 34.14 | ||||||||||||||||||||||||||||||||||||||||||||||||||||||||||||||||||||||||||||||||||||||||||||||||
| High (≥ 10 000/year) | 21.28 | 36.28 | 45.91 | ||||||||||||||||||||||||||||||||||||||||||||||||||||||||||||||||||||||||||||||||||||||||||||||||
| BMI, body mass index; DBP, diastolic blood pressure; MET, metabolic equivalent; SBP, systolic blood pressure. | |||||||||||||||||||||||||||||||||||||||||||||||||||||||||||||||||||||||||||||||||||||||||||||||||||
| * P for trend was anayzed by variance or chis-quare test. | |||||||||||||||||||||||||||||||||||||||||||||||||||||||||||||||||||||||||||||||||||||||||||||||||||
Handgrip strength and MetS
The association between relative handgrip strength and components of MetS in the male and female participants is shown in Table 2. Multivariable binary logistic regression was used to estimate the OR value and 95% CI. Relative handgrip strength was negatively associated with the prevalence of MetS in male and female participants, the OR (95% CI) values across the tertiles of relative handgrip strength were 1 (Reference), 0.45 (0.33, 0.62), 0.13 (0.08, 0.20) for male participants (Pfor trend <0.0001) and 1 (Reference), 0.35 (0.27, 0.46), 0.12 (0.08, 0.18) for female participants (Pfor trend <0.0001) after adjusting for age, race, drinking and smoking status, education level, household income, total energy intake, and physical activity. We additionally analysed the association between handgrip strength and components of MetS, and the results were comparable in both male and female participants.
Table 2. Association between handgrip and metabolic syndrome and its components in men and women.
| Men (N=2535) | Women (N=2521) | ||||||||||||||||||||||||||||||||||||||||||||||||||||||||||||||||||||||||||||||||||||||||||||||||||
| Tertiles of handgrip strength per body weight (kg/ kg) (range) | P for trendc | Tertiles of handgrip strength per body weight (kg/ kg) (range) | P for trendc | ||||||||||||||||||||||||||||||||||||||||||||||||||||||||||||||||||||||||||||||||||||||||||||||||
| Level 1 (0.13, 0.48) | Level 2 (0.48, 0.60) | Level 3 (0.60, 1.13) | level 1 (0.11, 0.36) | Level 2 (0.36, 0.46) | Level 3 (0.46, 0.77) | ||||||||||||||||||||||||||||||||||||||||||||||||||||||||||||||||||||||||||||||||||||||||||||||
| No. of participants (%) | 31.80 | 34.33 | 33.86 | 33.44 | 34.73 | 31.83 | |||||||||||||||||||||||||||||||||||||||||||||||||||||||||||||||||||||||||||||||||||||||||||||
| No. of participants with metabolic syndrome (%) | 61.50 | 37.24 | 11.84 | <0.0001 | 65.11 | 32.60 | 10.08 | <0.0001 | |||||||||||||||||||||||||||||||||||||||||||||||||||||||||||||||||||||||||||||||||||||||||||
| Crude model | Reference | 0.37 (0.28, 0.50) b | 0.08 (0.06, 0.12) | <0.0001 | Reference | 0.26 (0.21, 0.32) | 0.06 (0.04, 0.09) | <0.0001 | |||||||||||||||||||||||||||||||||||||||||||||||||||||||||||||||||||||||||||||||||||||||||||
| Adjusted model a | Reference | 0.45 (0.33, 0.62) | 0.13 (0.08, 0.20) | <0.0001 | Reference | 0.35 (0.27, 0.46) | 0.12 (0.08, 0.18) | <0.0001 | |||||||||||||||||||||||||||||||||||||||||||||||||||||||||||||||||||||||||||||||||||||||||||
| No. of participants with elevated waist circumference (%) | 75.88 | 40.28 | 6.67 | <0.0001 | 95.28 | 71.05 | 22.00 | <0.0001 | |||||||||||||||||||||||||||||||||||||||||||||||||||||||||||||||||||||||||||||||||||||||||||
| Crude model | Reference | 0.21 (0.16, 0.28) | 0.02 (0.02, 0.03) | <0.0001 | Reference | 0.12 (0.08, 0.20) | 0.01 (0.01, 0.02) | <0.0001 | |||||||||||||||||||||||||||||||||||||||||||||||||||||||||||||||||||||||||||||||||||||||||||
| Adjusted model a | Reference | 0.22 (0.17, 0.29) | 0.03 (0.02, 0.03) | <0.0001 | Reference | 0.14 (0.09, 0.23) | 0.02 (0.01, 0.03) | <0.0001 | |||||||||||||||||||||||||||||||||||||||||||||||||||||||||||||||||||||||||||||||||||||||||||
| No. of participants with elevated triglycerides (%) | 56.85 | 40.68 | 22.90 | <0.0001 | 53.63 | 29.76 | 16.44 | <0.0001 | |||||||||||||||||||||||||||||||||||||||||||||||||||||||||||||||||||||||||||||||||||||||||||
| Crude model | Reference | 0.52 (0.39, 0.70) | 0.23 (0.17, 0.30) | <0.0001 | Reference | 0.37 (0.29, 0.47) | 0.17 (0.12, 0.24) | <0.0001 | |||||||||||||||||||||||||||||||||||||||||||||||||||||||||||||||||||||||||||||||||||||||||||
| Adjusted model a | Reference | 0.67 (0.46, 0.98) | 0.39 (0.28, 0.53) | <0.0001 | Reference | 0.52 (0.40, 0.69) | 0.40 (0.28, 0.58) | <0.0001 | |||||||||||||||||||||||||||||||||||||||||||||||||||||||||||||||||||||||||||||||||||||||||||
| No. of participants with lower HDL (%) | 29.14 | 25.21 | 17.47 | <0.0001 | 42.05 | 30.27 | 19.38 | <0.0001 | |||||||||||||||||||||||||||||||||||||||||||||||||||||||||||||||||||||||||||||||||||||||||||
| Crude model | Reference | 0.82 (0.63, 1.07) | 0.51 (0.36, 0.73) | 0.0004 | Reference | 0.60 (0.48, 0.74) | 0.33 (0.26, 0.43) | <0.0001 | |||||||||||||||||||||||||||||||||||||||||||||||||||||||||||||||||||||||||||||||||||||||||||
| Adjusted model a | Reference | 0.81 (0.61, 1.08) | 0.51 (0.34, 0.76) | 0.0013 | Reference | 0.49 (0.38, 0.6) | 0.22 (0.15, 0.33) | <0.0001 | |||||||||||||||||||||||||||||||||||||||||||||||||||||||||||||||||||||||||||||||||||||||||||
| No. of participants with elevated blood pressure (%) | 56.77 | 40.05 | 22.38 | <0.0001 | 58.03 | 31.49 | 14.68 | <0.0001 | |||||||||||||||||||||||||||||||||||||||||||||||||||||||||||||||||||||||||||||||||||||||||||
| Crude model | Reference | 0.51 (0.37, 0.70) | 0.22 (0.17, 0.28) | <0.0001 | Reference | 0.33 (0.27, 0.41) | 0.13 (0.10, 0.16) | <0.0001 | |||||||||||||||||||||||||||||||||||||||||||||||||||||||||||||||||||||||||||||||||||||||||||
| Adjusted model a | Reference | 0.70 (0.49, 0.99) | 0.37 (0.28, 0.50) | <0.0001 | Reference | 0.49 (0.34, 0.69) | 0.33 (0.23, 0.48) | <0.0001 | |||||||||||||||||||||||||||||||||||||||||||||||||||||||||||||||||||||||||||||||||||||||||||
| No. of participants with elevated fasting glucose (%) | 65.16 | 51.63 | 33.98 | <0.0001 | 56.09 | 34.56 | 17.55 | <0.0001 | |||||||||||||||||||||||||||||||||||||||||||||||||||||||||||||||||||||||||||||||||||||||||||
| Crude model | Reference | 0.57 (0.44, 0.74) | 0.28 (0.22, 0.35) | <0.0001 | Reference | 0.41 (0.32, 0.53) | 0.17 (0.13, 0.22) | <0.0001 | |||||||||||||||||||||||||||||||||||||||||||||||||||||||||||||||||||||||||||||||||||||||||||
| Adjusted model a | Reference | 0.71 (0.52, 0.96) | 0.44 (0.32, 0.61) | <0.0001 | Reference | 0.56 (0.42, 0.75) | 0.33 (0.25, 0.45) | <0.0001 | |||||||||||||||||||||||||||||||||||||||||||||||||||||||||||||||||||||||||||||||||||||||||||
| a. Logistic regression adjusted for age, race, drinking status, smoking status, education level, income, total energy intake, and physical activity. | |||||||||||||||||||||||||||||||||||||||||||||||||||||||||||||||||||||||||||||||||||||||||||||||||||
| b. Odds ratio (95% confidence interval) (all such values). | |||||||||||||||||||||||||||||||||||||||||||||||||||||||||||||||||||||||||||||||||||||||||||||||||||
| HDL, high-density lipoprotein. | |||||||||||||||||||||||||||||||||||||||||||||||||||||||||||||||||||||||||||||||||||||||||||||||||||
| c. P for trend was analysed by multiple logistic regression analysis. | |||||||||||||||||||||||||||||||||||||||||||||||||||||||||||||||||||||||||||||||||||||||||||||||||||
To analyse the effect of BMI on the association between handgrip strength and components of MetS, we categorized BMI to lower BMI (BMI < 30) and higher BMI (BMI ≥ 30) groups. Supplementary Table 1 shows the results of the association between relative handgrip strength and components of MetS in male participants. Handgrip strength was negatively associated with the prevalence of MetS in male participants with BMI < 30 after adjusted by potential covariables. However, in male participants with BMI ≥ 30, the negative association was lost. In female participants, handgrip strength was negatively associated with the prevalence of MetS, in both BMI < 30 group and BMI ≥ 30 group (Supplementary Table 2).
The ROC curve was used to evaluate the performance of the adjusted model to analyse the association between relative handgrip strength and prevalence of MetS. The AUC with 95% CI for each adjusted model in both male and female participants is shown in Figure 1. The AUC value of the adjusted model for male participants was 0.76 (95% CI: 0.74, 0.78) and that for female participants was 0.80 (95% CI: 0.79, 0.82). The cut-off values of relative handgrip strength were 0.52 and 0.40 for male and female participants, respectively.
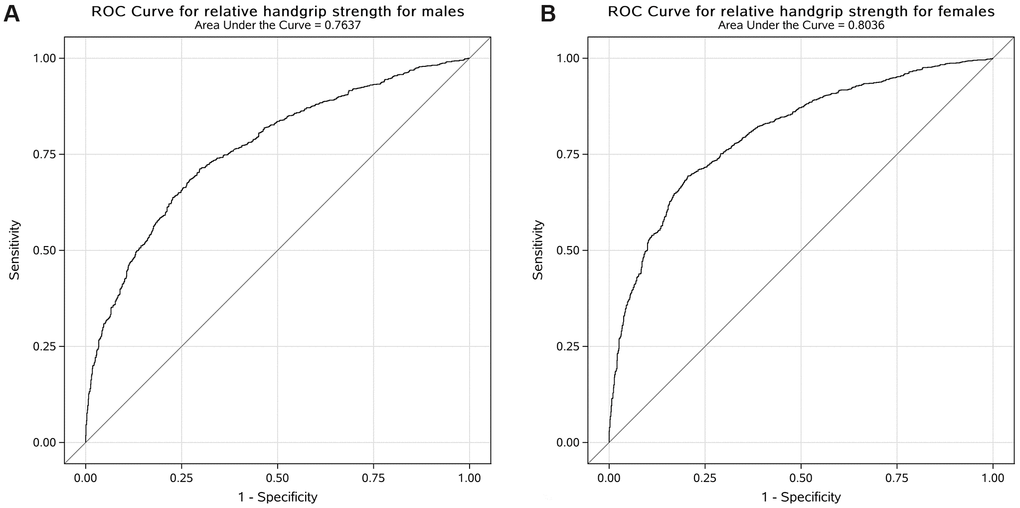
Figure 1. Receiver operating characteristic curve for the adjusted model to analyse the association between relative handgrip strength and prevalence of MetS in US male (A) and female (B) participants.
Discussion
In this cross-sectional study, we explored the associations between handgrip strength and MetS in general US adults. The results demonstrated that higher handgrip strength was associated with lower prevalence of MetS in both male and female participants after adjustments of age, race, drinking status, smoking status, educational level, household income, total energy intake, and physical activity. We further generated ROC curves to quantify the AUC and the cut-off points of handgrip strength associated with the prevalence of MetS in both male and female participants.
In this study, the prevalence rates of MetS were 36.4% and 36.3% in US men and women, respectively. The results were close to the last report using data from the 2011-2012 wave of the NHANES, which found that the prevalence rates of MetS in the US were 32.8% and 36.6% in men and women, respectively [5].
Handgrip strength is a simple and reliable measurement of upper body strength and muscle mass [29]. Moreover, compared to supine bench press and seated leg press, handgrip strength is much easier to assess. Thus, handgrip strength could be a flexible indicator for screening MetS. A few previous studies have investigated the associations between handgrip strength and prevalence of MetS in different populations [24, 25, 27, 29]. A cross-sectional study conducted in Australian men found that the odds for the prevalence of MetS increased for lower muscle strength per body weight [24]. Another study conducted in Korea found that grip strength per body weight was lower in participants with MetS than in those without MetS [25]. A large Chinese population-based study also found that handgrip strength per body weight was inversely associated with MetS [27]. The ORs (95% CI) of MetS across decreasing handgrip strength per weight quartiles were 1.00 (reference), 1.87 (1.66, 2.11), 2.40 (2.13, 2.71), and 3.36 (2.97, 3.80) in men and 1.00 (reference), 1.80 (1.48, 2.21), 2.77 (2.29, 3.36), and 3.89 (3.22, 4.71) in women [27]. Most recently, another cross-sectional study including 488 male and 521 female participants found that low handgrip strength per body weight was associated with higher prevalence of MetS [29]. Compared with participants in the highest tertile of handgrip strength per weight, those in the lowest tertile had 2.52 (95% CI, 1.43-4.46) and 5.01 (95% CI, 1.66-15.08) times higher prevalence of MetS in male and female participants, respectively [29].
In line with previous studies, we found that higher handgrip strength per body weight was associated with lower prevalence of MetS after adjustments of confounding factors in the present study. The mechanisms that have been proposed to explain this association are mainly related to insulin resistance and inflammation. Muscles are major sites of insulin-stimulated whole-body glucose disposal and muscle metabolism can influence whole-body glucose homeostasis and insulin sensitivity [38]. Meanwhile, insulin resistance is the most accepted unifying theory explaining the pathophysiology of MetS [39]. Moreover, low muscle strength and mass were associated with high level of inflammation markers, such as C-reactive protein [40] and neutrophil-lymphocyte ratio [41]. A chronic state of inflammation also appears to be a central mechanism underlying the pathophysiology of insulin resistance and MetS [42]. Previous studies also demonstrated that skeletal muscles could release factors such as irisin [21] and myonectin [43], which can exert endocrine effects and consequently contribute to risk factors of MetS [44, 45]. Thus, lower muscle strength and mass could lead to the development of MetS.
Furthermore, the ROC curves were generated to determine the cut-off points of handgrip strength per body weight associated with MetS. Results suggested that the cut-off points were 0.52 and 0.40 kg/kg of handgrip strength per body weight in men and women, respectively. The results were in line with a previous study that analysed 17,703 Chinese adults and found that the optimal cut-off values were 0.56 and 0.40 in men and women, respectively [27]. Another study found that the cut-off points were 2.57 and 2.35 kg/kg bench press and leg press per body weight in US men aged < 50 years and ≥ 50 years [30]. However, to the best of our knowledge, this is the first study that used handgrip strength, which is easier to employ in both clinical and community settings, to calculate cut-off points of muscle strength associated with MetS.
Some limitations are notable in this study. Firstly, given the nature of observational study design, the mechanism underlying the associations cannot be illuminated. Secondly, even though we have adjusted confounding factors, we cannot rule out the possibility that unmeasured factors might contribute to the associations observed. Thirdly, selection bias may exist because lots of participates were excluded from the study. However, NHANES is unique in collecting person-level demographic, health, and nutrition information from personal interviews (interview) and a standardized physical examination in a mobile examination center (MEC). The examination includes objective measures of health status, including height, weight, blood pressure, and the collection of blood and urine specimens for laboratory testing. For some of these components, subsampling was required to reduce respondent burden and facilitate the scheduling and completion of examinations. In addition, weights were assigned to each component during sampling and analysis process. So sample representativeness was not been affected. Furthermore, considering the different definitions of MetS between studies, the comparability and generality of this study was limited. Finally, this study was conducted in a population of US adults, which could limit the generalizability of results to other populations.
In conclusion, findings from this study show that relative handgrip is negatively associated with the prevalence of MetS which defined by a joint multinational interim statement in men with BMI < 30 and women. Handgrip strength per weight lower than 0.52 (kg/ kg) in men and 0.40 (kg/ kg) in women may increase the risk of MetS. Enhancing muscle strength activities may be a new perspective for prevent MetS. Handgrip strength test may be a simple way to identify MetS. And further random controlled trial studies and cohort studies were needed.
Materials and Methods
Study population
NHANES, a program of studies conducted by the Centers for Disease Control and Prevention’s (CDC) National Center for Health Statistics (NCHS), was designed to assess the health and nutritional status of adults and children in the US. NHANES uses a complex, multistage, probability sampling design to select participants representative of the civilian, non-institutionalized US population. Household interviews and physical and laboratory examinations were included in the survey [46]. Handgrip strength data are available for 2011-2012 and 2013-2014 survey cycles. Participants aged ≥20 years were included. All adults provided written consent to participate in NHANES, which was reviewed and approved by the NCHS Research Ethics Review Board.
Handgrip strength
Handgrip strength was measured using a Takei Digital Grip Strength Dynamometer (T.K.K. 5401) to the nearest 0.1 kg. Participants were asked to remove hand and wrist jewellery and adjust the grip size of the dynamometer until the second joint of the index finger was at 90°. After a practice trial, each hand of the participants would be tested three times, alternating hands between trials with a 60-s rest between measurements on the same hand. Participants stood straight with their feet and hip apart and arms fully extended alongside with palms facing their thighs. The participant’s hand, which was in line with the wrist and forearm, quickly and forcefully squeezed the dynamometer handle at their maximum strength. The complete handgrip strength testing protocol is described in the NHANES muscle strength procedure manual (https://wwwn.cdc.gov/nchs/nhanes). To avoid the potential bias effect of body weight on the estimation of handgrip strength, relative handgrip strength (handgrip/body weight) was calculated to assess the handgrip strength.
Metabolic syndrome
MetS was defined according to the joint scientific statement of harmonizing the MetS criteria as participants presented three or more of the following components [47]: (1) waist circumference ≥88 cm in women and ≥102 cm in men; (2) elevated plasma triglycerides ≥150 mg/dl (1.7 mmol/L), or treatment for elevated triglycerides; (3) reduced high-density lipoprotein cholesterol <40 mg/dl (1.0 mmol/L) in men, and <50 mg/dl (1.3 mmol/L) in women, or treatment for reduced high-density lipoprotein cholesterol; (4) evaluated blood pressure (BP): systolic blood pressure (SBP) ≥130 mm Hg and/or diastolic blood pressure (DBP) ≥85 mm Hg, or antihypertensive drug treatment; (5) high fasting glucose ≥100 mg/dl, or drug treatment for elevated glucose.
Assessment and definition of other variables
Age, gender, race, education, household income, diet, physical activity, and tobacco and alcohol use were self-reported. Race was classified as Mexican American, other Hispanic, Non-Hispanic White, Non-Hispanic Black, and other Race. Education level was categorized into high school and lower (≤3) and college graduate and above (4-5). Household income was categorized as low (< 3500/year), medium (< 100000/year), and high (≥ 100000/year).
Standing height was measured to the nearest 0.1 cm by a stadiometer platform. A digital weighing scale was used to measure weight to the nearest 0.1 kg. Body mass index (BMI) was calculated as weight in kilograms divided by height in meters squared. Waist circumference was measured at the horizontal plane of the iliac crest to the nearest millimetre, using a measuring tape [48].
Seated resting BP was obtained by a trained physician using a Baumanometer® calibrated mercury true gravity wall model sphygmomanometer and Baumanometer® Calibrated V-Lok® cuffs. All participants sat all the way to the back of the height-adjustable chair to keep the spine straight and rested quietly for 5 min prior to BP measurement. The arm was bare and unrestricted by clothing with the palm turned upward. The elbow was slightly flexed, and the midpoint of the upper arm was at the level of the heart. Three consecutive BP readings were obtained by auscultation. A fourth attempt was performed if a BP measurement was interrupted or incomplete. All BP determinations (systolic and diastolic) were performed in the NHAES Mobile Examination Center.
Physical activity was assessed using the Global Physical Activity Questionnaire. Participants were asked to report the frequency and duration of leisure-time physical activities in a typical week. According to physical activity guidelines [49], vigorous-intensity activity and moderate-intensity activity were translated to metabolic equivalent values; therefore, the total physical activity (metabolic equivalent value per week) for each participant was calculated. Dietary intake was assessed via two 24-h recall interviews. Energy intake was later quantified for each food recorded during the survey.
Statistical analysis
Participants’ baseline characteristics have been presented as least square means (with 95% confidence interval, CI) for continuous variables. Categorical variables were presented as percentages. Relative handgrip strength was categorized into sex-specific tertiles and sex-BMI-specific tertiles in separate models. Multivariable logistic regression was used to estimate the ORs with 95% CIs of associations between tertiles of relative handgrip strength and MetS with each component. The linear trend across increasing tertiles was tested using the median value of each tertile as a continuous variable based on logistic regression. The crude model was unadjusted. To estimate the potential differences in confounding effects, we adjusted for covariates including age, race, drinking and smoking status, education level, household income, total energy intake, and physical activity. The area under receiver operating characteristic (ROC) curve (AUC) with 95% CI was calculated to assess the performance of the multivariable logistic model. The cutoff value of relative handgrip strength associated with MetS was quantified by ROC curve.
All models were estimated using appropriate SAS survey procedures and NHANES strata, cluster, and sampling probability weights to account for the NHANES complex survey design and to produce unbiased national estimates. Sampling probability weights were appropriately constructed based on NHANES guidance. All data management and analyses were performed using SAS version 9.4 (SAS Institute Inc., Cary, NC). Two-sided P<0.05 was considered significant.
Research data (data sharing and collaboration)
NHANES is an open database. All the data from this study could be acquired through the website https://www.cdc.gov/nchs/nhanes/.
Supplementary Materials
Author Contributions
Yuhong Zhao, Yang Xia, and Chao Ji designed and conducted this study; Chao Ji and Yang Xia managed and analysed the data and wrote the manuscript as co-first authors. Qijun Wu and Shuhui Tong revised the manuscript. Yuhong Zhao had full access to all data in the study and takes responsibility for the integrity of the data and the accuracy of data analysis. All authors approved the final manuscript.
Acknowledgments
The authors thank Yang Xia and Qijun Wu for their help and support for this study.
Conflicts of Interest
On behalf of all authors, the corresponding author states that there is no conflicts of interest.
Funding
This study was supported by grants from the National Key Research and Development Program of China [No. 2017YFC0907402 to Yuhong Zhao], Natural Science Foundation of China [No. 81903302 to Yang Xia], and China Postdoctoral Science Foundation Funded Project [No. 2018M641753 to Yang Xia], and 345 Talent Project of Shengjing Hospital of China Medical University [No. M0294 to Yang Xia].
References
- 1. Lusis AJ, Attie AD, Reue K. Metabolic syndrome: from epidemiology to systems biology. Nat Rev Genet. 2008; 9:819–30. https://doi.org/10.1038/nrg2468 [PubMed]
- 2. Mendonça FM, de Sousa FR, Barbosa AL, Martins SC, Araújo RL, Soares R, Abreu C. Metabolic syndrome and risk of cancer: which link? Metabolism. 2015; 64:182–89. https://doi.org/10.1016/j.metabol.2014.10.008 [PubMed]
- 3. Hammarsten J, Damber JE, Haghsheno MA, Mellström D, Peeker R. A stage-dependent link between metabolic syndrome components and incident prostate cancer. Nat Rev Urol. 2018; 15:321–33. https://doi.org/10.1038/nrurol.2018.8 [PubMed]
- 4. Nderitu P, Bosco C, Garmo H, Holmberg L, Malmström H, Hammar N, Walldius G, Jungner I, Ross P, Van Hemelrijck M. The association between individual metabolic syndrome components, primary liver cancer and cirrhosis: A study in the Swedish AMORIS cohort. Int J Cancer. 2017; 141:1148–60. https://doi.org/10.1002/ijc.30818 [PubMed]
- 5. Aguilar M, Bhuket T, Torres S, Liu B, Wong RJ. Prevalence of the metabolic syndrome in the United States, 2003-2012. JAMA. 2015; 313:1973–74. https://doi.org/10.1001/jama.2015.4260 [PubMed]
- 6. Bohannon RW. Test-retest reliability of hand-held dynamometry during a single session of strength assessment. Phys Ther. 1986; 66:206–09. https://doi.org/10.1093/ptj/66.2.206 [PubMed]
- 7. Ruprai R, Tajpuriya S, Mishra N. Handgrip strength as determinant of upper body strength/physical fitness: a comparative study among individuals performing gymnastics (ring athletes) and gymnasium (powerlifters). Int J Med Sci Public Health. 2016; 5:1167–72. https://doi.org/10.5455/ijmsph.2016.09102015176
- 8. Melanson EL, Astrup A, Donahoo WT. The relationship between dietary fat and fatty acid intake and body weight, diabetes, and the metabolic syndrome. Ann Nutr Metab. 2009; 55:229–43. https://doi.org/10.1159/000229004 [PubMed]
- 9. Hong S, Lee J, Park J, Lee M, Kim JY, Kim KC, Kim SH, Im JA, Chu SH, Suh SH, Kim SH, Jeon JY. Association between cardiorespiratory fitness and the prevalence of metabolic syndrome among Korean adults: a cross sectional study. BMC Public Health. 2014; 14:481. https://doi.org/10.1186/1471-2458-14-481 [PubMed]
- 10. Cheng YJ, Gregg EW, De Rekeneire N, Williams DE, Imperatore G, Caspersen CJ, Kahn HS. Muscle-strengthening activity and its association with insulin sensitivity. Diabetes Care. 2007; 30:2264–70. https://doi.org/10.2337/dc07-0372 [PubMed]
- 11. Mizgier ML, Casas M, Contreras-Ferrat A, Llanos P, Galgani JE. Potential role of skeletal muscle glucose metabolism on the regulation of insulin secretion. Obes Rev. 2014; 15:587–97. https://doi.org/10.1111/obr.12166 [PubMed]
- 12. Bentley DC, Nguyen CH, Thomas SG. High-intensity handgrip training lowers blood pressure and increases heart rate complexity among postmenopausal women: a pilot study. Blood Press Monit. 2018; 23:71–78. https://doi.org/10.1097/MBP.0000000000000313 [PubMed]
- 13. Li F, Li Y, Duan Y, Hu CA, Tang Y, Yin Y. Myokines and adipokines: involvement in the crosstalk between skeletal muscle and adipose tissue. Cytokine Growth Factor Rev. 2017; 33:73–82. https://doi.org/10.1016/j.cytogfr.2016.10.003 [PubMed]
- 14. Ouchi N, Ohashi K, Shibata R, Murohara T. Protective Roles of Adipocytokines and Myokines in Cardiovascular Disease. Circ J. 2016; 80:2073–80. https://doi.org/10.1253/circj.CJ-16-0663 [PubMed]
- 15. Zhao Y, Li N, Li Z, Zhang D, Chen L, Yao Z, Niu W. Conditioned medium from contracting skeletal muscle cells reverses insulin resistance and dysfunction of endothelial cells. Metabolism. 2018; 82:36–46. https://doi.org/10.1016/j.metabol.2017.12.008 [PubMed]
- 16. Nielsen AR, Hojman P, Erikstrup C, Fischer CP, Plomgaard P, Mounier R, Mortensen OH, Broholm C, Taudorf S, Krogh-Madsen R, Lindegaard B, Petersen AM, Gehl J, Pedersen BK. Association between interleukin-15 and obesity: interleukin-15 as a potential regulator of fat mass. J Clin Endocrinol Metab. 2008; 93:4486–93. https://doi.org/10.1210/jc.2007-2561 [PubMed]
- 17. McPherron AC, Lawler AM, Lee SJ. Regulation of skeletal muscle mass in mice by a new TGF-beta superfamily member. Nature. 1997; 387:83–90. https://doi.org/10.1038/387083a0 [PubMed]
- 18. Liu XH, Bauman WA, Cardozo CP. Myostatin inhibits glucose uptake via suppression of insulin-dependent and -independent signaling pathways in myoblasts. Physiol Rep. 2018; 6:e13837. https://doi.org/10.14814/phy2.13837 [PubMed]
- 19. Guillet C, Boirie Y. Insulin resistance: a contributing factor to age-related muscle mass loss? Diabetes Metab. 2005; 31:5S20–5S26. https://doi.org/10.1016/s1262-3636(05)73648-x [PubMed]
- 20. Ruderman NB, Carling D, Prentki M, Cacicedo JM. AMPK, insulin resistance, and the metabolic syndrome. J Clin Invest. 2013; 123:2764–72. https://doi.org/10.1172/JCI67227 [PubMed]
- 21. Boström P, Wu J, Jedrychowski MP, Korde A, Ye L, Lo JC, Rasbach KA, Boström EA, Choi JH, Long JZ, Kajimura S, Zingaretti MC, Vind BF, et al. A PGC1-α-dependent myokine that drives brown-fat-like development of white fat and thermogenesis. Nature. 2012; 481:463–68. https://doi.org/10.1038/nature10777 [PubMed]
- 22. Arhire LI, Mihalache L, Covasa M. Irisin: A Hope in Understanding and Managing Obesity and Metabolic Syndrome. Front Endocrinol (Lausanne). 2019; 10:524. https://doi.org/10.3389/fendo.2019.00524 [PubMed]
- 23. Sayer AA, Syddall HE, Dennison EM, Martin HJ, Phillips DI, Cooper C, Byrne CD; Hertfordshire Cohort. Grip strength and the metabolic syndrome: findings from the Hertfordshire Cohort Study. QJM. 2007; 100:707–13. https://doi.org/10.1093/qjmed/hcm095 [PubMed]
- 24. Atlantis E, Martin SA, Haren MT, Taylor AW, Wittert GA, and Members of the Florey Adelaide Male Ageing Study. Inverse associations between muscle mass, strength, and the metabolic syndrome. Metabolism. 2009; 58:1013–22. https://doi.org/10.1016/j.metabol.2009.02.027 [PubMed]
- 25. Yang EJ, Lim S, Lim JY, Kim KW, Jang HC, Paik NJ. Association between muscle strength and metabolic syndrome in older Korean men and women: the Korean Longitudinal Study on Health and Aging. Metabolism. 2012; 61:317–24. https://doi.org/10.1016/j.metabol.2011.07.005 [PubMed]
- 26. Vieira DC, Tibana RA, Tajra V, Nascimento DC, de Farias DL, Silva AO, Teixeira TG, Fonseca RM, de Oliveira RJ, Mendes FA, Martins WR, Funghetto SS, Karnikowski MG, et al. Decreased functional capacity and muscle strength in elderly women with metabolic syndrome. Clin Interv Aging. 2013; 8:1377–86. https://doi.org/10.2147/CIA.S50333 [PubMed]
- 27. Wu H, Liu M, Chi VT, Wang J, Zhang Q, Liu L, Meng G, Yao Z, Bao X, Gu Y, Zhang S, Sun S, Zhou M, et al. Handgrip strength is inversely associated with metabolic syndrome and its separate components in middle aged and older adults: a large-scale population-based study. Metabolism. 2019; 93:61–67. https://doi.org/10.1016/j.metabol.2019.01.011 [PubMed]
- 28. Castro-Piñero J, Laurson KR, Artero EG, Ortega FB, Labayen I, Ruperez AI, Zaqout M, Manios Y, Vanhelst J, Marcos A, Polito A, Gonzalez-Gross M, Widhalm K, et al. Muscle strength field-based tests to identify European adolescents at risk of metabolic syndrome: the HELENA study. J Sci Med Sport. 2019; 22:929–34. https://doi.org/10.1016/j.jsams.2019.04.008 [PubMed]
- 29. Byeon JY, Lee MK, Yu MS, Kang MJ, Lee DH, Kim KC, Im JA, Kim SH, Jeon JY. Lower Relative Handgrip Strength is Significantly Associated with a Higher Prevalence of the Metabolic Syndrome in Adults. Metab Syndr Relat Disord. 2019; 17:280–88. https://doi.org/10.1089/met.2018.0111 [PubMed]
- 30. Sénéchal M, McGavock JM, Church TS, Lee DC, Earnest CP, Sui X, Blair SN. Cut points of muscle strength associated with metabolic syndrome in men. Med Sci Sports Exerc. 2014; 46:1475–81. https://doi.org/10.1249/MSS.0000000000000266 [PubMed]
- 31. Leong DP, Teo KK, Rangarajan S, Lopez-Jaramillo P, Avezum A
Jr , Orlandini A, Seron P, Ahmed SH, Rosengren A, Kelishadi R, Rahman O, Swaminathan S, Iqbal R, et al, and Prospective Urban Rural Epidemiology (PURE) Study investigators. Prognostic value of grip strength: findings from the Prospective Urban Rural Epidemiology (PURE) study. Lancet. 2015; 386:266–73. https://doi.org/10.1016/S0140-6736(14)62000-6 [PubMed] - 32. Slagter SN, van Waateringe RP, van Beek AP, van der Klauw MM, Wolffenbuttel BH, van Vliet-Ostaptchouk JV. Sex, BMI and age differences in metabolic syndrome: the Dutch Lifelines Cohort Study. Endocr Connect. 2017; 6:278–88. https://doi.org/10.1530/EC-17-0011 [PubMed]
- 33. Goldberg IJ, Vanni-Reyes T, Ramakrishnan S, Holleran S, Ginsberg HN. Circulating lipoprotein profiles are modulated differently by lipoprotein lipase in obese humans. J Cardiovasc Risk. 2000; 7:41–47. https://doi.org/10.1177/204748730000700108 [PubMed]
- 34. Miksztowicz V, Schreier L, McCoy M, Lucero D, Fassio E, Billheimer J, Rader DJ, Berg G. Role of SN1 lipases on plasma lipids in metabolic syndrome and obesity. Arterioscler Thromb Vasc Biol. 2014; 34:669–75. https://doi.org/10.1161/ATVBAHA.113.303027 [PubMed]
- 35. O’Gorman DJ, Krook A. Exercise and the treatment of diabetes and obesity. Med Clin North Am. 2011; 95:953–69. https://doi.org/10.1016/j.mcna.2011.06.007 [PubMed]
- 36. Norvik JV, Storhaug HM, Ytrehus K, Jenssen TG, Zykova SN, Eriksen BO, Solbu MD. Overweight modifies the longitudinal association between uric acid and some components of the metabolic syndrome: the Tromsø Study. BMC Cardiovasc Disord. 2016; 16:85. https://doi.org/10.1186/s12872-016-0265-8 [PubMed]
- 37. Flock MR, Green MH, Kris-Etherton PM. Effects of adiposity on plasma lipid response to reductions in dietary saturated fatty acids and cholesterol. Adv Nutr. 2011; 2:261–74. https://doi.org/10.3945/an.111.000422 [PubMed]
- 38. Wu H, Ballantyne CM. Skeletal muscle inflammation and insulin resistance in obesity. J Clin Invest. 2017; 127:43–54. https://doi.org/10.1172/JCI88880 [PubMed]
- 39. Mikhail N. The metabolic syndrome: insulin resistance. Curr Hypertens Rep. 2009; 11:156–58. https://doi.org/10.1007/s11906-009-0027-4 [PubMed]
- 40. Koo BK, Kim D, Joo SK, Kim JH, Chang MS, Kim BG, Lee KL, Kim W. Sarcopenia is an independent risk factor for non-alcoholic steatohepatitis and significant fibrosis. J Hepatol. 2017; 66:123–31. https://doi.org/10.1016/j.jhep.2016.08.019 [PubMed]
- 41. Öztürk ZA, Kul S, Türkbeyler IH, Sayıner ZA, Abiyev A. Is increased neutrophil lymphocyte ratio remarking the inflammation in sarcopenia? Exp Gerontol. 2018; 110:223–29. https://doi.org/10.1016/j.exger.2018.06.013 [PubMed]
- 42. Welty FK, Alfaddagh A, Elajami TK. Targeting inflammation in metabolic syndrome. Transl Res. 2016; 167:257–80. https://doi.org/10.1016/j.trsl.2015.06.017 [PubMed]
- 43. Gamas L, Matafome P, Seiça R. Irisin and Myonectin Regulation in the Insulin Resistant Muscle: Implications to Adipose Tissue: Muscle Crosstalk. J Diabetes Res. 2015; 2015:359159. https://doi.org/10.1155/2015/359159 [PubMed]
- 44. Pourranjbar M, Arabnejad N, Naderipour K, Rafie F. Effects of Aerobic Exercises on Serum Levels of Myonectin and Insulin Resistance in Obese and Overweight Women. J Med Life. 2018; 11:381–86. https://doi.org/10.25122/jml-2018-0033 [PubMed]
- 45. Jang HB, Kim HJ, Kang JH, Park SI, Park KH, Lee HJ. Association of circulating irisin levels with metabolic and metabolite profiles of Korean adolescents. Metabolism. 2017; 73:100–08. https://doi.org/10.1016/j.metabol.2017.05.007 [PubMed]
- 46. Johnson CL, Dohrmann SM, Burt VL, Mohadjer LK. National health and nutrition examination survey: sample design, 2011-2014. Vital Health Stat 2. 2014; 162:1–33. [PubMed]
- 47. Alberti KG, Eckel RH, Grundy SM, Zimmet PZ, Cleeman JI, Donato KA, Fruchart JC, James WP, Loria CM, Smith SC
Jr , and International Diabetes Federation Task Force on Epidemiology and Prevention, and Hational Heart, Lung, and Blood Institute, and American Heart Association, and World Heart Federation, and International Atherosclerosis Society, and International Association for the Study of Obesity. Harmonizing the metabolic syndrome: a joint interim statement of the International Diabetes Federation Task Force on Epidemiology and Prevention; National Heart, Lung, and Blood Institute; American Heart Association; World Heart Federation; International Atherosclerosis Society; and International Association for the Study of Obesity. Circulation. 2009; 120:1640–45. https://doi.org/10.1161/CIRCULATIONAHA.109.192644 [PubMed] - 48. Centers for Disease Control and Prevention (CDC), National Center for Health Statistics (NCHS). National Health and Nutrition Examination Survey (NHANES) Anthropometry Procedures Manual. https://wwwn.cdc.gov/nchs/data/nhanes/2013-2014/manuals/2013_Anthropometry.pdf.
- 49. World Health Organization (WHO). Global recommendations on physical activity for health. Geneva: WHO Press; 2010.